Reliance Industries - Analysis & BTO,STC Strategy derivedThe chart provided is a daily candlestick chart for RELIANCE. Here are some key observations:
Recent Uptrend: The price has shown a significant upward movement starting in early April 2025, culminating in a recent high. This aligns with the positive sentiment following the earnings report released on April 25, 2025.
Bollinger Bands: The price has recently broken above the upper Bollinger Band, suggesting potential overbought conditions in the short term but also indicating strong upward momentum.
Moving Averages: The price is trading well above the 20-day Simple Moving Average (SMA), further confirming the uptrend. The 50-day and 200-day SMAs (not explicitly shown with values but implied by the longer-term trend) likely lie below the current price, indicating a broader bullish trend.
Fibonacci Retracement: The chart shows Fibonacci retracement levels drawn from a recent swing high around ₹1,503.85 and a swing low around ₹1,202.45. The price has currently surpassed the 0.618 Fibonacci retracement level (approximately ₹1,390).
Reasons for the Uptrend Based on the Earnings Report:
The positive uptrend is likely fueled by the following key highlights from the recent earnings report:
Strong Consolidated Performance: Both revenue and net profit showed healthy year-on-year growth for Q4 FY25 and the full financial year FY25, indicating a strong overall financial performance.
Robust Growth in Consumer Businesses: Reliance Retail and Reliance Jio demonstrated significant growth in revenue and profitability, driven by factors like store expansion, increased subscriber base, and improved ARPU. These consumer-facing businesses are key growth drivers for RIL.
Positive Outlook and Initiatives: The company's progress in new energy initiatives (solar panel and battery manufacturing) and strategic acquisitions signal future growth potential and investor confidence.
Dividend Announcement: The recommendation of a final dividend is generally viewed positively by investors.
Market Sentiment: The overall market reaction to the earnings report was positive, leading to increased buying interest in the stock.
Trading Strategies and Levels:
Based on the current chart and the positive earnings report, here are potential trading scenarios for both options and equity, along with suggested take profit (TP) and stop loss (SL) levels and risk-reward ratios.
1. Equity Trading:
Immediate Support: ₹1,368.70 (This level has acted as a recent pivot and is close to the current price).
Next Level Support: ₹1,332.40 (This level aligns with the 0.382 Fibonacci retracement and a previous consolidation area).
Immediate Resistance: ₹1,417.85 (This is the level the price is currently testing and the 0.786 Fibonacci retracement).
Next Level Resistance (Potential Take Profit 1): ₹1,503.85 (This is the previous swing high and the 1.0 Fibonacci extension of the recent move).
Potential Take Profit 2: Above ₹1,503.85 (If the upward momentum continues strongly, targeting higher Fibonacci extensions or previous all-time highs, if applicable).
Potential Long Entry: Consider a long position on a pullback towards the immediate support level of ₹1,368.70, provided there are bullish confirmation signals (e.g., a bullish candlestick pattern).
Stop Loss: Place the stop loss below the next level of support at ₹1,332.40 to limit potential losses.
Take Profit 1: ₹1,503.85
Risk-Reward Ratio (Entry at ₹1,368.70, SL at ₹1,332.40, TP at ₹1,503.85):
Risk per share = ₹1,368.70 - ₹1,332.40 = ₹36.30
Reward per share = ₹1,503.85 - ₹1,368.70 = ₹135.15
Risk-Reward Ratio = ₹135.15 / ₹36.30 ≈ 3.72 : 1 (Favorable)
2. Options Trading:
Given the bullish sentiment, traders might consider buying call options or call spreads.
Bull Call Spread:
Buy: A call option with a strike price near the current resistance level (e.g., ₹1,420 strike price expiring in the near term).
Sell: A call option with a higher strike price as the target (e.g., ₹1,500 strike price with the same expiry).
Potential Profit: Limited to the difference between the strike prices minus the net premium paid.
Maximum Loss: Limited to the net premium paid.
Stop Loss (Strategy Level): If the underlying price breaks below the immediate support level (₹1,368.70), consider exiting the spread to limit losses.
Profit Target: If the price reaches or surpasses the higher strike price (₹1,500).
Profit/Loss Ratio: This depends on the premiums paid and received. Calculate the maximum profit and maximum loss before entering the trade to assess the ratio. For example, if the net premium paid is ₹15 and the difference between strikes is ₹80, the max profit is ₹65 and the max loss is ₹15, resulting in a ratio of approximately 4.33 : 1.
Buying a Call Option:
Buy: A call option with a strike price near the current price or slightly out-of-the-money (OTM).
Potential Profit: Unlimited if the price moves significantly above the strike price.
Maximum Loss: Limited to the premium paid.
Stop Loss (Price Level): Set a stop loss on the underlying price (e.g., below the immediate support of ₹1,368.70) to protect the premium.
Take Profit: Based on the resistance levels identified (₹1,503.85 and above) or based on a target profit in terms of premium multiple.
Profit/Loss Ratio: Highly variable depending on the price movement and premium paid.
Important Considerations for Options Trading:
Time Decay (Theta): Options lose value over time, especially as they approach their expiry date. This is a crucial factor to consider, especially for short-term trades.
Volatility (Vega): Changes in implied volatility can significantly impact option prices. Earnings announcements often lead to a spike in volatility, which may decrease after the event.
Expiry Date: Choose an expiry date that aligns with your trading timeframe and expectations for the price movement.
Disclaimer:
This analysis is for informational and educational purposes only and should not be considered as financial advice. Trading in equities and options involves significant risks, and you could lose your entire investment. Always conduct your own thorough research and consult with a qualified financial advisor before making any trading decisions. The levels provided are based on the current chart and may not hold true in the future. Market conditions can change rapidly.
Fundamental Analysis

EURUSD Before NFPToday, the U.S. Non-Farm Payroll (NFP) data will be released.
The news is published every first Friday of the month at 3:30 PM London time and has a significant impact on the markets.
It is advisable to reduce risk on all open positions and avoid entering new trades before the news release.
Watch how the price reacts around key levels and whether it shows strength to continue the trend.

Gold Price Analysis May 1The D1 candle has broken out in a bearish direction. It is not surprising that the price broke Dow and decreased according to yesterday's Plan.
Gold confirmed the selling side won, so today's strategy is to watch for SELL. The SELL point pays attention to the 2 break zones of 3270 and 3302. The BUY point with the Scalping element pays attention to 3216 and today's main support is 3195.
The current trading strategy is that gold is approaching the 3237 resistance. If it confirms closing above this zone, it will give a BUY signal to 3251 and consider the price reaction of the US session. If it breaks 3241, it will hold until 3270. On the contrary, if it does not break 3237, it can SELL to 3216 and trade according to the noted port zones.

HDFC Life Insurance – Bullish Breakout on Monthly ChartHDFCLIFE is forming a strong ascending triangle on the monthly chart, signaling long-term bullish potential. A breakout above ₹750 with volume can trigger a fresh rally toward ₹880–₹920 in the coming months. RSI is trending up with strong momentum, which confirms buying interest. In the short term, ₹715 acts as support. Long-term investors can accumulate on dips.
Short-Term View: Buy on dips above ₹715 | Target ₹780
Long-Term View: Breakout above ₹750 | Target ₹900+
For educational purposes only

Gold PULLBACK 3283 3300when it fell to the 50% fibo level of wave 2960-3500, gold immediately rebounded. It has now surpassed the 3233 level. 3268 is the closest target. We expect a strong increase to the 3283-3300 zone. After that, Gold may sell off to 3150 3170 target

NVDA Day Trade Plan for 04/29/2025NVDA Day Trade Plan for 04/29/2025
📈 111.90 109.90
📉 105.90 103.90
Thanks to all my followers! Truly appreciate the support!
Please like and share for more ES/NQ levels Tues & Thurs 🤓📈📉🎯💰
*These levels are derived from comprehensive backtesting and research and a quantitative system demonstrating high accuracy. This statistical foundation suggests that price movements are likely to exceed initial estimates.*


TQQQ Day Trade Plan for 04/29/2025TQQQ Day Trade Plan for 04/29/2025
📈 55.10 55.60
📉 52.10 51.60
Thanks to all my followers! Truly appreciate the support!
Please like and share for more ES/NQ levels Tues & Thurs 🤓📈📉🎯💰
*These levels are derived from comprehensive backtesting and research and a quantitative system demonstrating high accuracy. This statistical foundation suggests that price movements are likely to exceed initial estimates.*

TSLA Day Trade Plan for 04/29/2025TSLA Day Trade Plan for 04/29/2025
📈 299 305
📉 274.50 268.50
Thanks to all my followers! Truly appreciate the support!
Please like and share for more ES/NQ levels Tues & Thurs 🤓📈📉🎯💰
*These levels are derived from comprehensive backtesting and research and a quantitative system demonstrating high accuracy. This statistical foundation suggests that price movements are likely to exceed initial estimates.*

SPY Day Trade Plan for 05/01/2025SPY Day Trade Plan for 05/01/2025
📈 562.70 565.60
📉 557 554.30
Thanks to all my followers! Truly appreciate the support!
Please like and share for more ES/NQ levels Tues & Thurs 🤓📈📉🎯💰
*These levels are derived from comprehensive backtesting and research and a quantitative system demonstrating high accuracy. This statistical foundation suggests that price movements are likely to exceed initial estimates.*

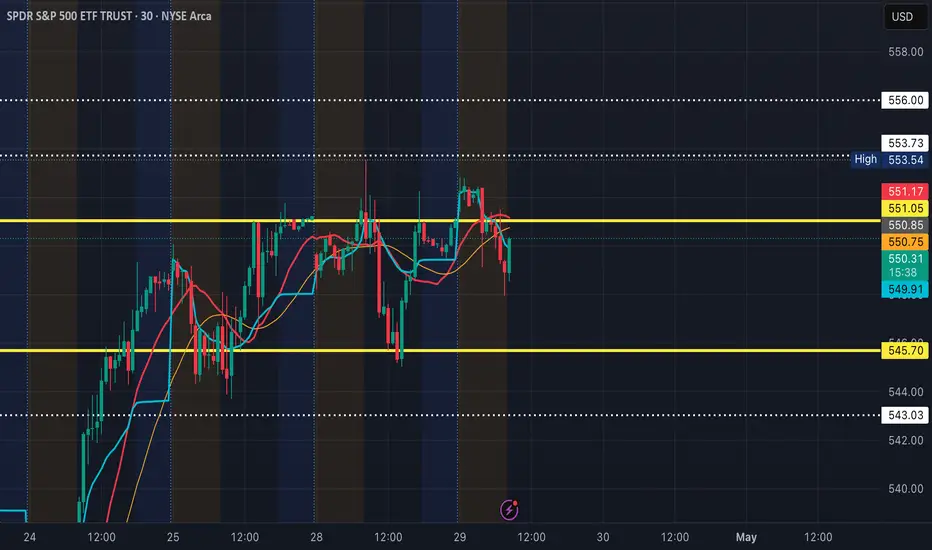
SPY Day Trade Plan for 04/29/2025SPY Day Trade Plan for 04/29/2025
📈 550 553 556
📉 544 543 540.50
Thanks to all my followers! Truly appreciate the support!
Please like and share for more ES/NQ levels Tues & Thurs 🤓📈📉🎯💰
*These levels are derived from comprehensive backtesting and research and a quantitative system demonstrating high accuracy. This statistical foundation suggests that price movements are likely to exceed initial estimates.*
MNQ1!/NQ1! Day Trade Plan for 05/01/2025MNQ1!/NQ1! Day Trade Plan for 05/01/2025
📈 20130 20219
📉 19770 19700
Thanks to all my followers! Truly appreciate the support!
Please like and share for more ES/NQ levels Tues & Thurs 🤓📈📉🎯💰
*These levels are derived from comprehensive backtesting and research and a quantitative system demonstrating high accuracy. This statistical foundation suggests that price movements are likely to exceed initial estimates.*

MNQ1!/NQ1! Day Trade Plan for 04/29/2025MNQ1!/NQ1! Day Trade Plan for 04/29/2025
📈 19560 19685
📉 19185 19060
Thanks to all my followers! Truly appreciate the support!
Please like and share for more ES/NQ levels Tues & Thurs 🤓📈📉🎯💰
*These levels are derived from comprehensive backtesting and research and a quantitative system demonstrating high accuracy. This statistical foundation suggests that price movements are likely to exceed initial estimates.*

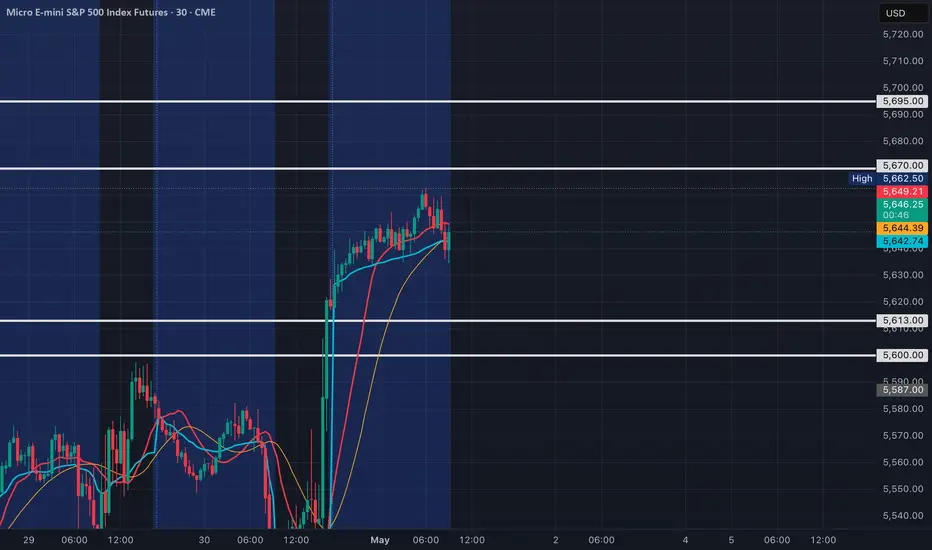
MES1!/ES1! Day Trade Plan for 05/01/2025MES1!/ES1! Day Trade Plan for 05/01/2025
📈 5670 5695
📉 5613 5600
Thanks to all my followers! Truly appreciate the support!
Please like and share for more ES/NQ levels Tues & Thurs 🤓📈📉🎯💰
*These levels are derived from comprehensive backtesting and research and a quantitative system demonstrating high accuracy. This statistical foundation suggests that price movements are likely to exceed initial estimates.*
MES!/ES1! Day Trade Plan for 04/29/2025MES!/ES1! Day Trade Plan for 04/29/2025
📈 5555 5580
📉 5500 5475
Thanks to all my followers! Truly appreciate the support!
Please like and share for more ES/NQ levels Tues & Thurs 🤓📈📉🎯💰
*These levels are derived from comprehensive backtesting and research and a quantitative system demonstrating high accuracy. This statistical foundation suggests that price movements are likely to exceed initial estimates.*

Trade Idea: Long (MARKET)Technical Confluence:
Daily Chart:
• Strong bullish engulfing recovery from recent support (~37,700).
• MACD starting to curl back up from deeply negative levels — possible trend reversal.
• RSI recovering above 50 (currently 52.49), suggesting bullish strength resuming.
15-Min Chart:
• Sustained uptrend with pullbacks respecting the moving average.
• MACD crossing positive territory.
• RSI at 64.77 with room to move higher before hitting overbought levels.
3-Min Chart:
• Tight consolidation after a sharp breakout to 40,766 — forming a potential bull flag.
• RSI at 58.89 — mid-level with upward momentum potential.
• MACD histogram shrinking — possible continuation breakout imminent.
⸻
Fundamental Context:
• Market Sentiment: U.S. markets are generally supported due to strong earnings reports and decreasing recession fears. Treasury yields have stabilized, and risk appetite is returning.
• Upcoming Events: FOMC rate decision is key — bullish bias if they hold or soften tone.
⸻
Trade Details:
• Entry: 40,770
• Price is consolidating just under this resistance. Enter on breakout with volume confirmation.
• Stop Loss (SL): 40,350
• Below recent support on the 15M chart and under the moving average. Conservative SL with volatility in mind.
• Take Profit (TP): 41,450
• Measured move from the flag pattern and aligns with Fibonacci extension and historical resistance.
FUSIONMARKETS:US30

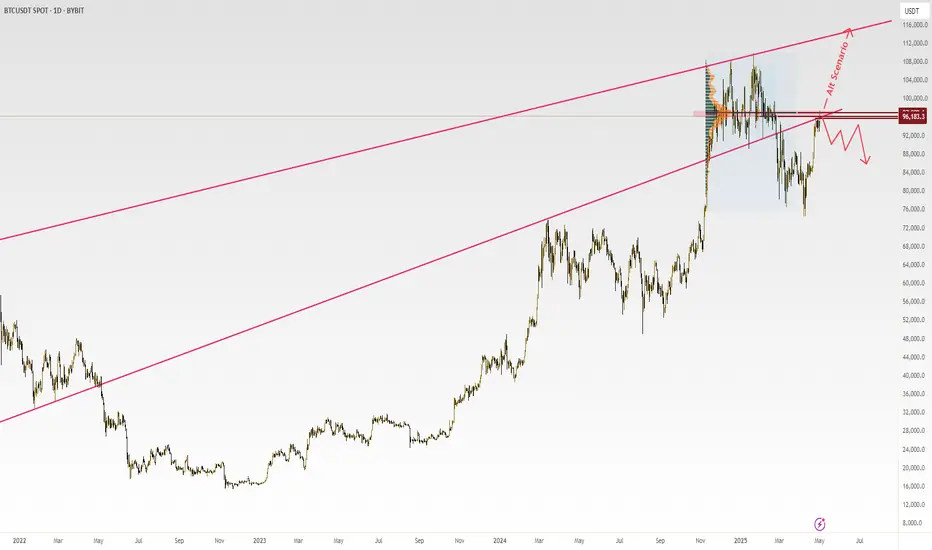
Bitcoin is at a critical decision pointBitcoin:
Currently, Bitcoin is at a key resistance zone around the $97,500 level, which holds significant technical importance as it has acted as a price barrier multiple times in the past. In a bullish scenario, if Bitcoin manages to decisively break through this resistance and stabilize above this level, a strong upward movement could begin. With increased trading volume and buyer support, the price could target the next level at around $115,000. This scenario is particularly likely if positive fundamental factors, such as favorable news regarding Bitcoin adoption or improving macroeconomic conditions, support this move.
However, in a bearish scenario, if Bitcoin fails to overcome the $97,500 resistance and faces selling pressure, a price correction becomes more probable. In this case, the first significant support level is around $92,000, which could serve as an initial correction target. If selling pressure persists and this level is breached, the next support lies at approximately $89,500, which may act as a temporary price floor. Given the current market conditions and recent volatility, my personal view leans more toward a potential price decline, as technical factors and market uncertainty may strengthen sellers.
Risk Warning: Investing and trading in the cryptocurrency market involves high risk. Prices can be highly volatile, leading to significant profits or losses. Please conduct thorough research and seek professional financial advice before making any trading decisions. This analysis is solely a personal opinion and should not be considered financial advice. You are solely responsible for any trading decisions you make.
Good luck
Pooya Salehipour
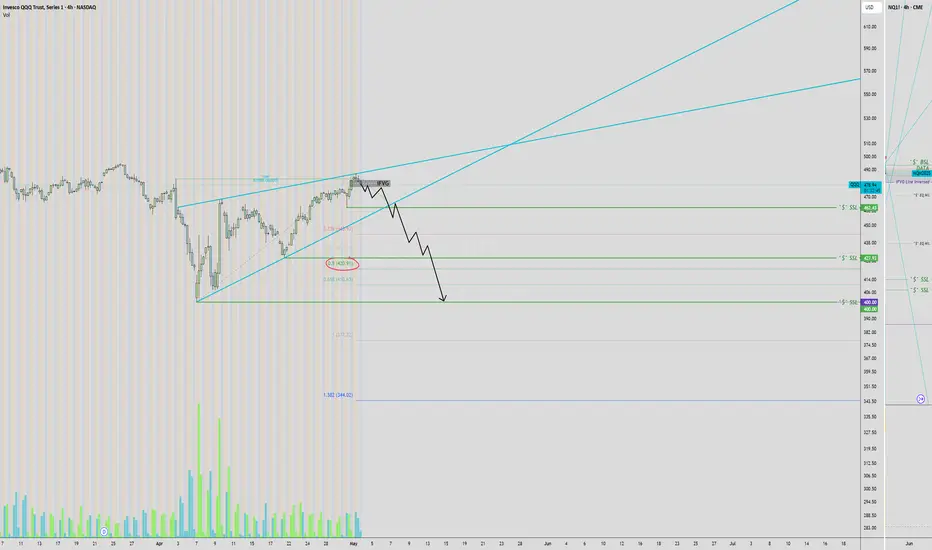
QQQ PUTSI’m short NASDAQ:QQQ 👇 based on NQ, obv...
Anticipating a 2022-style ICT iFVG bearish model. Front-running the setup w/ GDP shrinkage narrative (real or not, price moves on perception).
Targeting $420 → sub-$400, making macro lower lows. I have targets.
Sounds nuts? Maybe. But when we get there… I’m very long. 📉📈
USDCAD BUY900m @ 1.37 (Support) - 900m @ 1.389 (Break) - Targets @ 1.40 (TP) - Waiting for a Range Breakout

EURJPY SELLTargets @ 160 - W 618 Fib @ 166.3 - LVN @ 154 which can be seen as Target - Waiting for Volume but already scaled in!

Has sellers set the tone?Although there was a positive close in the S&P 500 daily chart, sellers appeared at new highs. The broader structure is a neutral zone. This implies the possibility of a down day on Friday but not a large move lower. It will be very interesting to see how this market absorbs the Friday economic reports.


Bitcoin Vs Microsoft 🚨MartyBoots here , I have been trading for 17 years and sharing my thoughts on COINBASE:BTCUSD .
🚨
.
NASDAQ:MSFT vs COINBASE:BTCUSD
Do not miss out on COINBASE:BTCUSD as this is a great opportunity. You are still early
Watch video for more details
