Ethereum (ETH) Breaks Descending Trendline – Eyeing $4,000?Ethereum (ETH) Breaks Descending Trendline – Eyeing $4,000?
Description:
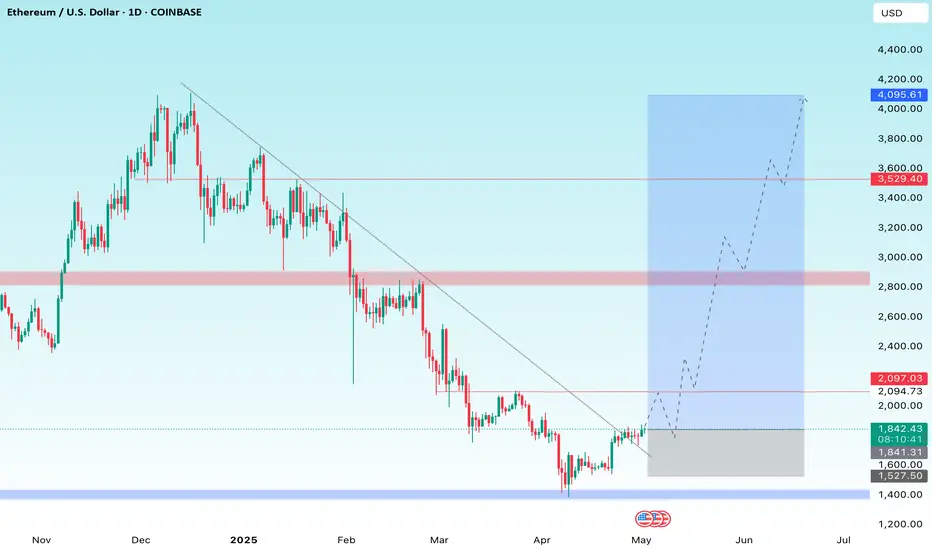
Ethereum has officially broken out of a long-term descending trendline on the daily timeframe, signaling a potential trend reversal. After holding support near the $1,500–$1,600 zone, ETH has started forming higher lows and is now aiming for key resistance zones. A bullish scenario could see price rally toward $2,800, with a possible extension toward the $3,500–$4,000 zone if momentum continues.
The breakout is supported by strong price structure and rejection from major demand zones, making this a chart worth watching closely. Will the bulls take control and drive ETH back to 2024 highs?
Technical Levels to Watch:
• Support: $1,840 / $1,600
• Resistance: $2,100 / $2,800 / $3,530 / $4,095
Follow for more updates as this setup develops. Let’s see how Ethereum reacts to this breakout!
Stay tuned for live updates & detailed trade setups. Drop your thoughts below and don’t forget to follow for more high-probability analyses!
Fundamental Analysis
Good PalantirianNoticed recently there is very few NASDAQ:PLTR stock for sale on the market. As a good and kind trader I decide to borrow ad sell couple of NASDAQ:PLTR like a good move to provide liquidity to the market and help other traders to obtain so passionately desired Palantir stock.
Dear Palatirians pls don't get me wrong. I'm not betraying our faith, just need to step back for a while

Non-farm data is released, and gold is still going to fall.
📌 Gold information
Today, the market will usher in the heavy non-farm data for April. From the expected value, there are only 130,000 people, far lower than the expected 228,000 people, and the unemployment rate remains at 4.2%.
If we refer to the unsatisfactory ADP data in April, then the number of non-farm people in April should have declined, or it is lower than expected, but the ADP data cannot fully correspond to the final non-farm data. This is the answer given to us by too many experiences in the past, so it cannot be concluded that the non-farm data this time will be lower than expected.
📊Comment analysis
Combined with the technical aspect, the strong technical pressure above the international gold price is around 3280, and then the 3300 mark. Even if it rebounds next, the pressure of the above two prices cannot be broken, and there is still a probability of a pullback adjustment. The initial support below is 3230, and after breaking through the position, it will follow the trend to explore 3205.
💰Strategy Package
If today's non-agricultural data cannot provide strong support for gold prices, the rise in gold prices in the short term will be difficult to sustain. The specific decision can only be made after the final release of the afternoon data and the guidance on prices. The trend fluctuations tonight will be very intense. Remember to strictly control your positions to prevent risks.
⭐️ Note: Labaron hopes that traders can properly manage their funds
- Choose the number of lots that matches your funds
- Profit is 4-7% of the fund account
- Stop loss is 1-3% of the fund account

Ethereum Bulls Poised: $1875 Resistance Key to Next Leg UpETHUSD forms double top around $1875 and showed a minor sell-off. It hits an intraday low of $1816 and is currently trading around $1834.
Overall trend remains bullish as long as support of $1500 remains intact. The key near-term resistance is at $1875 (trend line joining $4109 and $3746) any breach above targets $2000/$2300/ $2500/$2770/$3000/$3400/$3600/$3800/$4000. A robust bullish trend will only materialize above $4100.
Immediate support is around $1675. Any violation below will drag the price down to $1620/$1500/$1200/$1000. A breach below $1000 could see Ethereum plummet to $800/$500.
It is good to buy above $1875 with SL around $1500 for a TP of $2770/$3000.

Why aren't we growing now?Bitcoin will not be allowed to rise at the moment. First of all, there are two unfilled liquidity zones. Secondly, there is no catalyst for growth — such as positive news. We will definitely move toward the first liquidity zone. The second one might be reached after some time. Even if there is growth now, it will be a false, artificial rise created by whales. This is crypto — welcome.

OPEC at a turning point: what’s next for oil? All eyes are on OPEC ahead of its May 5 meeting as it faces pressure from falling prices, weak demand, and internal rifts.
While some expect a pause in output hikes, the consensus points to continued increases. The group’s decision will be key in shaping oil market dynamics amid trade tensions and fragile global growth.
APRIL PRICE ACTION: TARIFFS, TRUMP, AND TURBULENCE
April witnessed WTI crude oil futures plummeting by 18.6%, marking its sharpest monthly decline since November 2021, as U.S. tariffs and OPEC+ supply hikes dragged prices.
President Trump’s April 2 announcement of 10% baseline tariffs on all imports, with elevated duties targeting China and others, triggered fears of a global trade slowdown. Additionally, China’s retaliatory tariffs on U.S. goods only intensified demand concerns.
OPEC+ exacerbated the selloff by boosting output by 138,000 bpd in April, its first production hike since 2022. The group had initially planned for gradual monthly increases of 135,000 bpd, but the higher-than-expected increase caught the market off guard, intensifying downward pressure on prices.
The cartel followed up with an announcement that it would hike output in May by 411,000 bpd. The accelerated pace of production increases is widely seen as politically motivated, reflecting pressure to align with U.S. interests amid growing geopolitical and economic tensions.
OUTPUT HIKES LOOM AMID POLITICAL TENSIONS AND INTERNAL RIFTS
OPEC+ faces growing pressure to raise output, despite weak demand. Political factors, internal pressure from key members, and a desire to protect market share are driving this shift.
Disagreements within the group are mounting. Kazakhstan, for example, says it can’t cut production and will prioritize domestic needs, continuing to exceed its target. In March, the UAE, Iraq, and Nigeria also pumped above quotas and are pushing for higher limits to support their budgets.
Source: OPEC and IEA
Saudi Arabia appears less willing to support prices with further cuts. Reuters reports the kingdom is prepared to tolerate lower prices to defend market share.
Rising domestic oil use from May to September, due to higher electricity demand, also supports more output.
OPEC+ is also under political pressure to boost output, with analysts suggesting Saudi Arabia and others may fast-track supply hikes at the May 5 meeting to ensure oil doesn’t become a flashpoint ahead of Trump’s upcoming visit to the Gulf.
OIL MARKET STRUGGLES WITH TWIN HEADWINDS: WEAK DEMAND AND RISING OPEC+ SUPPLY
OPEC has cut its 2025 oil demand growth forecast by 10.3% to 1.3 million bpd and trimmed its 2026 outlook by 10.5% to 1.28 million bpd, citing the impact of U.S. tariffs.
Source: OPEC , EIA , and IEA
The EIA and IEA echoed this downgrade, reinforcing expectations of prolonged price pressure amid trade tensions and rising supply.
Source: U.S. Bureau of Economic Analysis
Economic data from major consumers deepens the bearish tone. The U.S. economy contracted 0.3% in Q1 2025, its first decline since 2022, as firms rushed imports ahead of tariffs, disrupting trade flows. China’s April manufacturing PMI dropped to 49, marking its lowest since 2023 despite stimulus measures.
The trade tensions between the U.S. and China disrupt supply chains and increase costs, while slower economic growth in key regions curtails fuel consumption.
With global growth cooling and OPEC+ accelerating output, the oil market now faces a dual challenge: softening demand and swelling supply. The result is a volatile outlook skewed toward persistent oversupply.
HYPOTHETICAL TRADE SETUP
With OPEC+ likely to uphold or accelerate output hikes at the May 5 meeting due to the reasons stated above, WTI remains vulnerable.
Notably, WTI’s implied volatility remains near its YTD highs, and the skew stays deep in negative territory at 5.6, signalling stronger demand for downside protection over upside exposure.
Source: CME CVOL
The 21-day MA remains above the 9-day MA, indicating sustained bearish pressure, while the MACD continues to trend lower despite the May 1 price rebound.
RSI hovers in neutral territory but below the midpoint, signalling weakening bullish conviction.
All these indicators point to fading bullish momentum and sustained downside pressure.
Overall, bearish technicals, persistent oversupply risk, and soft economic data from the U.S., China, and Europe support a short-term bearish view.
Source: CME QuikStrike
With OPEC’s meeting set for 05 May, investors may explore the 05/May ML1K5 Monday weekly options.
This paper posits a Bearish Put Spread using weekly WTI options expiring on 05/May, offering defined risk and reward in a directional play with a 1.1x reward-to-risk ratio.
The long put at USD 61/barrel, and the short put at USD 57/barrel; this sets a breakeven at USD 59.09/barrel. The trade costs a net premium of USD 1.91/barrel (USD 1,910/contract)
The position yields a maximum profit of USD 2.09/barrel (USD 2,090/contract) if WTI settles below USD 57/barrel, and a maximum loss of USD 1.91/barrel (USD 1,910/contract) if it closes above USD 61/barrel.
The chart above was created using CME Group’s QuikStrike Strategy Simulator , which allows for precise modeling and clear visualization of trading strategies under different market conditions.
MARKET DATA
CME Real-time Market Data helps identify trading set-ups and express market views better. If you have futures in your trading portfolio, you can check out on CME Group data plans available that suit your trading needs tradingview.com/cme.
DISCLAIMER
This case study is for educational purposes only and does not constitute investment recommendations or advice. Nor are they used to promote any specific products, or services.
Trading or investment ideas cited here are for illustration only, as an integral part of a case study to demonstrate the fundamental concepts in risk management or trading under the market scenarios being discussed. Please read the FULL DISCLAIMER the link to which is provided in our profile description.

Azul Brazilian Airlines S.A Stock completed wave 1 and now completed wave 2 , going in 3rd Motive powerful wave 👋
Target prices on Chart
Hold it and Buy more .

Is Disney’s Chart Forming a Bullish Pattern Ahead of Earnings? Walt Disney Co. NYSE:DIS is set to report fiscal Q2 results next Wednesday (May 7) at a time when the entertainment giant’s shares have shed more than 20% since February and some 55% from their 2021 peak. What does the company’s technical and fundamental analysis tell us?
Let’s see:
Disney’s Fundamental Analysis
Looking for earnings growth? Investors might not find much here.
The Street is currently looking for DIS to report $1.21 in adjusted earnings per share and $1.05 of GAAP EPS on roughly $23.15 billion of revenues for the quarter, which ran through late March.
That would compare to an identical $1.21 in adjusted EPS in the year-ago period on $22.1 billion of revenues (representing sales growth of less than 5% year over year).
Meanwhile, investors will want to see if a recent slide in Disney+ subscribers has continued, or even expanded. Management reported in February reported that Disney+’s customer base sank by roughly 700,000 in fiscal Q1 to 125 million users.
On the bright side, the company also said that combined Disney+ and Hulu subscriptions increased by 900,000 to 178 million during the same period.
Direct-to-consumer advertising (excluding India’s Hotstar streaming service) also rose 16% year over year fiscal Q1. But when including Hotstar, advertising contracted by 2%. So, this is a metric that investors will closely watch as well.
Of course, with forward-looking economic activity in some doubt both domestically and globally, Disney’s “Experiences” segment (theme parks, cruises, etc.) will be key to the firm's ability to traverse the future environment.
This segment has been an absolute driver of corporate performance for several years now, but last quarter, Disney’s domestic parks and experiences finally showed some slowing down.
The unit’s operating income contracted 5% year over year overall, although non-U.S. parks and experiences did better, growing 28%. y/y. However, the non-U.S. segment is a smaller business.
Will families be willing to splurge on a Disney vacation or cruise in a tougher economic climate? Disney could soon find out.
Elsewhere, the company’s Entertainment division will also be in focus when Disney reports its latest results.
Disney’s linear cable-TV networks continue to lose market share, while the recent live-action-movie version of "Snow White" was an absolute embarrassment in terms of dreadful financial performance. Forward guidance for this segment will be crucial.
Disney’s Technical Analysis
Now let’s look at Disney’s chart going back to last fall:
Readers will first see the well-developed “double-top” pattern of bearish reversal that spanned from November through early March, as denoted by the “Top 1” and “Top 2” boxes above. This pattern led to a sell-off for Disney that bottomed out in early April.
Now, I might be getting ahead of myself, but I think I also see a partly developed “inverse-head-and-shoulders” pattern under construction at the moment.
Readers will see what looks like a “left shoulder” and “head” pattern in the chart above denoted by purple curving lines at right.
Now Disney was struggling to retake and hold its 21-day Exponential Moving Average (or “EMA,” denoted by the green line above) as I wrote this. A hold above the line could bring some swing traders over to the long side.
And if DIS does hold its 21-day EMA, the stock would next aim technically to make a run at its 50-day Simple Moving Average (or “SMA,” denoted by the blue line at $97.30 in the chart above).
After that, reaching the 200-day SMA (the red line above) would complete an inverse-head-and-shoulders pattern and serve as a bullish sign.
This would put the pattern’s “pivot” or “neckline” almost precisely where Disney’s 200-day SMA currently sits, adding more gravity to the seriousness of retaking or failing at that level.
Meanwhile, Disney’s Relative Strength Index (the gray line at the chart’s top) is currently neutral and literally hints at nothing right now.
That said, the stock's daily Moving Average Convergence Divergence indication (or “MACD,” marked with gold and black lines and blue bars at the chart’s bottom) is improving.
The histogram of Disney’s 9-day EMA (marked with blue bars) moved above zero on April 2 and has remained positive ever since. That’s usually a good sign, but not yet bullish on its own.
Bullish investors would also want to see the 12-day EMA (the black line at the chart’s bottom) move above the 26-day EMA (the gold line), with both above zero.
The 12-day EMA is , in fact, above the 26-day EMA in the chart above. However, both lines must be above zero (as must be the 9-day EMA) to represent a truly bullish signal in historical terms.
Right now, the 12- and 26-day indicators are both below zero, but are moving in a northerly direction.
Am I saying that this is a bullish chart? Not necessarily; we might still be early.
But this chart seems to have great potential. A bullish set-up looks close to being in place. The rest might be up to Disney’s earnings release and guidance next week.
(Moomoo Technologies Inc. Markets Commentator Stephen “Sarge” Guilfoyle had no position in DIS at the time of writing this column.)
This article discusses technical analysis, other approaches, including fundamental analysis, may offer very different views. The examples provided are for illustrative purposes only and are not intended to be reflective of the results you can expect to achieve. Specific security charts used are for illustrative purposes only and are not a recommendation, offer to sell, or a solicitation of an offer to buy any security. Past investment performance does not indicate or guarantee future success. Returns will vary, and all investments carry risks, including loss of principal. This content is also not a research report and is not intended to serve as the basis for any investment decision. The information contained in this article does not purport to be a complete description of the securities, markets, or developments referred to in this material. Moomoo and its affiliates make no representation or warranty as to the article's adequacy, completeness, accuracy or timeliness for any particular purpose of the above content. Furthermore, there is no guarantee that any statements, estimates, price targets, opinions or forecasts provided herein will prove to be correct.
Moomoo is a financial information and trading app offered by Moomoo Technologies Inc. In the U.S., investment products and services on Moomoo are offered by Moomoo Financial Inc., Member FINRA/SIPC.
TradingView is an independent third party not affiliated with Moomoo Financial Inc., Moomoo Technologies Inc., or its affiliates. Moomoo Financial Inc. and its affiliates do not endorse, represent or warrant the completeness and accuracy of the data and information available on the TradingView platform and are not responsible for any services provided by the third-party platform.

[SHORT] BTCUSDT - Binance | Will BTC Correction Happen Now?Welcome,
- Status: 📉 Short
- BTC wait break the green line first
- TP & SL On chart
Keep wait..
Lets see..

Equity Research Report – NEWGEN SOFTWARE TECHNOLOGIES Short-Term View: A strong breakout above key resistance at ₹1,100 with volume surge indicates bullish momentum. Price reclaimed the 50 EMA after consolidation. RSI at 60.87 supports strength; next resistance lies near ₹1,193.90.
Long-Term View: Structurally strong after correction. Sustaining above ₹1,020 (50 EMA) may attract fresh buying. Long-term targets can stretch to ₹1,300+ if earnings and demand trends remain favorable.
Conclusion: Bullish momentum likely to continue both short and long term. Watch for volume confirmation and hold above ₹1,100.
For Education Purpose only

Euro breaks slide as eurozone core CPI climbs, US nonfarm payrolThe euro has posted gains on Friday. In the European session, EUR/USD is trading at 1.1325, up 0.37% on the day. Today's gains follow a three-day slide. US nonfarm payrolls came in at 177 thousand, much stronger than the market estimate of 130 thousand.
Eurozone inflation for April was a surprise on the upside. Headline CPI remained steady at 2.2% y/y, edging above the market estimate of 2.1%. Lower energy prices were offset by a rise in service inflation and food prices. Monthly, CPI was also unchanged at 0.6%, above the forecast of 0.4%.
Core CPI, which excludes food and energy and is a better gauge of inflation trends, jumped to 2.7% y/y, up from 2.4% in March and above the market estimate of 2.5%. This was the first acceleration in the core rate since May 2024. Services inflation, a key component in Core CPI remains hot and jumped to 3.9% from 3.5% in March.
The rise in core CPI is a worrisome sign for the European Central Bank and could complicate plans to gradually lower interest rates. The ECB has been aggressive, cutting rates by 175 basis points in the current easing cycle. Still, more cuts are needed to boost the ailing eurozone economy.
US nonfarm payrolls came in at 177 thousand in April, slightly below the downwardly revised gain of 185 thousand in March. This easily beat the market estimate of 130 thousand and is a sign that the US labor market remains in decent shape. Wage growth was unchanged at 3.8% y/y, just below the market estimate of 3.9%. Monthly, wage growth dropped to 0.2% from 0.3%, shy of the market estimate of 0.3%.

Non-agricultural prospective data analysis Operation suggestions📌Fundamentals:
📊Technical aspects:
Technically, spot gold is in a downward trend in the short term, and there is a certain rebound or shock at the key support level. At the 4-hour level, the gold price is running above the lower track of the Bollinger Band, and the opening shows signs of contraction. The MACD indicator dead cross is gradually closing, and the RSI indicator is running in the 35-45 range, showing that the long and short forces are relatively balanced.
🎯Practical strategy:
3260-3270 light position short, target 3225-3200. When it reaches 3225-3200 and stabilizes, try to go long, target 3250-3270.

Could the gap remain unfilled?If BTC doesn't fill the CME gap at around 92K, it will be the first unfilled CME gap since October 2020.

[SHORT] BTCUSDT - Binance | Will BTC Correction Happen Now?Welcome,
- Status: 📉 Short
- BTC wait 15m Close bellow the Orange Line then Entry
- TP & SL On chart
Keep wait..
Lets see..

Can USD/JPY hold THIS key support after a mixed NFP report? The US dollar traded mixed shortly after the NFP was released, as risk-on sentiment remained the prevailing trend. As index futures rose further, commodity dollars extended their gains against the greenback, while the USD/JPY attempted to find support around the key 144.00 - 144.50 area. This zone was resistance in the past so let's see if the UJ will be able to rebound from here later in the session, and in early next week.
NFP comes in stronger, but...
The nonfarm payrolls data “beat” forecasts, with a headline print of 177K vs. 138K eyed. But data for March was revised lower to 185K rom 228K. Revisions to prior two months have taken out 58K from initial estimates. Taken together, this is hardly a beat. But the good news was that full-time employment rose sharply. The unemployment rate, meanwhile, was unchanged at 4.2%.
On the inflation side of things, average earnings came in slightly lower than expected, rising 0.2% on a month-over-month basis, compared with 0.3% expected. Nothing to get too excited over, but potentially good news as far as inflation is concerned – especially after we saw a slightly weaker Core PCE Price Index in mid-week.
NFP was never going to matter much
The market’s focus is on trade war and trade negotiations. We were never going to see any wild market reactions, and so it has so far proved. The US dollar initially spiked then quickly returned to pre-NFP levels. Gold fell, and index futures added onto earlier gains.
Up next: ISM Services PMI on Monday and FOMC on Thursday.
By Fawad Razaqzada, market analyst with FOREX.com

HolderStat | What Tokens does a Successful Trader BuyThe trader owns ~$48.9K 💵
23 hours ago, he exchanged $10K USDC for ~$69K MEXC:DSYNCUSDT , increasing his position to ~138K tokens.
Top Holdings:
● $30K USDC as a reserve for purchases.
● ~138K MEXC:DSYNCUSDT with an average price of $0.14
Smart rotation at this stage of growth! 🔥

Easing market risks put pressure on GOLDOANDA:XAUUSD fell to a two-week low on Thursday (May 1), mainly due to signs of easing trade tensions and a long holiday in China, the world's largest gold consumer. Investors will be looking ahead to the US non-farm payrolls report due today (Friday), which is expected to cause major market movements.
Easing trade tensions between the US and other countries have kept investors optimistic throughout the week. In addition, easing US-China trade tensions have also added to the pressure on gold as there are no additional risks to stimulate safe-haven demand.
US President Donald Trump has decided to exempt some tariffs on the auto industry and made progress on deals with India, South Korea and Japan. On Wednesday local time, Trump said there was a great chance of reaching a trade deal with China and that there were "potential" trade deals with India, South Korea and Japan, and that he was working to reach agreements with the three countries.
The Trump administration hopes to reach preliminary trade agreements with several trading partners within weeks, U.S. Trade Representative Greer said Wednesday. U.S. Commerce Secretary Mattis Lutnick said at least one trade deal is close to being announced, several others are close to being finalized, and Trump may be waiting for an opportunity to announce them all at once.
Data released on Wednesday showed the US economy contracted in the first quarter and the personal consumption expenditures (PCE) price index was flat in March, turning investors' attention to the non-farm payrolls report due out today (Friday). The US non-farm payrolls report for April will be released on May 2 (8:30 a.m. ET). Expectations for the non-farm report are that traders and economists expect the report to show 133,000 new jobs in the US, average hourly earnings increased 0.3% month-on-month (up 3.9% year-on-year), and the U3 unemployment rate remained unchanged at 4.2%.
Fed policymakers said they would keep interest rates on hold until there are clear signs that inflation is falling toward the 2% target or there is a possibility that the job market is deteriorating.
Technical Outlook Analysis OANDA:XAUUSD
Technically, gold remains in the best position for bullish expectations with support from the EMA21 and the 0.50% Fibonacci retracement. Meanwhile, the Relative Strength Index (RSI) is also reacting to the 50 level, which is considered the closest support in terms of momentum.
In the short term, if gold returns to trade above $3,270, it will be considered the best condition for a bullish recovery to end the broad-based correction.
However, if gold is sold below $3,228 and maintains its price action below this level, it will likely continue to decline with a subsequent target of around $3,163 in the short term.
In the day, considering the current position, gold still has conditions for a bullish outlook technically and the notable price levels will be listed as follows.
Support: $3,228 – $3,163
Resistance: $3,267 – $3,270
SELL XAUUSD PRICE 3270 - 3268⚡️
↠↠ Stop Loss 3275
→Take Profit 1 3262
↨
→Take Profit 2 3256
BUY XAUUSD PRICE 3174 - 3176⚡️
↠↠ Stop Loss 3170
→Take Profit 1 3182
↨
→Take Profit 2 3188

GOLD POSSIBLE BUY We'll take partial profit because of incoming volatile news, April's jobs report is expected to show a hiring slowdown amid tariff-related uncertainty, with 135,000 new jobs projected and unemployment steady at 4.2%, as economic data signals early signs of cooling.

Altcoin Breakout or Breakdown? Key Levels Ahead🤔📉📈 Altcoin Breakout or Breakdown? Key Levels Ahead 🚨🧠
Hey Traders! Let’s talk about what’s really going on in the altcoin scene 👀
We’re still in a heavy Bitcoin-dominated market (BTC.D at 64%), but TOTAL3—the market cap for altcoins excluding BTC and ETH—is setting up for something big.
📊 We’re currently trading in a tight range between $740B support and $779B resistance—both key Fibonacci levels. Sound familiar? That’s because we were in the exact same range back on Nov 24, right before a major move! 🌀
➡️ A confirmed breakout above $780B could send TOTAL3 surging toward the next major resistance at $929B.
⬅️ But if $740B breaks, we’re eyeing a move down to $641B, where crucial trendline support comes into play.
Zooming out, altcoins are still licking their wounds from the trillion-dollar highs. The space has been wild: Trump tokens, meme coin madness, the OM token collapse—volatility is the name of the game. But are you still bullish on real, utility-driven projects?
💬 Let’s discuss:
Are you riding this altcoin wave, or sitting on the sidelines until the storm passes?
Do you have faith in 'Crypto' and can the good projects make history, or will the market suffer indefinitely from Presidents launching meme tokens, Fartcoins and Pumpfuns dominating a space with no ethics or loyalty?
🔗 Check the chart and share your thoughts below.
One Love,
The FXPROFESSOR 💙

Solana vs Ethereum – A Meme War or Market Shift?🔥⚔️ Solana vs Ethereum – A Meme War or Market Shift? 🧠📉
It’s getting spicy out here in the crypto arena... and the memes are hitting just as hard as the market caps! 💥
Over the weekend, Solana briefly flipped Ethereum in total staking value — triggering a fiery debate on whether that’s bullish or bearish for SOL. Some celebrated the milestone 🥂, while others, especially from the ETH camp, argued it reveals a deeper problem: Solana’s staking isn't really staking (as slashing isn’t automatic, and network restarts are still a thing). 🛑🔧
📸 Bonus Meme: Apparently Ethereum’s new logo is now Internet Explorer 😂 — can’t say the UX didn’t earn it.
🧠 The FXProfessor’s Technical Take: Let’s cut through the noise.
📉 SOLETH (Solana vs Ethereum Ratio)
Rejected at grand resistance: 0.088
Projected drop: -28% to 0.063
Structure: Bearish inside an ascending channel (highlighted in orange)
📊 ETHUSD
Support: $1,530
Rebound potential: $1,650 and beyond
Long-term structure still forming — this could be a spring.
📈 SOLUSD
Key support: $114
If that breaks higher, next test is $179, then $215
But failure at this level opens room for downside re-test near $80
💬 So where do we stand? On chart structure alone, Solana might still outperform ETH short-term — but technically, SOLETH suggests a correction is due.
🧑🏫 Yes, I’m emotionally attached to Ethereum — I have build on it, invested in it, got smashed on it for months..pain, at least for now. But I trade what I see (or at least i try damn it!)
Let the memes roll, but let the charts speak. Drop your thoughts — SOL or ETH? 👇
One Love,
The FXPROFESSOR 💙

Gold potential sell setup Current market analysis reveals a potential sell zone in Gold. Key factors:
- Resistance sel llevel:(3267)
-
- Overbought conditions on the RSI
-
- Bearish divergence on the MACD
- Sell zone:------(3268)
-
- Take profit 1:( 3259 )
-
- Take profit 2: (3246)
-
- Stop loss: $ ( 3275 )
Monitor price action and adjust strategies accordingly. Trade with caution.
Good luck for this
Share your thoughts about this trading ideas 💡

USDTRY Cooling After Spike – Where to Next? The Turkish Lira story continues—this time through the lens of USDTRY , which has been rising relentlessly and just recently showed signs of exhaustion after tagging highs near 38.95 .
🧭 As seen on the chart, after months of controlled climbing within a broad ascending channel, the pair is now pausing. We may finally be witnessing the beginning of a retracement. Key downside targets have now emerged:
• 33.77 – First area of interest
• 27.99 – Mid-level retracement
• 22.65 – Deep support within the channel
These aren't random numbers—they align beautifully with the multi-year channel and prior volatility zones.
📌 Let's not forget, this journey began with a “New Volatility Alert” back in late 2021, and ever since, the USDTRY has mostly respected structural moves. With the Euro pair also showing signs of topping , this could be the dollar’s turn to cool off against the Lira.
📰 Contextual Fuel:
• Turkey’s central bank raised rates to 46% in April—one of the most aggressive tightening moves globally.
• Over $25B in FX reserves have been used to stabilize the Lira, as inflation forecasts surge past 29.75% for year-end 2025.
• Political volatility and macro risks remain, but short-term speculative flows could now reverse.
🚨 Takeaway:
Just like EURTRY, the USDTRY may have finally found its ceiling for now. Traders should monitor price action near 38–39 for possible bearish continuation signs.
There’s a decent chance that the Lira gains ground in the short to medium term—technical and macro forces now point to consolidation or reversal.
One Love,
The FXPROFESSOR 💙
EURTRY Chart:

HolderStat | Insane Profits in 9 Deals🚀 Wallet turned $5.9K into 25.78 ETH CRYPTOCAP:ETH (~$47.4k) with just 9 trades, netting a massive 2567% profit in 58 months! With avg buy at $705 & avg sell at $4,647, it’s proof that smart timing and patience pay off big in crypto! 🔥
