$ELAB Long 250xNASDAQ:ELAB is very undervalued stock with PS ratio of 0.015 and PB ratio of 0.15 It has recently hunted everyone's stoplosses and gained liquidity.
Target: 9.60
Entry: 2.29
SL: 2.07
Fundamental Analysis

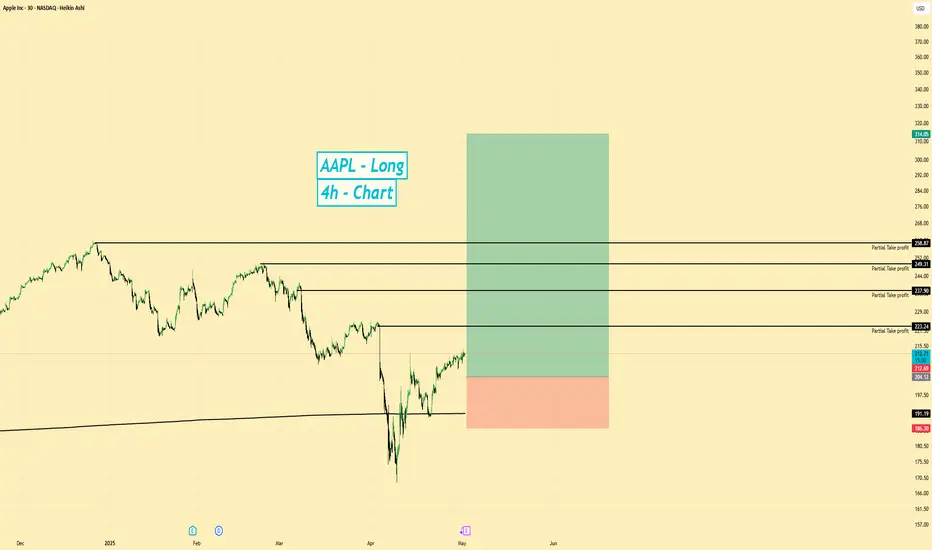
AAPL | Long Setup | Near Resistance | (May 2025)AAPL | Long Setup | Fundamentals but Near Resistance | (May 2025)
1️⃣ Insight Summary
Apple is showing strength, recently gaining over 24% from the lows. While it’s currently facing resistance, it sits on solid support around the volume-weighted average price (VWAP). Earnings are expected today and could drive short-term volatility.
2️⃣ Trade Parameters
Bias: Long
Entry Zone: Around $200
Stop Loss: $186
TP1: $223
TP2: $237
TP3: $249
TP4: $258
Partial Exits: Planning to take 80% profit by TP4 and let the rest run if momentum continues.
3️⃣ Key Notes
💰 Apple’s fundamentals remain strong:
• Revenue: ~$400B
• Net Income: ~$93B
• Free Cash Flow: ~$108B
• Debt: ~$120B
• Assets (tangible): ~$27B
📊 Based on tangible book value, AAPL appears overvalued, but it still holds up well fundamentally.
📉 Beta is 0.7 (slightly less volatile than the market), while the earnings push shows around 1.6 expected growth.
⚠️ Given the valuation and current resistance zone, I’ll be taking a more cautious position. Apple is not my top pick but remains in my top 20 watchlist for this cycle.
4️⃣ Follow-up Note
I’ll be monitoring closely around the $200 level and post an update after earnings or if the price action gives a clear signal.
Please LIKE 👍, FOLLOW ✅, SHARE 🙌 and COMMENT ✍ if you enjoy this idea! Also share your ideas and charts in the comments section below! This is the best way to keep it relevant, support us, keep the content here free and allow the idea to reach as many people as possible.
Disclaimer: This is not financial advice. Always conduct your own research. This content may include enhancements made using AI.
META (Facebook) | Long Setup | Strong Earnings | (May 2025)META (Facebook) | Long Setup | Strong Earnings & Growth Outlook | (May 2025)
1️⃣ Insight Summary
META has been in a correction since February, coinciding with macro shifts like Trump’s re-election. However, recent earnings and long-term financial projections point to renewed strength.
2️⃣ Trade Parameters
Bias: Long
Entry Zone: Around $550
Stop Loss: $476
TP1: $625
TP2: $680
TP3: $739
Final Target (Stretch Goal): $905
Partial Exits: TP1 and TP2 will secure gains early, while the rest rides momentum toward higher levels.
3️⃣ Key Notes
📈 META reported strong earnings recently, and forward guidance through 2028 looks bullish—both EPS and revenue are projected to rise.
💡 Financially, it’s solid:
• Revenue: $165B
• Net Income: $62B
• Free Cash Flow: $50B
• Debt: ~$50B
• Beta: 0.32 (less volatile than the market)
✅ Healthy cash flow and growth outlook make META attractive long-term.
📊 Technically, we're at a resistance area, and the setup aligns with broader S&P 500 structure. Waiting for a clean confirmation around $550 will be key.
4️⃣ Follow-up Note
Watching closely for a breakout above resistance or potential retest of the $550 zone for entry. Will update the idea if price structure changes significantly.
Please LIKE 👍, FOLLOW ✅, SHARE 🙌 and COMMENT ✍ if you enjoy this idea! Also share your ideas and charts in the comments section below! This is the best way to keep it relevant, support us, keep the content here free and allow the idea to reach as many people as possible.
Disclaimer: This is not financial advice. Always conduct your own research. This content may include enhancements made using AI.

USOIL CAUTION! BREAK - TEST - GO!This is my new updated chart of Oil.
Trump's "Drill baby Drill" interfering with the free market is the absolute worst thing he could do. His ridiculous tariffs will put us in an economic depression!
Oil prices are driven by demand! As I have mentioned here on TV so many times before! Increasing supply while heading into a recession is the dumbest thing possible! You never want to consume your own oil when you can consume others first! Simultaneously, F your own nation's oil company's profit margins and gov tax revenue!
This is why we shouldn't put toddlers as POTUS!
Anyway!!! This is a break test go! setup!
If you haven't seen it before, here is an example I recently posted with AAPL.
Click Boost, follow, subscribe! Let's get to 5,000 followers so I can help them navigate these crazy markets too. ))

How much money do I have? My real investment portfolioI’ve decided to start sharing my trades in a live-report format. What you see here is my actual portfolio — no fluff. Just the stock and crypto markets.
📊 Key Stats:
• 💰 Total across brokerage accounts: $22,167
• 📈 Profit since I started investing in 2020: $12,803
• ⚖️ Return: Around 60% total, with an average annual return of ~19%
📦 Portfolio Breakdown:
🧠 Top Performer — Nvidia
• Open positions: 6 shares
• Total profit including closed positions: $4,202
⚛️ Bet on Quantum Tech
• Holdings: QBTS and IONQ
• Long-term play with high potential
📈 Index Funds — Not a Priority
• Profit over 5 years: $523
• No open positions currently
🧨 Options — My Favourite Tool
• Total profit: $2,646
• Currently 2 open positions:
• NVDA 21NOV25 110P (sold put)
• AMD 21NOV25 80P (sold put)
If you would like to get nice overview in analytical platform drop a comment

QQQ Don't Get Honey Dicked!These moves are designed to provoke emotions. Don't get fooled! Nothing has changed! Tariffs are not the problem; they are only a symptom of it.
Click BOOST, Follow, Subscribe!
Let me help you navigate these crazy markets.

JET FUEL & RecessionJet fuel has already pulled back significantly, which would normally be good for airlines. Not this time. Jet fuel pulling back with airlines signals a recession is on the horizon.
Keep an eye on this one.
Click boost, follow, and subscribe for more!

GOLD DAILY UPDATE MAY 1ST 2025Chart Is very clear in numbers ,
Expected to continue correcting to the level of 3160 3170, from there must jump to a very high levels, but except real breaking 3160 with confirmation candles on 4 hours timeframe, will take us to more correction down to 3040 max. not really expected but nothing impossible in market.
good luck for all traders.

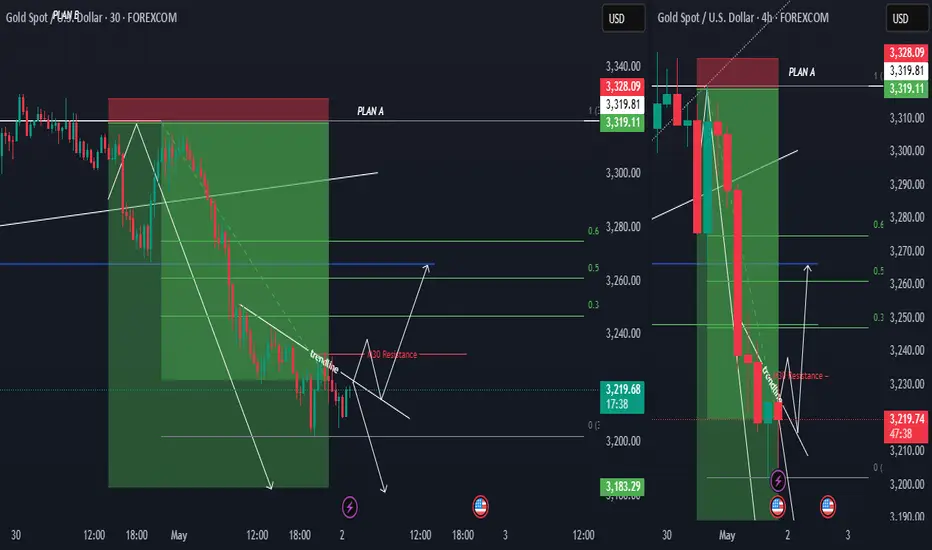
XAUUSD UPDATEHi all
The rejection at the 3202 level, Plan A remains a strong possibility, especially if the trendline also shows signs of resistance. However, if the trendline breaks, then Plan B would be the preferred approach—waiting for a confirmed breakout on the 30-minute timeframe before considering a long position.
Keep a close watch on price action and ensure strong confirmation before making any moves. Feel free to share any updates or additional insights. Wishing you success in trading!
good luck all
**My trading strategy is not intended to be a signal. It's a process of learning about market structure and sharpening my trading my skills also for my trade journal**
Thanks a lot for your support
1500 before AGM Reliance 2025 I feel superbolish on Reliance not since today but since it was at the 1250 level I feel that Reliance will show us 1500 and above levels not sure about the lifetime high but 1500 levels before AGM which is mostly held in July or August

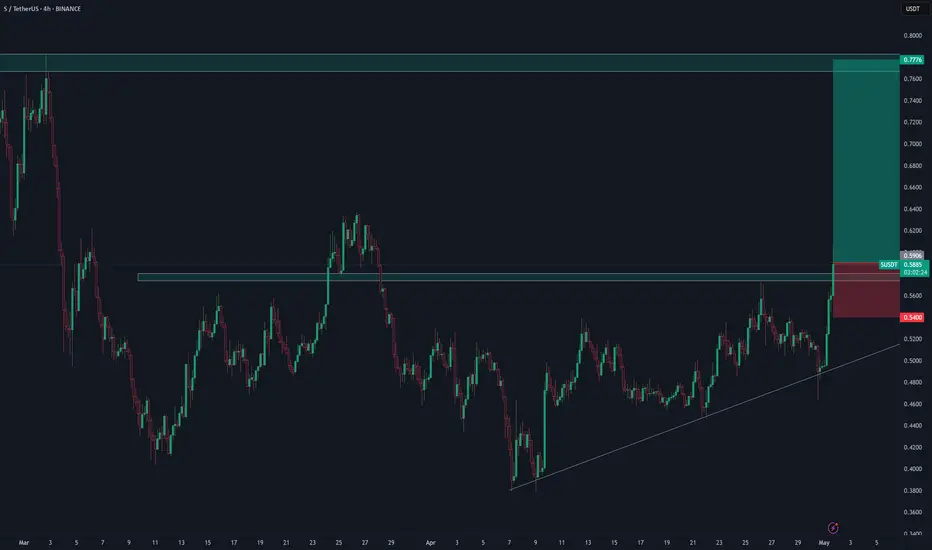
long SonicSonic broke through a major resistance level. Bullish movement is expected to continue and reach $0.77
A perfect masterpiece - my final trade & mic dropHello friends. I have found the perfect trade, and I went all in with my entire account because my conviction is so high that I can say I'm 99.9% sure that I will be correct. I have never been this confident about a trade in my entire career to date.
I have purchased six figures in put contracts on the SPY and SPX because I can see that a crash is about to happen. Here are a few of the factors that I am looking at which have made me so confident.
1) Retail is frantically buying the dip as well as the rip, and they are almost always wrong & lose money. Meanwhile, smart money has been selling this whole time.
2) My wave theory shows a clear WXY pattern that has now been completed. We can't currently be in an impulsive wave to the upside because there is too much overlapping.
3) Trade deal is NOT coming soon. Polymarket predicts only 19% odds for a US-China trade deal to happen before June. The tariff situation does not look good, and it isn't priced in anymore as we have retraced the entire tariff dump already.
4) The market is currently trading far above liquidity based fair value, which has been plummeting in recent weeks indicating that a drop is bound to happen soon for risk prices. To reach the fair price, the SPY should trade about 30% lower than current prices. This gives us enormous room for a cascade to the downside.

V | Waiting for Dip | Extended Price | (May 2025)V | Waiting for Dip | Extended Price | (May 2025)
1️⃣ Insight Summary
Visa has been on a strong long-term uptrend and continues to deliver solid financials. However, current price levels seem a bit stretched, and I'm looking for a better risk-reward entry zone.
2️⃣ Trade Parameters
Bias: Long (on pullback)
Entry Zone (Watchlist): $300 – $275
Stop Loss (if entered): Below $251
TP1: $295 (first bounce zone)
TP2: $322
Final Target: $346
Partial Exits: TP1 for early profits, TP2 and beyond for longer-term hold.
3️⃣ Key Notes
💰 Visa posted strong earnings ($2.80 EPS) and impressive revenue ($35B), with a solid net income margin.
🏦 The company benefits from its tight integration with the banking system and steady cash flow (~ SEED_TVCODER77_ETHBTCDATA:4B ).
📉 Debt is manageable at FWB:20B , and Beta at 0.72 shows less volatility than the market—ideal for steady investors.
⚠️ Despite these positives, price looks extended, and I’d prefer a pullback toward $300 or $275 before considering an entry.
📊 Technically, there are signs of a possible bearish divergence forming—this supports the idea of waiting for a better level.
4️⃣ Follow-up Note
Visa remains on my radar, but no trade until we see a clearer technical pullback or structure reset near my ideal buy zone.
Please LIKE 👍, FOLLOW ✅, SHARE 🙌 and COMMENT ✍ if you enjoy this idea! Also share your ideas and charts in the comments section below! This is the best way to keep it relevant, support us, keep the content here free and allow the idea to reach as many people as possible.
Disclaimer: This is not financial advice. Always conduct your own research. This content may include enhancements made using AI.

ETHUSDT: Progressing Well 01/05/2025 UPDATEThe ETHUSDT price is moving well, currently trading above the 1700$ area. We anticipate a continuous rise, potentially reaching $2400 first and then $3000. Our swing target remains at $4500. The current price behaviour and momentum suggest an extremely bullish outlook.
Good luck and trade safely!
Thank you for your unwavering support! 😊
If you’d like to contribute, here are a few ways you can help us:
- Like our ideas
- Comment on our ideas
- Share our ideas
Team Setupsfx_
❤️🚀

Gold starts a unilateral decline?
📌 Gold information
U.S. stock indexes fell sharply in midday trading due to disappointing U.S. economic data. On Friday, the U.S. Department of Labor will release the crucial monthly employment report. This is likely to be the most important U.S. data point so far this year.
In other news, Dow Jones News Service reported: "Tariffs are beginning to bring pressure, prompting the Eastern giant to increase stimulus to support economic growth.
📊Comment analysis
For international gold, what you need to do now is to follow the market. Don't think about bottom fishing. You can do a short-term rebound during the day. When the market has clearly broken the structure, you should choose to believe in the technical side, rather than speculate on the next support. This will only be endless. At this stage, if you fail to bottom fishing, are you still ready to try again near the integer of 3200? This is not over yet. Even if it falls below 3200, the 3180 horizontal support will be immediately below.
This round of decline is about to completely give up the second rise in the front end, depending on 3180. This is why I just said that 3200 will immediately encounter a new support. The reason why many people choose to go long above 3240 is also because it is the first stage of the high platform of the front-end surge, and it is necessary to defend. Unfortunately, the defense is not successful now. In other words, if you want to go short next, you have to look at the continued decline. What are the characteristics of the continued decline? You certainly can't tolerate it having an excessive rebound, so don't think about any high-altitude trading strategy.
💰Strategy Package
Short position:
Actively participate at 3230 points, and the profit target is around 3200 points
⭐️ Note: Labaron hopes that traders can properly manage their funds
- Choose the number of lots that matches your funds
- Profit is 4-7% of the capital account
- Stop loss is 1-3% of the capital account

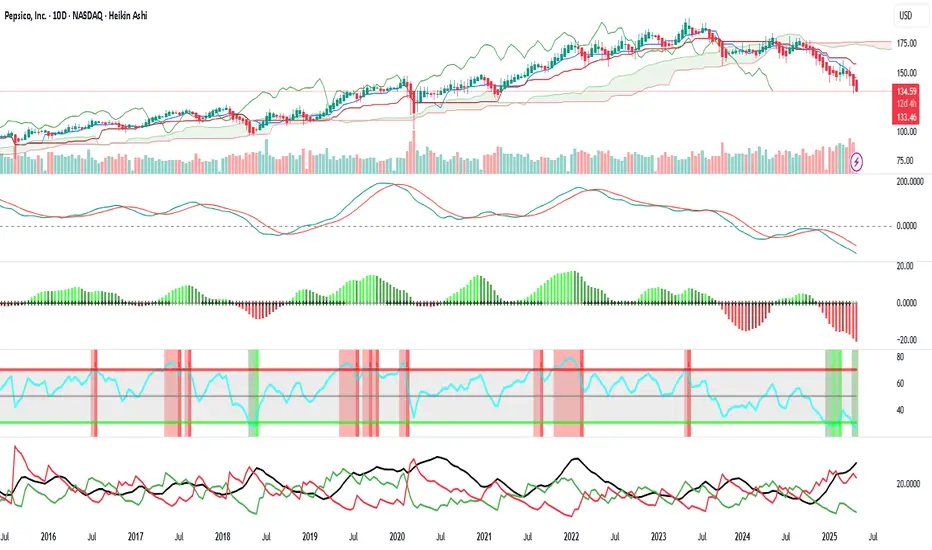
PEP...ready to pull the trigger and go long?These are my favorite indicators...still learning as I'm a LT player not a trader. Any critical comments are welcome.
PEP
Yield : 4.26% vs 5 yr avg 2.89%
Credit rating : A+
Beta : 0.47
Fwd PE : 16.7 vs 5 yr avg 23.0
If anyone has any other indicators that are better than these ones for identifying LT entry points...please advise and thank you in advance!
busted
EURUSDThe EUR/USD pair is exhibiting bullish tendencies, with the 50% Fibonacci retracement level at 1.1515 acting as a critical resistance. A break above this level, accompanied by supportive economic indicators and ECB policies, could lead the pair towards the target of 1.15132. Traders should remain vigilant for confirmation signals to assess the likelihood of this upward movement.

CADJPY RALLIED IN THE WAKE OF STEADY RATE BY BOJEarlier today, May 1st, The Bank of Japan (BoJ) maintained its interest rates at 0.5%, with a dovish outlook, including trimmed growth and inflation forecasts.
This stance suggests a lower likelihood of near-term rate hikes, this priced in a weaker Yen and hence the Yen lagged across board.
The Canadian Dollar on the other hand being strengthened by the recent rebounds in oil prices took advantage of that, hence the surge in CADJPY.
TECHNICAL VIEW
From technical perspective, prices were supported at 104.35 after it broke out of a major psychological barrier level of 104. Price rallied to the strong supply zone of 105 and currently hovering around 105.06.
From technical lenses, the oscillators: RSI and Stochastic are over stretched hinting signs of possible pullback as they have gone above over bought levels and created bearish divergence: price is forming Higher High and both indicators are possibly forming Lower High simultaneously.
Other things being equal, analysts likely predict price to drop with potential target around 104.35 and if that is taken out, the next potential targets would be 104 and 103. On the other hand, if the bullish momentum is sustained, a break above 105.39 would usher in 106 psychological level. Breakouts of these levels are not ruled out as per analysts.

Azul Brazilian Airlines S.A Stock rebounding, we will watch a high liquidity increases
Stock on Buying signal
Target price = 2.56 - 2.88 $
Buy it now as much as you can 🔥

Nasdaq-100 Goes Back to 'PRE-PAIN' 20 000 Level. Series IIApril has gone..
Wow.. Duh..!? ..really? ... or still not!?
Briefly a month ago or so, we have examined at our wonderful @PandorraResearch Team what is 'Revenge Trading', watch our recent 'Educational' idea right here (if you missed one), to learn what sort of lessons we should know about it.
Indeed, it was a really bad story, to purchase in late March 2025 most-hyped so-known Mag Seven stock that came flagships of the recent stock market collapse.
First of all, watch how it's been below (late March 2025) 👇👇
What's happened next just in a week or two since our publications has been made?
⚒ Russell 2000 Index TVC:RUT 95% stocks were: DOWN
⚒ S&P500 Index SP:SPX 96% stocks were: DOWN
⚒ Nasdaq-100 NASDAQ:NDX as well as Dow Jones Industrial Averages DJIA indices: 97% stocks were DOWN
⚒ Magnificent Seven: ALL STOCKS WERE DOWN
Since Nasdaq-100 went back to pre-pain 20'000 Level, lets repeat some lessons.
Revenge trading is DANGEROUS AND HARMFUL pracrice where traders, after suffering a loss, attempt to immediately recoup their losses by making impulsive, emotionally-driven trades. This behavior is widely recognized as one of the major reasons traders lose significant amounts of money and often blow up their accounts.
Why Revenge Trading Is Bad
1. Emotional Decision-Making Replaces Strategy
When traders engage in revenge trading, they abandon their carefully crafted trading strategies and risk management rules. Instead, trades are made based on anger, frustration, or the desire to "get back" at the market. This emotional state clouds judgment, leading to irrational decisions such as increasing position sizes recklessly, disregarding stop-loss orders, or chasing trades without proper analysis. As a result, the likelihood of making successful trades plummets.
2. Escalating Losses and Account Blowups
The urge to recover losses quickly often leads traders to double down or over-leverage their positions, exposing a large portion of their capital to additional risk. Statistically, 80% of revenge trading ends disastrously, with only a small fraction experiencing temporary success before ultimately facing larger losses. This cycle of chasing losses can rapidly erode trading capital, making recovery increasingly difficult.
3. Psychological Burnout and Stress
Revenge trading is mentally and emotionally exhausting. The constant cycle of loss and frantic attempts to recover can lead to stress, depression, and burnout. This further impairs decision-making, creating a vicious cycle of poor performance and deteriorating mental health.
4. Long-Term Damage to Trading Habits
Repeatedly succumbing to revenge trading ingrains bad habits, making it difficult for traders to maintain discipline and consistency in the long run. This lack of consistency undermines the potential for sustainable profitability and can end trading careers prematurely.
Recent Real-World Examples
Recent years have seen numerous cautionary tales illustrating the dangers of revenge trading (all links are from r/wallstreetbets subreddit for learing/ educational purposes only):
$40,000 Lost on NVDA Options (2024). A trader repeatedly doubled down on Nvidia (NVDA) put options during its price rally in mid-2024. Despite initial small wins, the trader, driven by the urge to recover losses, continued to increase his position size, ultimately losing over $40,000.
$26,000 Lost in 20 Minutes on SPX. A Reddit user reported losing $26,000 in about 20 minutes trading the S&P 500 index (SPX) after prices dropped sharply. The loss was the result of impulsive trades made in an attempt to quickly recover from earlier setbacks.
From $27,000 to $0 in Three Days. Another trader turned $500 into $27,000 in just a few days, only to lose it all within 48 hours after a market reversal. Instead of taking profits or stepping back, the trader kept chasing losses with increasingly risky trades, ending up with nothing.
$100,000 Loss on a Yen Carry Trade. A trader, influenced by news of geopolitical tensions, made a large leveraged bet on the yen. After an initial loss, he refused to cut his losses and doubled down, ultimately losing $100,000 instead of accepting a smaller $30,000 hit.
More juicy stories are to be collected...
These stories are not isolated incidents. They are echoed across trading forums and social media, serving as stark warnings of how quickly revenge trading can destroy even substantial gains.
Conclusion
Revenge trading is DANGEROUS AND HARMFUL because it replaces rational, strategic decision-making with emotional reactions, leading to escalating financial losses, psychological distress, and long-term damage to trading discipline. The real-world examples from the past year underscore that no trader-regardless of experience-is immune to its risks. The best defense is to recognize the urge, step away, and return only with a clear, objective mindset and a disciplined strategy.
--
Best wishes,
@PandorraResearch Team 😎

Ping pong long play for nzdusd Looking at a nice retracement into a good discount buy zone
So as of now looking at sells until alert gets hit
Stay patient , stay disciplined
Use proper risk

BTC DOMINANCEBitcoin dominance could break down at this point, potentially signaling the start of an exceptional altseason.

BTC DOMINANCEBitcoin dominance could break down at this point, potentially signaling the start of an exceptional altseason.
