Trade Idea: Buy USDJPY from the highlighted demand zone (around The market has recently revisited a key demand zone highlighted around the 142.195 level on the 1-hour chart. Price previously reacted strongly to this area, suggesting the presence of institutional interest. After a sharp decline, the pair found support within this zone and has since shown a bullish push, indicating renewed buying pressure.
Fundamental Analysis

The Day Ahead Wednesday April 30
Data: US Q1 GDP, employment cost index, April ADP report, MNI Chicago PMI, March core PCE, personal income and spending, pending home sales, China April official PMIs, Caixin manufacturing PMI, UK April Lloyds Business Barometer, Japan March retail sales, industrial production, housing starts, Germany April CPI, retail sales, import price index, unemployment claims rate, Q1 GDP, France April CPI, March PPI, consumer spending, Q1 GDP, Italy April CPI, March PPI, Q1 GDP, Eurozone Q1 GDP, Canada February GDP, Australia Q1 CPI
Central banks: ECB’s Muller speaks, BoE’s Lombardelli speaks
Earnings: Microsoft, Meta, Samsung, Qualcomm, Caterpillar, TotalEnergies, Airbus, Iberdrola, Santander, UBS, KLA, Equinix, GSK, Tokyo Electron, MediaTek, Equinor, Mercedes-Benz Group, Credit Agricole, Barclays, Volkswagen, CaixaBank, Deutsche Post, Haleon, Robinhood, Societe Generale, Humana, eBay, GE HealthCare, ArcelorMittal, Evolution AB, Repsol, Norwegian Cruise Line, Albemarle, Wingstop, Etsy
Auctions: US Treasury quarterly refunding announcement
This communication is for informational purposes only and should not be viewed as any form of recommendation as to a particular course of action or as investment advice. It is not intended as an offer or solicitation for the purchase or sale of any financial instrument or as an official confirmation of any transaction. Opinions, estimates and assumptions expressed herein are made as of the date of this communication and are subject to change without notice. This communication has been prepared based upon information, including market prices, data and other information, believed to be reliable; however, Trade Nation does not warrant its completeness or accuracy. All market prices and market data contained in or attached to this communication are indicative and subject to change without notice.

USD/CHF: Safe-Haven Demand and Weak U.S. Data Weigh on Dollar!The USD/CHF pair is trading in a general downtrend on the 4-hour timeframe, forming consecutively lower lows. The recent declines are attributed to the weakening US dollar amid concerns over tariff-related disruptions and their impact on the US economy. On the other hand, the Swiss franc has seen increased demand as a safe-haven currency, similar to the Japanese yen.
Will the Pair Continue to Decline?
Markets are closely watching this week’s upcoming US employment data, which is highly significant as it will provide insight into how tariffs are affecting the US labor market.
On Tuesday, April 29, 2025, the JOLTS Job Openings report showed a disappointing reading of 7.91M, marking the lowest level since October 2024. Additionally, the Consumer Confidence Index fell to 86 — its weakest level since July 2014!
These figures highlight weakness in the US dollar and suggest a potential continuation of its decline against other currencies.
Technical Outlook for USD/CHF:
On the 4-hour chart, the pair is in a clear downtrend. A rise toward the 0.83052 level increases the likelihood of a renewed decline, continuing the bearish trend and targeting 0.82291 as the first support and 0.81025 as a second, longer-term target.
This bearish scenario would be invalidated on the 4-hour chart if the price breaks above and closes above the 0.83344 level.
Note: Markets are awaiting several key data releases this week that could impact this pair, including:
• ADP Non-Farm Employment Change
• Advance GDP q/q
• Core PCE Price Index m/m
• ISM Manufacturing PMI
• Average Hourly Earnings m/m
• Non-Farm Employment Change
• Unemployment Rate
If growth and employment data disappoint, the US dollar is likely to continue weakening in the short to medium term.

Oil : April Could Be the Worst Month in Three and a Half YearsOil Prices: April Could Be the Worst Month in Three and a Half Years
As the XTI/USD chart shows:
→ at the beginning of April, WTI crude was trading above $71 per barrel;
→ this morning, on the last day of the month, the price has fallen below $60.
The overall decline may reach 16% — the worst monthly performance since November 2021.
Why Is Oil Falling?
The primary driver behind the sharp drop in oil prices earlier this month was the introduction of new US tariffs, particularly targeting China and the EU. This raised concerns that a potential global trade war could slow economic growth and, in turn, reduce global oil demand.
According to a Reuters poll, the tariffs imposed by Trump have made a global recession in 2025 a realistic risk.
In addition, growing attention is being paid to OPEC+ and its plans to increase oil production. The next meeting is scheduled for 5 May.
Technical Analysis of the XTI/USD Chart
Oil price fluctuations in 2025 have formed a descending channel (highlighted in red), with lower highs and lower lows reflecting continued bearish sentiment.
Bulls may hope for support to emerge around the $58.85 level, as:
→ this has acted as support before (as indicated by arrows);
→ this level aligns with the lower boundary of a local upward trend (shown in blue), which formed after news broke that Trump had postponed the implementation of some tariffs — triggering a sharp rebound in oil prices from the 9 April low.
Nevertheless, the broader structure remains bearish: the rise towards point C appears to be a corrective recovery following the impulse drop from A to B. Given the potential impact of upcoming news — including statements from the White House and OPEC+ decisions — a bearish breakout below the blue channel cannot be ruled out.
This article represents the opinion of the Companies operating under the FXOpen brand only. It is not to be construed as an offer, solicitation, or recommendation with respect to products and services provided by the Companies operating under the FXOpen brand, nor is it to be considered financial advice.

The gold market fluctuated sideways. Waiting for a new trend?OANDA:XAUUSD During the Asian trading session, gold prices maintained a slight decline; in the early European trading, gold began to fall sharply, but it was still within the trend range expected by Quaid.
Today, the initial value of the US real GDP in the first quarter of 2025 will be released, and it is expected to grow by 0.3% at an annualized quarterly rate, after a strong growth of 2.4% in the fourth quarter of 2024.
If the world's largest economy unexpectedly shrinks, it will re-ignite bets on a sharp interest rate cut by the Federal Reserve. And this data will boost the upward trend of gold.
On the other hand, if the cooling of US economic growth is less than expected, it may bring a short-term relief to the overall market and the US dollar, which will continue to put gold under corrective downward pressure.
However, traders will remain cautious before the release of US ADP employment data this week; this data will limit the reaction of gold prices to GDP data. US non-farm payrolls will help the market assess whether US tariffs have had a substantial impact on the labor market.
Current trend analysis:
The daily line closed negative, and it is still bearish today. At the same time, yesterday's decline encountered 3300 support. In this pattern, regardless of today's strength, short once and see how the European session trends. If the European session falls, short the US session; if the European session rises strongly, the US session may remain volatile. If the European session breaks the downward channel, the US session may continue to fall.
Hi guys, if you want a solid trade, please wait for the US GDP data this morning. Quaid conducts gold trading after professional analysis.

GOLD trades around $3,300, market lacks major impactOANDA:XAUUSD sare trading lower around the $3,300/oz flatline as easing US-China trade tensions dampen the appeal of gold as a safe-haven asset, while investors await US economic data to gauge the Federal Reserve's policy direction.
OANDA:XAUUSD have been trading in a narrow range recently as the market awaits details of the first trade deal, which is expected to be announced this week or next.
OANDA:XAUUSD has reversed to a downside correction since last week as Trump made some very positive comments and the risk of stagflation was further ruled out, and gold prices continued to fall. Stagflation has pushed gold higher and as the market starts to price in this risk, a correction is natural, especially considering that “buying gold” has become the top trade and it is technically in overbought territory.
Looking at the larger picture, gold prices remain in an uptrend as real yields are likely to continue to fall amid the Fed’s easing. But in the short term, more positive news on tariffs could see gold prices continue to fall as the market adjusts to the new conditions.
OANDA:XAUUSD , traditionally seen as a hedge against political and financial uncertainty, hit a record high of $3,500.05 last week amid heightened uncertainty.
Investors will be watching economic data for the rest of the week, including Wednesday's personal consumption expenditure report and Friday's non-farm payrolls report.
Technical Outlook OANDA:XAUUSD
On the daily chart, gold continues to move sideways as the accumulation state takes place as the market has no fundamental impact of any sudden change. With the current position, gold is not qualified to increase or decrease significantly with the sideway area of attention in the range of 3,371 - 3,292 USD being the positions of the Fibonacci retracement of 0.236% and 0.382%.
However, overall, gold is still inclined to increase in the long term with the price channel as the main trend and support from EMA21 as the main support. As long as gold remains above/within the price channel, above EMA21, it still has the technical conditions for the main trend to be up, the declines should only be considered as short-term corrections and not an official trend.
During the day, the sideways accumulation state with the main uptrend will be noticed again by the following positions.
Support: 3,292 – 3,267 USD
Resistance: 3,371 USD
SELL XAUUSD PRICE 3382 - 3380⚡️
↠↠ Stop Loss 3386
→Take Profit 1 3374
↨
→Take Profit 2 3368
BUY XAUUSD PRICE 3283 - 3285⚡️
↠↠ Stop Loss 3279
→Take Profit 1 3291
↨
→Take Profit 2 3297

META Share Price Rises Cautiously Ahead of Earnings ReportMETA Share Price Rises Cautiously Ahead of Earnings Report
As shown on the Meta Platforms (META) chart, the share price rose by approximately 1% yesterday. This movement was supported by the announcement of the launch of the Meta AI app—an artificial intelligence-based application that will function as a personal assistant on mobile phones (similar to Google Gemini).
In a different market environment, the news might have prompted a more positive reaction. However, traders currently appear to be exercising caution, as Meta Platforms (META) is due to report its quarterly results after the close of the main trading session today. According to media reports, expectations include:
→ Revenue in the range of $41.35–$41.5 billion, which implies a year-on-year increase of roughly 13–14%.
→ Earnings per share (EPS) between $5.22 and $5.29, indicating a 11–12% rise compared to the same period last year.
Key Factors in Meta’s Quarterly Report
The following areas are likely to have a significant impact on META's share price in the wake of the report:
→ Advertising business , Meta’s primary revenue stream (around 96%). There is a possibility that US tariff policies could prompt major Chinese advertisers—such as Temu—to reduce their advertising spend in the United States.
→ Investment in Artificial Intelligence (AI) and Augmented Reality . Market participants may revise their valuation of the stock downwards if there are lingering concerns over the long-term return on these investments.
→ Forward guidance on revenue and earnings for the next quarter and full year 2025. These forecasts will carry particular weight in an environment of elevated uncertainty linked to US trade policy.
Most Wall Street analysts maintain a “Buy” rating on Meta shares. However, some have lowered their price targets in April, noting that the stock has lost roughly a third of its value since its all-time high in February.
Technical Analysis of Meta Platforms (META)
Price movements earlier in 2025 continued to trace a rising trend channel (shown in blue), with a run of 19 consecutive days of gains in February following upbeat news. However, this trend channel appears to have lost relevance at this stage.
The psychological level of $500 now offers strong support, while the $585 level has turned into resistance. It is reasonable to expect that the earnings report could trigger heightened volatility and a test of one of these key price levels.
This article represents the opinion of the Companies operating under the FXOpen brand only. It is not to be construed as an offer, solicitation, or recommendation with respect to products and services provided by the Companies operating under the FXOpen brand, nor is it to be considered financial advice.

IBM leads the investment push in the USABy Ion Jauregui – Analyst at ActivTrades
IBM (NYSE: IBM) has announced an ambitious investment of $150 billion in the United States over the next five years, aiming to strengthen its position in the development of quantum computers, mainframes, and critical infrastructure technologies. This strategic decision comes at a key moment when the U.S. technology sector is repositioning itself as a global innovation engine.
This announcement adds to the recent commitment by giants such as Nvidia (NASDAQ: NVDA) and Apple (NASDAQ: AAPL), which have jointly pledged over $500 billion in investments, consolidating an unprecedented wave of technological spending. The move not only reflects confidence in the sector's potential but also responds to the current geopolitical context, which is driving the relocation of strategic capabilities to U.S. soil.
Recent Financial Results of IBM
In the first quarter of 2025, IBM reported revenues of $14.54 billion, exceeding analysts’ expectations. The company posted adjusted earnings per share of $1.60, although this represented a 5% decrease compared to the previous year. The software division showed 7% growth, reaching $6.34 billion, while the consulting and infrastructure units experienced revenue declines.
Despite macroeconomic challenges and reductions in government contracts, IBM maintains its revenue growth forecast of at least 5% for 2025 and expects to generate free cash flow of approximately $13.5 billion.
IBM Analysis
At market close on April 29, 2025, IBM shares were trading at $246.95, representing a 2.38% decrease from the previous day. However, over the past year, shares have shown a positive trend, rising by 22%, reflecting investors' confidence in the company’s long-term strategy. Since May 2023, the stock has been trending upward in a sequence closely aligned with its quarterly earnings releases.
In the most recent cycle since March, combined with the U.S. tariff situation—which has significantly affected IBM—the share price dropped to $214.50, after which a strong support zone was established at that level. Currently, moving average crossovers indicate an intersection between the 50-day and 100-day moving averages, suggesting the price could return toward $222.49, slightly below the 38.20% level ($234.34), with the mid-zone around $240.48. This level coincides with previous resistances, now acting as support.
Currently, the Point of Control (POC) is located around $185, well below the current trading zone and the last impulse area. The RSI is at 49.91%, slightly oversold, which could lead to an upward price movement if quarterly results prove positive—as seen on previous occasions.
Impact on the S&P 500 and Outlook
The market reaction has been swift. The S&P 500 index, where IBM is a historic component, could benefit indirectly from this renewed investment momentum. Although IBM has not had the market spotlight of its more modern peers, its focus on high-value technologies such as quantum computing could lead to a progressive revaluation of its shares and support diversification within the index.
In an environment driven by artificial intelligence, semiconductors, and technological autonomy, IBM wants to make it clear that it remains in the game. Its bold move not only reinforces its role in the digital ecosystem but also underscores the renewed dynamism of the technology sector within the S&P 500.
*******************************************************************************************
The information provided does not constitute investment research. The material has not been prepared in accordance with the legal requirements designed to promote the independence of investment research and such should be considered a marketing communication.
All information has been prepared by ActivTrades ("AT"). The information does not contain a record of AT's prices, or an offer of or solicitation for a transaction in any financial instrument. No representation or warranty is given as to the accuracy or completeness of this information.
Any material provided does not have regard to the specific investment objective and financial situation of any person who may receive it. Past performance is not reliable indicator of future performance. AT provides an execution-only service. Consequently, any person acting on the information provided does so at their own risk.

Gold Regains Momentum Key Trading Setups Ahead of Volatile Week📌 Gold Regains Momentum – Key Trading Setups Ahead of Volatile Week 🔥📊
📈 Technical Overview
Gold (XAU/USD) started the week with a strong recovery after last week’s sharp drop. Price is currently stabilizing near the major support zone around 3,274 – 3,292, forming a fresh consolidation range that could lead to a bullish continuation — if key support holds.
Last week’s weaker-than-expected US employment data weakened the Dollar Index (DXY), supporting a rebound in gold. However, the market remains cautious ahead of today’s ADP Non-Farm Employment release, which could serve as a directional catalyst.
So far, gold is trading sideways, with mild corrective pullbacks, waiting for clear confirmation from upcoming data.
🔍 Key Support & Resistance Levels
Resistance: 3,336 – 3,352 – 3,357 – 3,366
Support: 3,305 – 3,292 – 3,274
🎯 Trade Setups for Today
🔵 BUY ZONE
Entry: 3,274 – 3,276
SL: 3,270
TP: 3,284 → 3,291 → 3,301 → 3,336
📝 A deeper dip into the 3,274 area could offer another long opportunity, but confirmation is key before entering.
🔴 SELL ZONE 1
Entry: 3,350 – 3,352
SL: 3,356
TP: 3,346 → 3,342 → 3,338 → 3,334 → 3,330 → 3,320
📝 Watch for rejection near 3,350. If price fails to break above, this zone could offer a solid intraday short.
🔴 SELL ZONE 2
Entry: 3,366 – 3,368
SL: 3,372
TP: 3,362 → 3,358 → 3,354 → 3,350 → 3,345 → 3,340
📝 If price is unable to hold above 3,366 resistance, look for sell opportunities targeting a drop back to 3,350 and below.
⚠️ Important Notes
Today’s session may be volatile due to ADP Non-Farm Employment expectations.
Geopolitical tension in Asia may also impact gold, so remain alert to surprise headlines.
Apply strict SL/TP risk management as markets prepare for Friday’s NFP release.
✅ Conclusion
We’re entering a pivotal session where gold is testing key zones just ahead of critical employment data. Use tight stops and clear confirmations for all trades.
🚨 Trade with discipline — stay patient, and be prepared for volatility.
💬 What’s your setup for today’s gold session? Watching for a breakout or fading the highs? Drop your view below! 👇👇👇

PSO Facing Trendline Resistance – Possible Retracement AheadMollyRonaldFx Report
The PSO 15-minute chart shows a strong bounce from recent lows, with price currently testing a well-defined descending trendline. Although today’s movement reflects bullish momentum (+2.22%), the resistance at this trendline may trigger a pullback. The projected short-term scenario indicates a potential dip towards the 348 support zone. A failure to break and hold above the trendline could confirm this bearish move. Watch price action closely near the resistance area for confirmation.

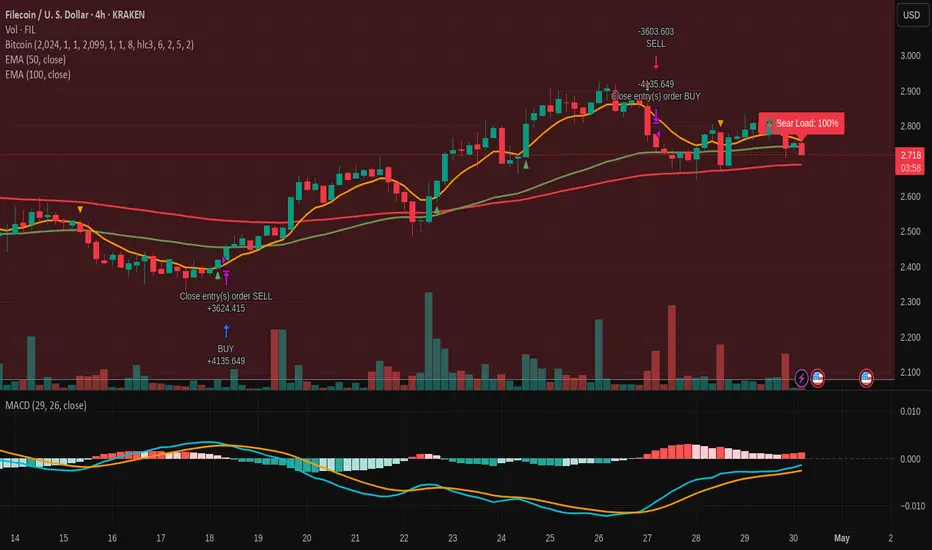
Bear Load 100% | Quant Signal ActiveYou’re looking at engineered suppression.
But the algo reads it differently:
- Price above 50/100 EMA
- MACD building upside momentum
- Low-vol selloffs absorbed
While retail panics, quants position.
F3 is now live. The market hasn’t priced that in.
This is where compression builds velocity.
Execution isn't emotional. It’s structural.
Stay on program.
#FIL #Filecoin #QuantMind #CryptoTrading #F3 #DePIN #Web3
Gold fluctuates and is bearish, waiting for NF
📌 Policy factors
Gold prices (XAU/USD) continued to fall, falling to $3,310 in the current European session on Wednesday, as signs of improved global risk sentiment and easing trade tensions curbed demand for safe-haven assets. Market participants remained cautious ahead of the release of major US economic data, including ADP employment changes, core PCE price index and first quarter GDP preliminary values, all of which are scheduled to be released later today.
It is reported that President Trump suddenly signed an executive order to provide automakers with up to 15% tariff rebates to ease the impact of his auto tariff policy. Even more unexpectedly, US Commerce Secretary Lutnick revealed that a trade agreement had been reached secretly with a certain country. These major changes immediately triggered a strong market reaction.
📊Comment Analysis
Gold price maintains the accumulation range of 3265-3360, temporarily stable and waiting for large fluctuations
💰Strategy Package
🔥Sell gold area: 3368-3370 SL 3375
TP1: $3350
TP2: $3340
TP3: $3330
🔥Buy gold area: $3264-$3262 SL $3257
TP1: $3280
TP2: $3300
TP3: $3318
🔥Buy gold area: $3285-$3283 SL $3280 scalping
TP1: $3290
TP2: $3295
TP3: $3300
⭐️ Note: Labaron hopes that traders can properly manage their funds
- Choose the number of lots that matches your funds
- Profit is 4-7% of the capital account
- Stop loss is 1-3% of the capital account

Gold chart breakdownTHIS CHART ANALYSI IS A BREAKDOWN OF GOLD MOVEMENT
we are at a critical price in the gold market indicated by zones at 3305-3280, it has been indicated in the analysis by a rectangle . if the rectangle region holds us up then we could further hedge bullish but if it doesnt, the market could fall more as bears may take over.
Note that there may be slight changes as the markets goes by due to other external factors like news and dxy .
updates would be given as time goes by.......

Fundamental Market Analysis for April 30, 2025 GBPUSDThe GBP/USD pair continues to fall for the second consecutive session, hovering near 1.3390 during Asian trading on Wednesday. The pair has been under pressure as the US dollar has strengthened amid renewed optimism over trade developments between the US and China. Traders are now turning their attention to the upcoming release of the March Personal Consumption Expenditure (PCE) price index, which is a key inflation gauge for the Federal Reserve.
The U.S. Dollar Index (DXY), which measures the dollar's exchange rate against six major currencies, remains above 99.00, suggesting U.S. Treasury yields are rising. The 2-year and 10-year US bond yields broke a four-day losing streak and were trading around 3.66 per cent and 4.17 per cent respectively at the time of writing.
On the data front, the JOLTS US job openings report released on Tuesday showed a decline in the number of open positions to 7.19 million in March - the lowest level since September 2024 - indicating a cooling in labour demand. The figure fell short of expectations and emphasised growing economic uncertainty.
Adding to GBP/USD's decline are rising expectations that the Bank of England (BoE) will cut rates at its May meeting. Lower inflation expectations in the United Kingdom (UK) and increasing global economic factors favour a rate hike.
Bank of England Governor Megan Green recently stated that tariffs proposed by US President Donald Trump could lead to lower inflation in the UK, although significant uncertainties remain over the broader economic impact and recent tax hikes for employers.
Trading recommendation: SELL 1.3390, SL 1.3420, TP 1.3300

**EUR/USD Technical Outlook** – 30min Chart📉The pair is currently trading within a well-defined **range**, showing repeated reactions to key horizontal **zones**.
🔹 **Resistance Zone**: 1.1418 – 1.1427
🔹 **Support Zone**: 1.1356 – 1.1360
Price action has shown multiple rejections at the upper boundary, indicating potential **selling interest**. The projected path suggests a possible short-term **retracement** from the resistance area back toward the support zone, where past demand has emerged.
This setup reflects a classic **range-bound behavior**, ideal for traders watching for reversals at key zones. Patience and confirmation are key as price approaches the upper boundary again.
📊 Monitoring price reaction around the 1.1420 level for potential decision-making.

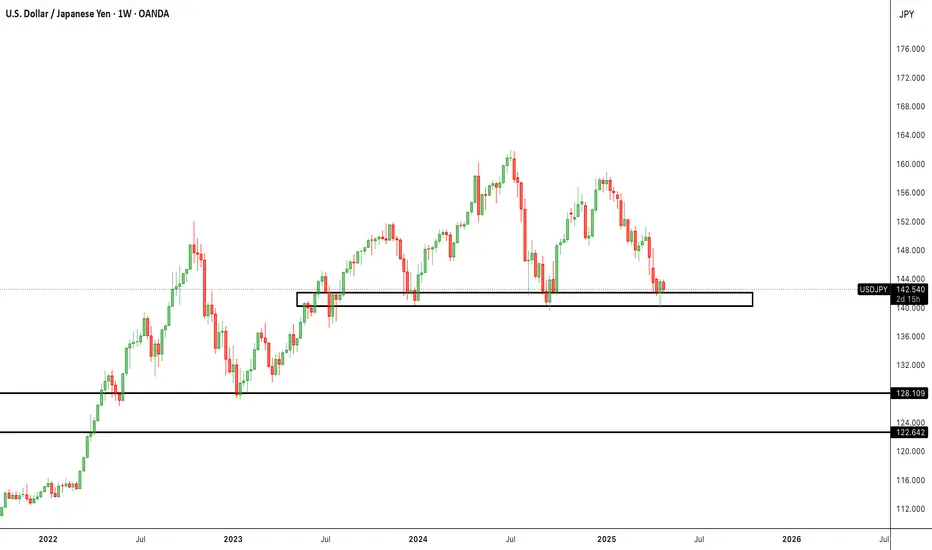
USD/JPY Retests Support Zone as Kato-Bessent FX Talks UnfoldOverview Summary:
USD/JPY has reached a structurally significant weekly support/demand zone (140.0–142.0), where price has historically found support and initiated bullish reversals. As price consolidates in this zone, we are also seeing critical macroeconomic shifts unfold, mainly surrounding 'Japan-U.S. FX policy negotiations' and diverging central bank strategies.
Key Macroeconomic Drivers:
1. BOJ Policy Outlook:
The Bank of Japan has held rates near zero while inflation creeps above target. Despite global tightening trends, BOJ remains dovish and is cautious about hiking too soon. This supports further JPY weakness unless a shift occurs.
2. Kato-Bessent FX Meeting:
Japan and the U.S. held their first bilateral currency discussion in 2025, with Kato emphasizing Japan’s economic conditions and wage data. While the U.S. issued no formal statement, the absence of joint commentary adds uncertainty around potential FX alignment or future intervention strategies.
3. U.S. Treasury Talks with Japan:
U.S. and Japan are back at the negotiation table regarding FX stability and trade policy. While both affirm free-market rate setting, growing U.S. trade deficits with Japan are pressuring the Yen higher and inviting political attention.
4. U.S. Trade Pressures & Currency Realignments:
With the U.S. trade deficit with Japan widening and USD strength persisting, policymakers face rising pressure to address competitiveness. If unchecked, this could trigger direct currency commentary or coordinated action in future meetings.
5. Global Currency Realignments:
With USD strength persisting on rate divergence and geopolitical flows, Japan’s export competitiveness may cause either policy changes or FX intervention if the Yen weakens too far.
Technical Analysis:
- Weekly chart shows a clear support/demand zone between 140.0–142.0 , previously acting as a reversal area multiple times since 2023.
- We’re currently seeing early signs of consolidation and wick rejection, a potential setup for a bullish bounce if macro factors align.
- Break below 140.0 opens downside to 128.00 and 122.00 , both historically significant zones.
Trade Setup (If Support Holds):
Entry Zone: 140.00–142.00
Target 1: 150.00
Target 2: 158.00
Invalid Setup: Daily Close Below 139.50
Final Take:
USD/JPY is currently at a macro + technical inflection point. If support holds and Japan refrains from policy tightening, we could see the pair bounce sharply back into the 147–150 range. However, any unexpected BOJ hawkishness or coordinated U.S.-Japan currency intervention would flip this narrative quickly. Stay tactical, monitor policy headlines, and size positions with volatility in mind.
Is a Tesla Stock Rebound Imminent?Tesla's stock has recently faced volatility, partly due to first-quarter 2025 delivery figures that did not meet some market expectations. Despite this, several significant factors suggest a potential for upward movement in the share price. As the stock hovers around $292 in late April 2025, market observers are closely watching for catalysts that could shift sentiment and drive value appreciation for the electric vehicle and energy company.
Key indicators pointing towards a potential rebound include notable insider activity and the highly anticipated launch of a dedicated robotaxi service. A Tesla board member and Airbnb co-founder recently purchased over $1 million in TSLA stock, marking the first insider buy of this magnitude in approximately five years. This action signals strong internal confidence. Furthermore, the planned June launch of a robotaxi service in Austin, Texas, using autonomous Model Y vehicles, is viewed as a transformative step that could open substantial new revenue streams and redefine Tesla's market position.
Adding to the bullish sentiment is unusual activity in the options market, where a significant investor placed a large bet on a substantial price increase in the near term through out-of-the-money call options. While recent delivery misses and concerns regarding external factors have contributed to past stock pressure, the combination of insider conviction, a looming disruptive service launch, and aggressive bullish options trading suggests that the market may be poised for a significant reaction to upcoming positive developments. Investors are keenly focused on the successful execution of the robotaxi strategy as a critical determinant of future stock performance.

USDCAD | Technical Rebound or Final Stop Before the Crash?USDCAD is currently in a highly delicate phase: the price has reached a key weekly demand zone between 1.3720–1.3820, which overlaps with a strong Fibonacci retracement cluster (0.705–0.78) of the previous bullish leg. So far, the reaction has been muted, but price compression and fading volatility suggest a potential short-term rebound.
However, looking at the bigger picture, the macro and positioning signals are flashing red for the US dollar:
📊 COT Report: Non-Commercials are significantly increasing short positions on USD and reducing shorts on CAD → bearish bias on USDCAD
🧠 Retail sentiment: Most retail traders are long on USDCAD → contrarian bearish bias
🗓️ Seasonality: May is historically negative for the USD and positive for the CAD → further confirms the short thesis
Only a structural recovery above 1.4150 on the weekly close would invalidate the bearish setup. Until then, any retracement towards 1.3980–1.4050 should be seen as an opportunity to sell strength.
🎯 Key Levels:
Sell zone: 1.3980–1.4050
Invalidation: Weekly close > 1.4150
Targets: 1.3720 – 1.3550
🔔 Critical note: When everyone is long, often the only direction left is down.

Gold seeing further decline to down sideBased on the market condition price God looking as the bearish trend due to China and US War market will suggest low volume and also looking bearish tend but as slow volume here is the key Points for trading taking profit long-term.
Key Levels
Resistance zone 3328 / 3340
Support zone 3290 / 3250
if the price will stay in 3320 the next will be 3290 and also 3250 and long Term 3340,
As Always use proper risk management according to equity and must like and comments Thanks.

Gold in Focus: Tight Range Before Major US Data 🌐 Gold in Focus: Tight Range Before Major US Data – Time to Prepare for the Storm?
Gold (XAU/USD) is currently trapped within a narrow consolidation zone, with traders across global markets awaiting critical economic events in the second half of this week. The bounce from the 3290–3270 support zones confirms strong buying interest, yet bulls seem cautious ahead of the ADP employment report today and the all-important Nonfarm Payrolls (NFP) on Friday.
Despite dovish signs from recent labor data and declining US bond yields, gold has not been able to regain strong upward momentum. This hesitance is attributed to mixed market sentiment fueled by ongoing US-China trade negotiations, potential interest rate outlook shifts from the Fed, and end-of-month positioning across major asset classes.
💼 What’s happening behind the scenes?
US 10Y yields dropped, signaling weaker inflation outlooks — usually bullish for gold.
DXY remains fragile but still attracts safe-haven inflows amid global political tensions.
Investors are cautious ahead of back-to-back economic events and might delay large trades until Friday.
With a bank holiday looming in Asia and Europe tomorrow, liquidity could tighten and amplify volatility. Gold might continue trading in a compressed range between 3274–3357 until NFP injects a fresh directional impulse.
🔍 Technical Roadmap:
🔺 Resistance Levels to Monitor:
3328
3336
3352
3357
3366
🔻 Support Levels to Watch:
3305
3292
3274
📌 Trade Strategy (30m–1H timeframe bias)
🔵 BUY ZONE A
📍 Entry: 3292 – 3290
🎯 SL: 3287
🎯 TP: 3295 → 3300 → 3304 → 3308 → 3315 → 3320
🔵 BUY ZONE B
📍 Entry: 3275 – 3273
🎯 SL: 3268
🎯 TP: 3280 → 3284 → 3286 → 3290 → 3300
🔴 SELL ZONE A
📍 Entry: 3350 – 3352
🎯 SL: 3356
🎯 TP: 3345 → 3340 → 3336 → 3332 → 3320
🔴 SELL ZONE B
📍 Entry: 3365 – 3367
🎯 SL: 3371
🎯 TP: 3361 → 3357 → 3352 → 3347 → 3340
📣 Final Thoughts:
We are in the "calm before the storm" phase. Price is coiling in tight ranges with declining volume and momentum. Today's ADP report could trigger intraday volatility, but major players may still remain on the sidelines until Friday's NFP.
As it’s also the last day of the month, be alert for liquidity grabs and potential stop hunts. Stick to your risk management plan and avoid revenge trades in volatile setups.
🛡️ Stay patient. Trade smart. Let the market reveal the direction.

BTCUSDT - Rejection at Resistance | Watching Key Support ZonePrice faced strong rejection from the supply zone (marked S-T-R), forming a double top near the 95,300–95,500 level. This zone is acting as a key area where sellers are active. The market is now pulling back and approaching the support zone near 93,800–94,000. If price holds here, we could see a potential bounce. A break below might indicate further downside. Trade idea includes clear risk management with defined stop and target.

US500 TRADE IDEAhi again
The US500 has shown strength by breaking the resistance at 5483.5 and is now at 5535. If the price reaches 5604.6 and a pullback occurs, targeting a temporary decline at the 50% Fibonacci retracement level is a good strategy.
Fibonacci retracement is often used to identify potential support and resistance levels where the price might pause or reverse. The 50% level is one of the commonly watched levels by traders as it often indicates a significant turning point in price movement.
good luck all
**My trading strategy is not intended to be a signal. It's a process of learning about market structure and sharpening my trading my skills also for my trade journal**
Thanks a lot for your support

MAGIC – Building Energy for the Next Move?Hey traders!
#MAGIC has shown strong volume over the past few days, and now it's consolidating sideways – hovering just above a key support zone. This kind of setup often signals that a bigger move is brewing... but which way?
Here’s what we’re watching:
✅ Support holding firm – buyers seem to be stepping in around this level.
✅ Volume remains healthy, indicating continued interest.
✅ Price is coiling, setting the stage for a potential breakout.
📌 Our Plan:
We’re eyeing a breakout above the resistance level for confirmation of the next leg up. Once that happens, we’ll look for a retest of the breakout zone as our entry point for a long position – backed by proper risk management, of course! 💯
🎯 Target: Previous highs
📉 Invalidation: Clear breakdown below support
What do you think? Are you watching MAGIC too? Drop your thoughts, charts, or setups below! Let’s build together. 🔥👇
#MAGIC #Altcoins #CryptoTrading #BreakoutSetup #PriceAction #SupportAndResistance #VolumeAnalysis #TradeSetup #TradingView #CryptoCommunity
