WHY you MUST analyze 28 CURRENCY PAIRS for added confluenceAll the information you need to find a high probability trade are in front of you on the charts so build your trading decisions on 'the facts' of the chart NOT what you think or what you want to happen or even what you heard will happen. If you have enough facts telling you to trade in a certain direction and therefore enough confluence to take a trade, then this is how you will gain consistency in you trading and build confidence. Check out my trade idea!!
www.tradingview.com
Fundamental Analysis

Gold, Nasdaq & USDI am comparing the relationship between Gold, the Nasdaq and the US Dollar.
Since 2000, here are approximate returns for each;
Gold up 550%
S&P up 254%
DOW up 364%
Since 2020:
In the past 5 years, this shifted slightly with Gold up about twice as much as the Nasdaq.
Since 2024:
In the past year, Gold has outpaced the Nasdaq 5:1 on gains.
__________________________________________________
The dollar had three notable high gain/peak years in;
1985
2002
2022
Those peak dollar years occurred when the market was in a correction phase, selling off before the next rally, and followed a bull market rally. After each of those peak dollar years, a market rally occurred that lasted from a few months to a few quarters with substantial gains. Typically when the dollar is strong, gold prices have been suppressed. If the dollar weakens, it may allow Gold to continue a rally. We may have already seen that market rally, which just peaked in December 2024 after the dollar peaked in 2022.
If the dollar continues to lose strength, Gold prices will likely continue to rise.
from Bloomberg 4 days ago:
"A dollar gauge is on track for its worst performance during the first 100 days of a United States presidency in data going back to the Nixon era, when America abandoned the gold standard and switched to a free-floating exchange rate."
The correlation between Gold and Equities lacks any data to support, especially considering the past 20 years of market data. Gold's relationship with the markets is an algorithm that includes the US Dollar. If the dollar is strong, we see Gold prices suppressed. When the dollar is weak, we see Gold prices unlocked and free to make gains. That's where Gold is now.
Forecast:
The only information available to base a forecast for Gold pricing would be the US Dollar based on the economic relationship of the USD and Gold. Since the dollar has pulled back slightly and appears to be in a slightly downward trajectory, it is expected that Gold prices will continue to gain, although likely at a slower rate.
Since the Dollar peaked in 2022, followed by a bull market for several quarters after that event, the Nasdaq is likely headed further into correction territory followed by a consolidation phase before beginning another bull market. The Nasdaq is currently in the second annual financial quarter of a pullback that will likely last several more quarters. This market correction began in December 2024.

EURJPY – Technical Outlook & Strategic Perspective (Apr 29 – May
📊 EURJPY
Over the recent sessions, I’ve identified an interesting structure forming on the **EUR/JPY** pair, pointing to a potential **short-term bullish move** over the next **2 to 3 days** before a possible trend reversal starts to materialize.
My bias is based primarily on the **presence of Fair Value Gaps (FVGs)** that have yet to be filled. These imbalances suggest the market may seek to revisit these zones to balance liquidity. Additionally, there are clear signs of buyer defense in a sensitive price region, reinforcing the thesis of a **technical recovery** before any long-term directional decision.
🧠 :
- Support zone respected after selling pressure eased.
- FVGs identified in alignment with a potential pullback structure.
- Expectation of a bullish move toward upper liquidity zones, with partial TPs set near **162.546** and extended targets around **163.770/163.776**.
🎯 **Plan:**
- Entry already triggered upon confirmation.
- Stop-loss safely placed below recent swing low (161.770).
- Take Profits aligned with FVGs and a risk-to-reward ratio of over 1:2.
🔎 *Strategic Note:* Once these value zones are filled, I’ll be closely monitoring for **Change of Character (CHOCH)** signals that could confirm the start of a new cycle on the pair. For now, my focus is on **gap-filling and market equilibrium** before any long-term directional play.
📍Posted by: Emerson Massawe
Trader | Strategist | COO of Rodaviva | CEO of Xerof Capital

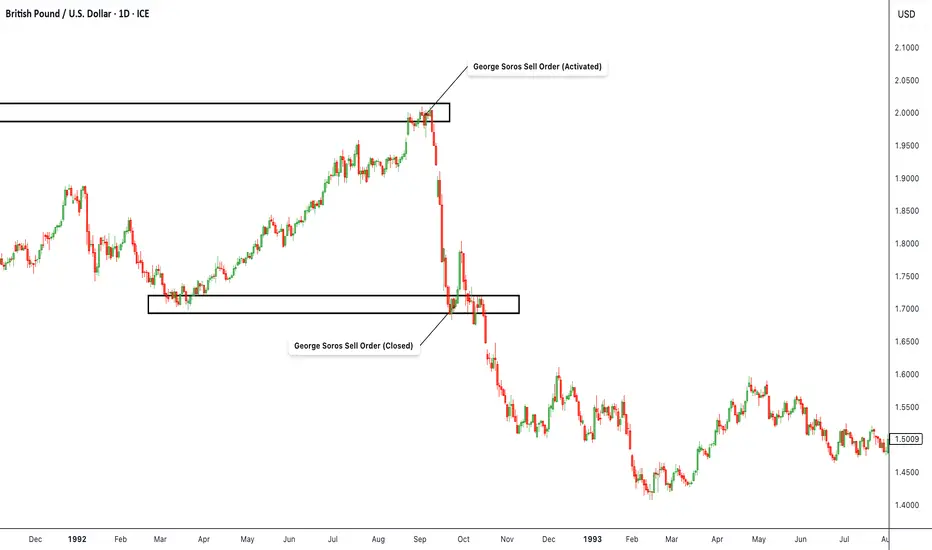
GBP/USD – 1992 Replay | George Soros “Broke the Bank” TradeHistorical Context Summary:
This chart revisits the iconic 1992 short by George Soros against the British Pound, which ultimately forced the UK to abandon its currency peg and exit the European Exchange Rate Mechanism (ERM). The marked zones reflect the approximate levels where Soros reportedly initiated and closed his short position, anticipating a collapse of the GBP against the USD.
Real-time Trade Thesis:
Soros identified that the British economy was fundamentally too weak to sustain a fixed exchange rate against the Deutsche Mark, enforced through the ERM. Inflation was high, the economy was slowing, and the government was hiking rates and burning through reserves to defend the pound. Meanwhile, Germany’s economy was far stronger, making the GBP significantly overvalued relative to its fundamentals.
The Quantum Fund went short over £10 billion worth of GBP using highly leveraged positions, primarily via GBP/USD. On September 16, 1992 ("Black Wednesday") , the Bank of England capitulated after failing to hold the peg, and the pound collapsed—securing Soros one of the most profitable trades in history with over $1 billion in gains.
Technical Analysis Context:
This GBP/USD chart highlights the upper “order activation” zone where Soros began scaling into his short, as price stalled near the artificially defended level. As speculative pressure intensified, the central bank’s interventions failed, leading to a violent breakdown. The lower box marks the approximate range where Soros likely began closing the trade and locking in profit as the peg failed and panic selling set in.
Key Lessons:
Pegged currencies can’t defy economic fundamentals forever.
Macro conviction + tactical timing = asymmetric return.
Central banks can lose to coordinated market pressure.
Use leverage wisely, only when your thesis is airtight.
Liquidity stress often precedes capitulation—watch reserve flows and bond yields.
History leaves patterns—legendary trades repeat in new forms across cycles.
Trade Idea: US30 Long (BUY LIMIT)Technical Analysis Summary
Daily Chart (Macro View)
• Price has bounced off a key support near 37,700 and reclaimed the psychological level 40,000.
• MACD is starting to reverse higher from oversold conditions, showing early bullish divergence.
• RSI is recovering from below 30, now near 49, indicating a potential trend reversal.
• Trend: Medium-term recovery from a correction; possible continuation to recent highs around 44,000.
15-Minute Chart (Tactical Entry Zone)
• Price has broken a downtrend and is now consolidating above previous resistance at 40,000.
• MACD is bullish (histogram rising), and signal lines are above zero.
• RSI at 62.6, suggesting bullish momentum but not yet overbought.
• White MA shows clear upward curvature.
3-Minute Chart (Precision Entry)
• Recent pullback retested the MA and bounced.
• RSI at 66, nearing overbought, but price is in clear short-term uptrend.
• MACD just crossed bullish again after a small consolidation.
⸻
Fundamental Context
• Recent Fed signals suggest potential rate pause or cuts, which is bullish for indices.
• Earnings season has generally surprised to the upside, especially among large caps.
• Macro backdrop: Slowing inflation + strong labor market = supportive of equities.
• Risk appetite is increasing, as seen in tech and industrials rebounding.
⸻
Trade Setup
• Position: Long US30
Entry
• Buy: 40,200 (current price action confirms upward momentum)
Stop Loss (SL)
• SL: 39,700 (below recent 15-min swing low & psychological level)
Take Profit (TP)
• TP1: 41,200 (recent intraday high and near resistance)
FUSIONMARKETS:US30

Daily Analysis- XAUUSD (Wednesday, 30th April 2024)Bias: Bullish
USD News(Red Folder):
-Advance GDP q/q
-Employment Cost Index q/q
-Core PCE Price Index m/m
Analysis:
-Consolidation on daily time frame
-Looking for price to respect the structure high & low
-Potential BUY/SELL if there's confirmation on lower timeframe
-Pivot point: 3380,3250
Disclaimer:
This analysis is from a personal point of view, always conduct on your own research before making any trading decisions as the analysis do not guarantee complete accuracy.

Cautiously longThe S&P 500 daily chart indicates buyers are present but the overall structure implies we should be cautiously long at these levels. We still have a lot of fundamental information and economic information coming out this week that can stimulate this market in either direction.

GOLD scenario 30.04.2025English : According to our analysis, we anticipate a BULLISH scenario.
Morocan Darija : kanchofo d'apres l'analyse dyalna antsanaw TLOO3
ATENTION : I only share my ideas, not signals

Clean set up Bouncing of the lower trend line yet again, CleanSpark plans to sell mined Bitcoin each month and has secured a $200M credit line from Coinbase Prime as it shifts toward self-funding operations.
I'm a fan of more cash on hand giving the room to scale.

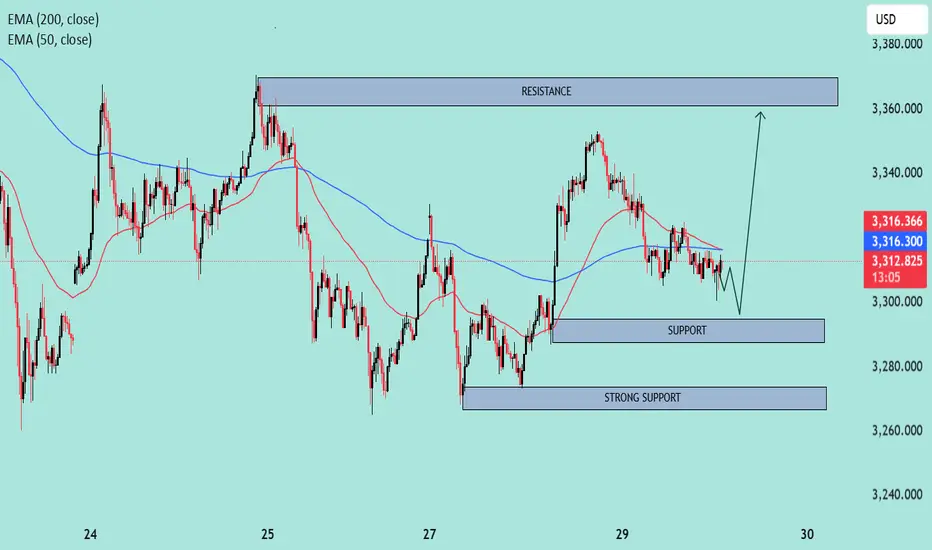
XAUUSD – Bullish Reversal Setup Near Support🟦 Chart Context:
Type: Intraday (likely 15m or 1h timeframe).
Indicators Used:
EMA 50 (Red): 3,316.497
EMA 200 (Blue): 3,316.332
Current Price: 3,312.650
🔍 Technical Analysis:
1. Trend & Moving Averages:
EMA Crossover (Bearish): The 50 EMA is slightly above the 200 EMA, but both are flat and converging, suggesting a neutral to slightly bearish short-term sentiment.
Price below both EMAs indicates bearish pressure in the immediate term.
2. Key Zones:
Resistance Zone: 3,355 – 3,370
Price was previously rejected from this zone, indicating strong supply and likely sell orders.
Support Zone: 3,295 – 3,305
Price has bounced here multiple times, suggesting active buyers.
Strong Support: 3,265 – 3,275
A broader and more historically respected area that could lead to a significant reversal if tested.
3. Price Action:
Currently forming lower highs and lower lows, which is a classic sign of short-term weakness.
A small descending triangle appears to be forming near the support level (bearish bias), but the drawn forecast suggests a potential fakeout breakdown followed by a bullish reversal.
4. Expected Scenario (as per chart projection):
Price might dip briefly into the 3,295–3,305 support, triggering liquidity grab (stop hunts).
A potential bullish rally towards the 3,355–3,370 resistance zone is expected.
This suggests a buy-the-dip strategy near support with tight risk management.
📈 Trade Outlook:
🟢 Bullish Bias:
If the support at 3,295–3,305 holds and price reclaims the 200 EMA convincingly.
Target: 3,355–3,370 resistance zone.
🔴 Bearish Bias:
If price breaks below the strong support (3,265), expect continuation lower.
Downside targets would then extend towards 3,240–3,250.
✅ Conclusion:
Current bias: Neutral to short-term bearish unless the lower support holds.
Key action zone: Watch price reaction around 3,295.
Strategy suggestion: Monitor for a bullish reversal signal at support; avoid chasing trades in the middle of the range.
OVERSOLD NKELooking for the closest gap fill and to retest the down slopping trend line. China or Vietnam tariff deal like most stocks this would easily move +10% instantly, current valuation is like buying in 1997! down 70% from the highs fair value $112.

Under 400$ is a steal Strong move off 150 support. They had a 180 sell downgrade announced from some clowns today they'll be revising there targets shortly. COIN will be used be everyone and there grandma soon enough. Consumer/government dollars pouring in is insane this company is not going anywhere they also just realsed plans for BTC Yield Fund, offering 4-8% APY to non-US institutional investors through a limited leverage cash-and-carry trade strategy.
I don't think we'll be falling below 178 would be a great entry if your lucky enough.

This is just to show off my trendline skills, nothing more Hmmm. This is ethereum obviously. I don’t know much about TA but I think the little I learned put me a step ahead and I’m thankful for OpenAI. I get to work with a personal trainer or every information and logic I need.. just a chat away. It’s incredible.
So I think Eth is consolidating, just learnt that word. And it’s getting ready to do something. The logic is to just ride the wave of the market.. it’s almost impossible if you don’t know the trajectory of the market. But if you do then you one step safer…. Trendline helps with that

Bearish Outlook on EurjpyA bearish outlook on EUR/JPY (Euro/Japanese Yen) typically stems from either Euro weakness, Yen strength, or a combination of both. Here are several current or general themes that could support a bearish bias:
1. Risk-Off Sentiment (Yen Strength)
The Japanese Yen is a safe-haven currency, which tends to strengthen during global risk aversion (e.g., geopolitical tensions, stock market declines, or economic uncertainty).
If equities fall or global sentiment sours, JPY demand can rise, pushing EUR/JPY lower.
2. ECB Dovishness (Euro Weakness)
If the European Central Bank (ECB) signals or enacts rate cuts, this weakens the Euro.
For instance, recent soft Eurozone inflation or poor economic data may prompt ECB easing, lowering EUR/JPY.
3. BOJ Policy Normalization (JPY Strength)
If the Bank of Japan (BOJ) continues shifting away from ultra-loose monetary policy (e.g., exiting negative rates, allowing JGB yields to rise), this could strengthen the Yen.
Any hawkish surprise from the BOJ is typically JPY-positive.
4. Technical Setup
On the charts, if EUR/JPY is failing at resistance (e.g., near a long-term high or a fib retracement), or showing bearish divergence on RSI/MACD, it could signal a top.
A break below key support zones (e.g., 160.00 or 158.00) might accelerate downside momentum.
5. Positioning and Sentiment
If traders are heavily long EUR/JPY (crowded trade), a reversal or sharp correction is more likely if sentiment shifts.

What is a war chest and lessons we can learn from Blackstone...In case you haven't heard, NYSE:BX is hogging over $100 billion of dry powder that is ready for deployment at the snap of a finger. Now, just because we cant get our hands on hundreds of billions of dollars doesn't mean that we shouldn't have a war chest of our own.
Why a war chest is a must have
Firstly, having dry powder ready for the next trading day could be the determining factor of a make or break trade. Specifically think back to when the current market downturn started. If I had to guess, many of you reading were far too exposed to the market and got scared from the "red wave" that shocked the market heatmaps. I would also like to bet that many of you sold positions for a loss to stop the bleeding and are now looking for a better entry. However, consider what would have happened if you had spare cash on your side to keep your positions alive.
Here is an example of over exposure.
And here's an example of keeping about a 20% war chest by your side...
I understand that it seems like a small amount of money, but trading is a game of pennies and a winning position of pennies is much better than a losing position of $140. This is the same tactic that firms like Blackstone use to protect large positions from poisonous events such as this recent downturn in the market. So in order to make money like a bank, we need to learn to think like a bank...

Shorting Sui how Far Down Are We Going ? 3.3 -3.0 ? Here is my trade I just entered with stop loss and take profit zones 1 and 2. Let me know what you think
Kris/Mindbloome Exchange
Trade Smarter Live Better

XAUUSD (Gold)As we can see from overall perspective that Gold is still very bullish.
From technical and fundamental angle, everything sustains a bullish trend.
This is an opportunity to join the bullish trend.

XAUUSD is UncertainA few of high impact news tomorrow and it will determine if XAUUSD will continue its trend or break further correct itself tomorrow. If it breaks 3300, the probability it will drop further for correction is highly probable. If not then it will continue its trend to the upside.

Netflix - The bulls just never stop!Netflix - NASDAQ:NFLX - is insanely bullish now:
(click chart above to see the in depth analysis👆🏻)
The entire stock market basically collapsed during April. Meanwhile, Netflix is creating new all time highs with a +20% parabolic bullish candle. Looking at the chart, this strength is very likely to continue even more until Netflix will (again) retest the upper resistance trendline.
Levels to watch: $1.400
Keep your long term vision!
Philip (BasicTrading)

Cipher Mining (CIFR) – Accumulation Opportunity (1D Chart) Cipher Mining is bouncing from a well-defined historical demand zone (1.70-2.30) — a level that has consistently marked the start of powerful upside cycles.
📈 Technical Highlights:
✅ Major demand zone tested and respected — clear accumulation area
✅ MACD bullish crossover and histogram turning green
✅ RSI reversal from deep oversold — momentum shifting early
✅ Strong historical pattern: Each prior touch of this zone led to +100% moves
📈 Targets for Partial Profit-Taking:
✔️ TP1: $4.21
✔️ TP2: $5.29
✔️ TP3: $7.76+ (matches analyst avg. target of ~$7.84)
No hard stop — this is a mid- to long-term investment setup
🧠 Investor Context:
✅Analysts maintain a Strong Buy rating (avg PT: ~$8)
✅Cipher turned profitable in Q4 2024 and is expanding rapidly
✅Black Pearl (150MW) site goes live in Q2 → +70% hashrate growth
✅High exposure to Bitcoin upside, plus future HPC potential
✅Ideal setup for those building exposure to crypto infrastructure at cycle lows
📌 Note: Not a short-term trade. This is a high-conviction equity idea built on technical structure and strong fundamentals. Treat it as a long-hold with scaling opportunities.
We’ll provide updates on earnings, expansion news, and macro signals as this plays out. 🔒📊

ETHUSDT – Long Setup ETHUSDT – Weekly Structure + FVG + Fibonacci Confluence | Potential Long Setup
---
📌 Summary
Ethereum is showing signs of basing out after a prolonged downtrend, hovering near a high-timeframe fair value gap (FVG) zone. Weekly RSI is recovering from oversold territory, and the price is reacting around the 61.8% Fib retracement from the macro low to the 2021–22 highs. I'm watching for a potential long if price holds above $1,700 and pushes back toward the $2,000–2,200 supply zone.
---
🔍 Fundamentals Snapshot
While crypto is primarily sentiment-driven, ETH remains a core network token with strong utility, staking growth, and continued developer activity.
- Market Cap: ~$220B
- Narrative: Staking yield + DeFi backbone
- Risk: Macro pressure + Regulatory overhang
- Key On-Chain Trends: Supply contraction post-merge, L2 growth, ETH burn
---
📈 Technicals Overview
- **Trend**: Downtrend, but flattening; possible bottom structure
- **Fair Value Gap (FVG)**: Weekly FVG between ~$1,550 and ~$1,700 acting as support
- **Fibonacci**: Price reacting to the 61.8% retracement (~$1,800) from the 2020–21 run-up
- **RSI**: Near 40 on the weekly, bouncing from oversold levels
- **Moving Averages**: 8/21 EMAs compressed; momentum shift possible on crossover
- **Structure**: Possible bullish MSB (market structure break) if ETH closes above $1,900
- **Support/Resistance**:
- Support: $1,700, $1,550
- Resistance: $2,000, $2,200
---
🧠 Sentiment & Positioning
- Sentiment has been washed out post-liquidation cascade
- Open Interest flattening; some early long buildup visible
- Crypto Twitter showing cautious optimism, no euphoria (bullish)
---
Risk/Reward Snapshot
- **Entry**: On pullback toward $1,720–$1,760 or breakout above $1,900
- **Stop Loss**: Below $1,540 (weekly FVG invalidation)
- **Target 1**: $2,000
- **Target 2**: $2,200
- **R/R**: ~2.5 to 3.0 depending on entry
- **Position Size**: Scaled in across FVG zone with tighter risk at midpoint
---
📝 Final Thoughts
ETH is at a potential turning point structurally. The weekly FVG, Fib retracement, and improving RSI suggest a favorable risk/reward for swing longs. A confirmed weekly close above $1,900 would increase confidence in a trend reversal. Watching for confirmation via volume expansion and follow-through candles.
---

Key intervals and trend judgmentKey range and trend judgment:
The current gold price is in a narrow range of 3300-3305 support zone and 3325-3330 pressure zone. Technical analysis:
1. Support logic:
- 3300 is an integer psychological barrier, which coincides with the MA60 moving average (dynamic support) of the 1-hour chart;
- After hitting the bottom of 3300 several times recently, it rebounded and formed a short-term bottom structure.
2. Pressure logic:
- 3330 is the upper rail resistance of the Bollinger band on the 4-hour chart, and it is the previous high-intensive trading area;
- The top divergence signal appears at the MACD daily level, suppressing the upward space.
3. Volume characteristics: Shrinking volume oscillation, need to wait for breakthrough and large volume to confirm the direction.
Trading strategy and operation plan
1. Buy low and sell high within the range (short-term)
Long position strategy:
Entry point: 3300-3305 range (price retracement does not break, and 1-hour chart RSI <30), try long with a light position. Take profit target: 3315 (first target), 3325 (second target) Stop loss 3292 (break through the previous low support).
Short position strategy:
Entry point: 3325-3330 range (price touches pressure and falls back, 15-minute chart MACD dead cross), try short with a light position, take profit target: 3310 (first target), 3300 (second target); Stop loss: 3338 (break through the previous high pressure).
2. Follow the trend after the breakthrough (trend following) Upward breakthrough (stabilizing 3330): Pursue long signal: the price breaks through 3330 with large volume and then falls back without breaking, the target is 3350-3360 (previous high of the daily line);
Stop loss: 3320 (below the breakthrough point).
Downward break (falling below 3300): Pursue short signal: the price falls below 3300 and the pullback confirmation is invalid, the target is 3280-3260 (weekly MA20 support); Stop loss: 3310 (above the break point).
Pattern interpretation:
- The 4-hour chart converges in a symmetrical triangle, and the theoretical target after the breakthrough is the height of the triangle ; If it breaks upward, the target is 3350; if it breaks downward, the target is 3270.
Volume coordination: When breaking through, the trading volume needs to be enlarged by more than 20%, otherwise be alert to false breakthroughs.
Gold is in the stage of oscillating and choosing direction in the short term, and the strategy is mainly to sell high and buy low within the range + follow the breakthrough.

TESLA LONG- ACTIONBUY:
$260-$300
TAKE PROFIT:
$340-$350
Hold the position, don't make any changes until you see the results. Good luck!
