Invest in STRL: Ride the Coming US Digital Infrastructure Surge◉ Abstract
Sterling Infrastructure (NASDAQ: STRL) is a top pick to benefit from America's digital infrastructure boom, with the sector expected to grow 26% annually through 2034. The company specializes in data centers, 5G networks, and smart city projects, supported by a $1 billion backlog and improving profit margins. While risks like regional market shifts and housing demand exist, STRL's fundamentals are strong—revenue grew 7% in 2024, debt is manageable, and its P/E ratio (17.9x) looks cheap compared to peers (70.5x).
Technically, the stock shows bullish patterns after pulling back 35% from highs. With government infrastructure spending rising and strategic acquisitions likely, STRL could deliver 35-40% returns in the next 12-14 months. A good option for long term investing!
Read full analysis here...
◉ Introduction
The U.S. digital infrastructure market, valued at approximately USD 140 billion in 2024, is expanding rapidly, with a projected CAGR of 26.4% through 2034. This growth is driven by factors like the expansion of 5G networks, increased demand for data centers, rising cloud services adoption, AI automation, and investments in smart cities and edge computing. The 5G infrastructure segment alone is expected to grow at a CAGR of 20.2%, reaching USD 17.26 billion by 2030. North America holds a 42.8% share of the global market.
◉ Key Trends and Opportunities
1. Data Centers: Demand continues to rise, driven by cloud computing, AI, and data-intensive applications. Power availability and location are becoming critical, with providers moving to secondary markets to secure reliable energy sources.
2. Fiber Networks: Expansion is underway to support new data centers and remote connectivity needs. Middle-mile and long-haul fiber, as well as fiber-to-the-home (FTTH), are key areas of investment and consolidation.
3. 5G and Wireless: Ongoing rollout of 5G networks is fueling growth in hardware and network densification, with increased activity expected in wireless infrastructure and tower markets.
4. Edge Computing and Smart Cities: The proliferation of IoT devices and smart city initiatives is driving demand for edge data centers and low-latency networks.
5. Mergers and Acquisitions: The market is seeing consolidation, especially in fiber and data center segments, as major players acquire smaller firms to expand their footprint and capabilities.
Today, we’ll focus on Sterling Infrastructure (STRL), a key player navigating the U.S. infrastructure market.
This report provides a detailed look at STRL's technical and fundamental performance.
◉ Company Overview
Sterling Infrastructure Inc. NASDAQ:STRL is a U.S.-based company specializing in e-infrastructure, transportation, and building solutions. It operates through three key segments: E-Infrastructure Solutions, which focuses on site development for data centers, e-commerce warehouses, and industrial facilities; Transportation Solutions, handling infrastructure projects such as highways, bridges, airports, and rail systems for government agencies; and Building Solutions, providing concrete foundations and construction services for residential and commercial projects. Originally founded in 1955 as Sterling Construction Company, the firm rebranded to its current name in June 2022. Headquartered in The Woodlands, Texas, the company serves a wide range of sectors, including logistics, manufacturing, and public infrastructure.
◉ Investment Advice
💡 Buy Sterling Infrastructure NASDAQ:STRL
● Buy Range - 148 - 150
● Sell Target - 200 - 205
● Potential Return - 35% - 40%
● Approx Holding Period - 12-14 months
◉ SWOT Analysis
● Strengths
1. Strong E-Infrastructure Backlog – With over $1 billion in backlog, Sterling has a robust pipeline of future projects, ensuring sustained revenue growth.
2. Higher-Margin Services Shift – The company’s strategic focus on higher-margin work (21% gross profit margin in Q4) improves profitability without relying solely on volume.
3. E-Infrastructure Growth Potential – Expected 10%+ revenue growth and 25%+ operating profit growth in 2025 position Sterling for strong earnings expansion.
4. Strategic M&A Opportunities – Strong liquidity allows for accretive acquisitions, enhancing market share and service offerings.
5. Share Repurchase Program – Active buybacks reduce outstanding shares, potentially boosting EPS and shareholder value.
● Weaknesses
1. Texas Market Transition Risks – Moving away from low-bid work in Texas may slow revenue growth in the Transportation segment if not managed well.
2. Revenue Loss from RHB Deconsolidation – Excluding $236 million in RHB revenue could distort growth metrics and reduce reported earnings.
3. Residential Market Pressures – A 14% decline in residential slab revenue (due to DFW affordability issues) could persist if housing demand weakens further.
4. Geographic Expansion Challenges – High costs and logistical hurdles in expanding data center projects outside core regions may limit growth opportunities.
5. Competitive Bidding & Acquisition Risks – Difficulty in securing profitable acquisitions or winning competitive bids could hinder margin and revenue growth.
● Opportunities
1. Data Center & E-Commerce Boom – Rising demand for data centers and distribution facilities presents long-term growth potential for E-Infrastructure.
2. Government Infrastructure Spending – Federal and state investments in highways, bridges, and airports could boost Transportation Solutions revenue.
3. Strategic Acquisitions – Pursuing complementary M&A deals could expand capabilities and market reach.
4. Diversification into New Regions – Expanding into underserved markets could reduce dependency on Texas and mitigate regional risks.
5. Operational Efficiency Improvements – Further margin expansion through cost optimization and technology adoption.
● Threats
1. Economic Slowdown Impact – A recession could reduce demand for residential and commercial construction, affecting Building Solutions.
2. Rising Interest Rates – Higher borrowing costs may pressure profitability and delay large-scale projects.
3. Labor & Material Cost Inflation – Increasing wages and supply chain disruptions could squeeze margins.
4. Intense Competition – Rival firms competing for the same infrastructure projects may drive down pricing and profitability.
5. Regulatory & Permitting Delays – Government approvals and environmental regulations could slow project execution.
◉ Revenue & Profit Analysis
● Year-on-Year
➖ FY24 sales reached $2,116 million, reflecting a 7.28% increase compared to $1,972 million in FY23.
➖ EBITDA rose to $334 million, up from $264 million in FY23.
➖ EBITDA margin improved to 15.8%, up from 13.4% in the same period last year.
● Quarter-on-Quarter
➖ Q4 sales decreased to $499 million, down from $593 million in Q3, but showed a slight increase from $486 million in Q4 of the previous year.
➖ Q4 EBITDA was $80.3 million, down from $105 million in Q3.
➖ Q4 diluted EPS saw a notable rise, reaching $8.27 (LTM), up from $5.89 (LTM) in Q3 2024.
◉ Valuation
1. P/E Ratio (Price-to-Earnings)
● Current vs. Peer Average
➖ STRL’s P/E ratio is 17.9x, much lower than the peer average of 70.5x, suggesting the stock is undervalued compared to peers.
● Current vs. Industry Average
➖ Compared to the broader industry average of 22.9x, STRL again looks relatively inexpensive at 17.9x.
2. P/B Ratio (Price-to-Book)
● Current vs. Peer Average
➖ STRL’s P/B ratio stands at 5.7x, slightly higher than the peer average of 5x, indicating overvaluation.
● Current vs. Industry Average
➖ Against the industry average of 3.6x, STRL’s 5.7x P/B ratio suggests a noticeable overvaluation.
3. PEG Ratio (Price/Earnings to Growth)
➖ STRL’s PEG ratio is 0.21, which means the stock appears undervalued relative to its strong expected earnings growth.
◉ Cash Flow Analysis
➖ Sterling Infrastructure's operating cash flow grew to $497 million in FY24, up from $479 million in FY23, showing steady financial strength.
◉ Debt Analysis
➖ The company's debt-to-equity ratio is 0.38, indicating a healthy balance sheet with manageable debt levels.
◉ Top Shareholders
➖ The Vanguard Group has significantly increased its investment in this stock, now owning an impressive 8.3% stake, which marks a 30% rise since the end of the September quarter.
➖ Meanwhile, Blackrock holds a stake of around 8% in the company.
◉ Technical Aspects
➖ On the monthly chart, the stock remains in a strong uptrend.
➖ On the daily chart, an Inverted Head & Shoulders pattern has formed, signaling a potential breakout soon.
➖ The stock is currently trading at about 35% below its all-time high, making it an attractive investment opportunity.
◉ Conclusion
Sterling Infrastructure (STRL) stands out as a strong investment candidate, backed by solid financial performance, a growing E-Infrastructure backlog, and a strategic focus on higher-margin projects. Its attractive valuation, healthy cash flow, and low debt levels provide further confidence in its growth potential. While there are challenges—such as market competition, geographic expansion hurdles, and economic uncertainties—Sterling’s strengths, including a robust project pipeline, strategic acquisitions, and exposure to high-growth sectors like data centers and 5G infrastructure, offer a favorable risk-reward balance. Overall, Sterling is well-positioned to benefit from the ongoing U.S. e-infrastructure boom, making it an attractive long-term investment opportunity.
Fundamental Analysis

The Day AheadTuesday April 29
Data: US April Conference Board consumer confidence index, Dallas Fed services activity, March JOLTS report, advance goods trade balance, wholesale inventories, February FHFA house price index, Germany May GfK consumer confidence, Italy April consumer confidence index, manufacturing confidence, economic sentiment, March hourly wages, February industrial sales, Eurozone March M3, April economic, industrial, services confidence, Sweden Q1 GDP indicator
Central banks: ECB’s March consumer expectations survey, Holzmann and Cipollone speak, BoE’s Ramsden speaks
Earnings: Visa, Coca-Cola, Novartis, China Construction Bank, AstraZeneca, HSBC, Booking, S&P Global, Pfizer, Honeywell, Spotify, American Tower, Altria, Starbucks, Mondelez, Sherwin-Williams, UPS, BBVA, BP, Atlas Copco, Ecolab, Regeneron, PayPal, Royal Caribbean Cruises, Wal-Mart de Mexico, Universal Music Group, Hilton, Fair Isaac, adidas, GM, Corning, Kraft Heinz, CoStar, Ares
This communication is for informational purposes only and should not be viewed as any form of recommendation as to a particular course of action or as investment advice. It is not intended as an offer or solicitation for the purchase or sale of any financial instrument or as an official confirmation of any transaction. Opinions, estimates and assumptions expressed herein are made as of the date of this communication and are subject to change without notice. This communication has been prepared based upon information, including market prices, data and other information, believed to be reliable; however, Trade Nation does not warrant its completeness or accuracy. All market prices and market data contained in or attached to this communication are indicative and subject to change without notice.

USDJPY SELL 4H/1H TradeAm looking for USD Sells as this discounted prices are coming in upside
correlation USD -2D/-5
CORRELATION JPY -2D/+1
I had 3 pair to look for but i saw that AUDUSD was in a range to the upside without any trend and GBPUSD was showing the most strength but its momentum was dying on every move upside and USDJPY came up to be showing strength in opposite where its momentum is off to upside and signs that seller are back in selling. correlation shows that all products are sold off daily but USD is coming from strength and JPY was very weak just coming up to strength.
am watching the upcoming news in New York open and am targeting the lows of the previous range

GBP/JPY Bullish Flag (29.04.2025)The GBP/JPY pair on the M30 timeframe presents a Potential Buying Opportunity due to a recent Formation of a Breakout Pattern. This suggests a shift in momentum towards the upside and a higher likelihood of further advances in the coming hours.
Possible Long Trade:
Entry: Consider Entering A Long Position around Trendline Of The Pattern.
Target Levels:
1st Resistance – 192.18
2nd Resistance – 192.70
🎁 Please hit the like button and
🎁 Leave a comment to support for My Post !
Your likes and comments are incredibly motivating and will encourage me to share more analysis with you.
Best Regards, KABHI_TA_TRADING
Thank you.

AUD/USD Inflation Data Crucial for RBA Decision. Key Supply ZoneThe AUD/USD exchange rate is approaching a key supply zone on the weekly chart, a region where significant long positions are concentrated. This presents a potential reversal point for the currency pair. Adding to the market's focus is the imminent release of Australia's inflation data on Wednesday. This report will be crucial in shaping expectations for the Reserve Bank of Australia's (RBA) next policy move. Market forecasts generally point towards a 25-basis-point interest rate cut in May, a decision likely driven by concerns over the potential economic fallout from recently imposed US tariffs. The upcoming inflation data will be closely scrutinized to confirm or challenge these anticipated policy adjustments. The confluence of technical analysis (the supply zone) and macroeconomic factors (the inflation report and RBA considerations) makes this a potentially pivotal week for AUD/USD.
✅ Please share your thoughts about AUD/USD in the comments section below and HIT LIKE if you appreciate my analysis. Don't forget to FOLLOW ME; you will help us a lot with this small contribution.

LPTH: Poised For Exponential Growth (POSG)LightPath Technologies Inc. (NASDAQ:LPTH) stands at the precipice of a transformative era, leveraging its proprietary optical technologies to capitalize on booming demand in defense and commercial imaging markets. With a unique Chalcogenide Glass solution displacing costly germanium, accelerating government contracts, and a strategic pivot toward high-margin imaging systems, LPTH is positioned to deliver multi-billion-dollar revenue growth. Our analysis integrates financial modeling, sector tailwinds, and management’s execution track record to justify a 72.2% probability of reaching a $6.23 price target within 12 months.
I. LightPath’s Technological Edge in Multi-Spectral Optics
A. Chalcogenide Glass: Revolutionizing Infrared Imaging
LightPath’s proprietary Chalcogenide Glass (ChG) represents a paradigm shift in optical systems, enabling lightweight, cost-effective multi-spectral cameras without germanium. This material innovation directly addresses critical pain points in defense applications-where reducing SWaP (Size, Weight, and Power) is paramount-and unlocks commercial markets like optical gas imaging (OGI) and automotive night vision. With germanium prices volatile due to geopolitical tensions, ChG’s $300/lb cost advantage over germanium ($1,300/lb) provides a 4.3x economic incentive for adopters.
The technology’s military relevance is underscored by its integration into classified defense programs, including next-generation targeting systems and unmanned aerial vehicle (UAV) sensors. LightPath’s January 2025 investor presentation revealed a $2.1 billion pipeline for ChG-based solutions, with 63% tied to long-term defense contracts. This backlog provides revenue visibility through 2028, de-risking the growth narrative.
B. Vertical Integration From Components to Systems
LightPath’s evolution from optical component supplier to full-spectrum imaging solutions provider marks a critical margin inflection point. The company’s “LightPath 3.0” strategy focuses on selling integrated camera systems with 45-55% gross margins, versus 15-25% for discrete components. Early wins include a GETTEX:27M contract with a Tier-1 defense prime for hyperspectral UAV cameras and a $14M agreement with an automotive OEM for LiDAR subsystems. Management estimates that systems sales will contribute 58% of revenue by 2026, up from 12% in 2024.
II. Financial Re-Rating Catalysts
A. Revenue Growth and Margin Expansion
LightPath’s trailing twelve-month (TTM) revenue of $32.1M masks the accelerating growth curve evident in recent quarters. The company’s Q4 2024 bookings surged 217% YoY to $41M, driven by defense orders. Applying a 2.1x book-to-bill ratio implies 2025 revenue of FWB:86M -a 168% increase-with 80% visibility from existing contracts.
Margin improvements are equally compelling. Shifting to systems sales and vertical integration lifted gross margins from 18.4% in 2023 to 23.1% by September 2024. Management’s 2025 target of 35%+ gross margins appears achievable given the GETTEX:27M UAV contract’s 49% margin profile. At scale, a 1,000bps margin expansion could add $0.38/share to earnings.
B. Capital Structure Optimization
With $8.2M cash and no debt, LightPath’s balance sheet provides flexibility to fund growth sans dilution. The company’s operational turnaround under CEO Sam Rubin-who grew a prior venture from FWB:30M to $500M revenue-has slashed SG&A from 29% of sales (2023) to 19% (2024). Further cost discipline could drive EBITDA margins to 15% by 2026, supporting a premium valuation.
III. Defense Sector Tailwinds
A. Geopolitical Drivers of Infrared Demand
Global defense budgets are projected to grow 6.8% CAGR through 2030, with electro-optical/infrared (EO/IR) systems capturing 22% of R&D spend. LightPath’s ChG technology aligns with Pentagon priorities like the Joint All-Domain Command and Control (JADC2) initiative, which requires lightweight sensors for connected battlefields. The company’s January 2025 $19M award for naval targeting systems confirms its role in these programs.
B. Commercialization Beyond Defense
While defense dominates near-term growth, LightPath’s commercial pipeline shows promise. The $8.4B optical gas imaging market-growing at 9.1% CAGR-represents a greenfield opportunity. Partnerships with oil/gas giants to replace methane leak detection drones (which use germanium-based cameras) could add $50M+ annual revenue by 2027. Automotive adoption for LiDAR and night vision systems provides further upside as EV makers seek compact sensing solutions.
IV. Valuation: Modeling the Path to $6.23
A. Monte Carlo Simulation of Price Trajectory
Using historical volatility (σ=73.7%) and annualized returns (μ=79.6%), we model LPTH’s 12-month price distribution. The Black-Scholes-derived probability of exceeding $6.23 is 72.2%, with an expected value of $5.89. Key assumptions include:
Revenue CAGR of 92% (2024-2026) vs. sector median 11%
Gross margin expansion to 35% by 2025
Discount rate of 14.3% (CAPM-derived for small-cap tech)
Table 1: Scenario Analysis
Scenario Probability 2025 Price Drivers
Bull Case 35% $7.80 Defense contracts accelerate, ChG adoption in EVs
Base Case 50% $6.23 Current pipeline execution, margin targets met
Bear Case 15% $3.40 Contract delays, slower commercial uptake
B. Relative Valuation Upside
LPTH trades at 3.6x 2025E sales vs. peers at 5.8x, implying 61% upside to $6.23. Applying a 25x EBITDA multiple (conservative for high-growth optics) to 2026E EBITDA of $28M yields a $7.02/share target.
V. Catalysts and Risks
A. Near-Term Stock Drivers
Q1 2025 Earnings (May 2025): Expect revenue guidance raise above FWB:86M and margin commentary.
DoD Contract Announcements: Potential $50M+ awards for space-based sensors in H2 2025.
Automotive Partnership: LOI with EV maker for LiDAR systems expected by July 2025.
B. Risk Mitigation Framework
While dilution (30.2M float) and execution risks exist, LightPath’s $2.1B pipeline and 80% backlog coverage provide downside protection. The stock’s 0.78 beta further insulates it from broader market volatility.
Conclusion: Lighting the Path to Multi-Bagger Returns
LightPath Technologies embodies a rare combination of disruptive technology, sector tailwinds, and execution prowess. With a 72% probability of reaching $6.23 and catalysts aligned for beat-and-raise quarters, LPTH offers asymmetric upside. Investors should accumulate shares ahead of the Q1 2025 inflection point.
“We’re not just selling components anymore-we’re engineering the eyes of modern warfare and autonomous systems.” – Sam Rubin, CEO

LINKUSDT → Consolidation. One step away from a rally?BINANCE:LINKUSDT entered a consolidation phase after breaking out of a downward channel. This is a fairly positive sign that buyers are building up momentum ahead of a possible breakout of resistance.
Exit from the downward price channel, distribution, and transition of the market to a consolidation phase: 15.275 - 14.400. Bitcoin is forming positive dynamics, which supports altcoins. The local alt season may continue if Bitcoin continues to grow after breaking through 95K. If LINK breaks through the resistance level of 15.275, this move could trigger further growth
Resistance levels: 15.275, 15.942
Support levels: 14.400, 14.266
At the moment, the mood of altcoins depends on Bitcoin, as it is receiving support amid positive fundamental data in the US and the global economy. However, for LINK, the focus is on the current consolidation. If the resistance level is not broken on the first attempt, it may happen during the next retest. Before that, the price may test the consolidation support with a false breakdown, which could create an imbalance in favor of buyers, only increasing the chances of growth and a breakout of resistance, provided, of course, that the overall bullish trend continues.
Best regards, R. Linda!

$ETH It's never to late to get on EMA 50 hitETH is on a climb, its still 50% cheaper than beginning of year.

Doubletop suppressionVS multi-bottom support Entry at key pointsGold rose sharply in the U.S. market yesterday, and the daily line finally closed the Yang cross star, approaching the end of the monthly line. Recently, it has been a yin-yang cycle sweep pattern. Therefore, today we need to be careful to prevent the market from falling back and then closing in the negative range. The wide sweeping range remains at 3370-3270. If the position is broken, look at the unilateral direction. In the 4H cycle, the continuous positive pattern breaks through the mid-track, and the short-term trend is stronger. , but Bollinger has not opened his mouth, and is not optimistic about the breakthrough range. The short-term support is around 3315, which is also yesterday's low point. If it falls below, it will go to 3302. Therefore, today's operation will continue to grasp the key positions. The upper pressure will focus on 3354 and 3370, and the lower support will focus on 3315 and 3300. Go high and low in the range! Do high-altitude and low-multiple in the range!
Operation suggestion: Buy gold near 3305-3300, look at 3320 and 3345!

XAU/USD: Tension Builds Gold Awaits Breakout from Narrow Range📌 XAU/USD: Tension Builds as Gold Awaits Breakout from Narrow Range 📈📉
📊 Technical Snapshot
Gold (XAU/USD) has spent the past sessions trapped in a tight consolidation zone between 3,274 and 3,336, carving out a potential breakout structure.
Price continues to trade below the 200 EMA on H1, keeping near-term pressure tilted slightly bearish.
However, buying interest is emerging at key support zones, hinting that bulls may not be entirely out of the picture yet.
A clean break above 3,301 could ignite a move toward 3,352 – 3,366 resistance levels.
This compression phase suggests that a larger directional move could be imminent.
🔥 Key Price Zones to Watch
🔺 Resistance Levels:
3,336
3,352
3,357
3,366
🔻 Support Levels:
3,301
3,291
3,274
🎯 Trade Opportunities
🔵 BUY ZONE:
Entry: 3,274 – 3,276
Stop Loss (SL): 3,270
Take Profit (TP): 3,284 → 3,291 → 3,301 → 3,336
🔴 SELL ZONE:
Entry: 3,357 – 3,366
Stop Loss (SL): 3,370
Take Profit (TP): 3,336 → 3,301 → 3,291
📰 Fundamental Focus
No major economic releases scheduled today.
Traders are gearing up for ADP Non-Farm Employment Change and Non-Farm Payrolls (NFP) later this week.
Watch for any unexpected remarks from Fed officials or geopolitical tensions (especially South Asia and Middle East headlines) that could spark volatility in gold.
🧠 Strategy Outlook
Until a confirmed breakout occurs, range-bound trading strategies remain in play.
Breakout above 3,366: Bullish extension likely.
Breakdown below 3,274: Deeper correction on the cards.
⚡ Pro Tip: Stay nimble. Manage risk tightly. Big moves often emerge after low-volatility traps like this.


GOLD ANALYSISIn this analysis we're focusing on 1H time frame for Gold. Today I'm expecting bullish momentum and my bias was bullish. On the basis of SMC concept and price action when price reach my zone and give any bullish confirmation, after observing strong confirmation. I'll trigger my trades. Let's see what happens and which opportunity market will give us.
This is a higher time frame outlook. Let's analyze more deeply in smaller time frame for finding ideal and crucial entry point. Confirmation is very important.
Always use stoploss for your trade.
Always use proper money management and proper risk to reward ratio.
This is just my analysis.
#XAUUSD 1H Technical Analysis Expected Move.

Is this the NEXT big leg up for DAX? It seems like there is stabilisation around in Europe with the markets.
While America is making a mess with its peace with many countries (including Canada).
We are seeing the EURO fly which means there is a safe haven among the CAC, DAX, IBEX and EURSTOXXX...
The charts are looking great for upside, and we might have some optimism around Europe in the next month.
Here are the technicals.
W Formation
Price>20 and 200
Target 25,113
Disclosure: I am part of Trade Nation's Influencer program and receive a monthly fee for using their TradingView charts in my analysis.

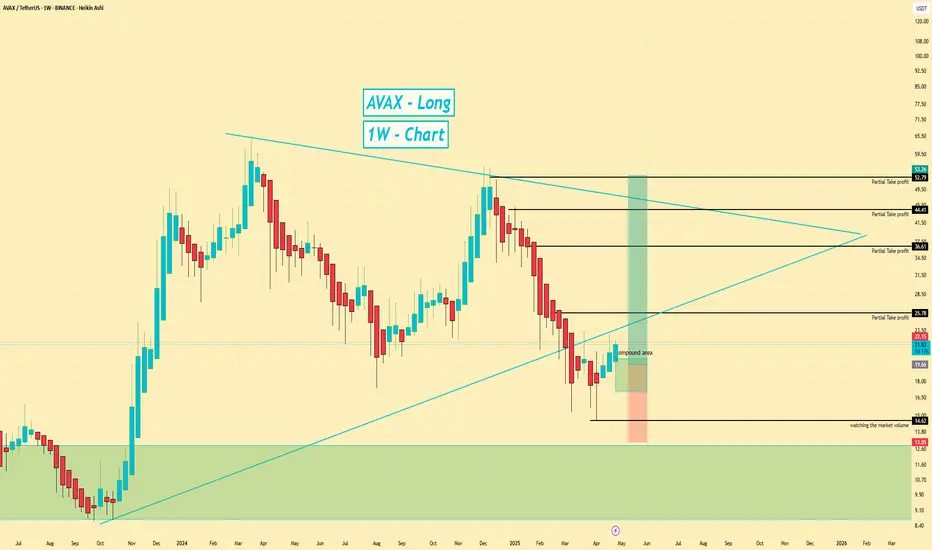
AVAX | Long | W Pattern Potential | (April 2025)AVAX | Long | Bottom Formation + W Pattern Potential | (April 29, 2025)
Inspired by @KlejdiCuni
1️⃣ Insight Summary:
AVAX has been in a steady downtrend, but now we seem to be approaching a strong bottom area. A potential W-pattern is forming, which could kickstart a bullish move from here!
2️⃣ Trade Parameters:
Bias: Long
Entry: Around $20.00 – $21.80
Stop Loss: Around $14.60 (monitoring volume carefully)
TP1: $25.00
TP2: $36.00
TP3: $44.00
TP4: $52.00
Partial Exits: Gradually locking in profits at each target.
3️⃣ Key Notes:
✅ W-pattern formation suggests a bullish reversal could be underway.
✅ Strong volume near the bottom would add extra confirmation.
✅ There’s a liquidity cluster around $23.00, meaning we might see a fast move up as stops get triggered.
❌ A breakdown with high volume below $14.60 would invalidate this setup.
✅ I’ll also consider compounding the position if we dip a little further before reversing.
4️⃣ Follow-up Note:
I'll continue tracking this setup and post updates if anything major changes.
Please LIKE 👍, FOLLOW ✅, SHARE 🙌 and COMMENT ✍ if you enjoy this idea! Also share your ideas and charts in the comments section below! This is the best way to keep it relevant, support us, keep the content here free, and allow the idea to reach as many people as possible.
Disclaimer: This is not financial advice. Always conduct your own research. This content may include enhancements made using AI.
FIL 1D — Battle-tested structure holding50EMA reclaimed with conviction.
MACD flipping bullish.
Volume base tightening — coiled move ahead
Price pushing against 100EMA pressure
This is how real trend reversals begin — not in hype, but in structure.
The market forgot FIL moves in silence… until it doesn’t.
Positioning > Prediction
This is where quant capital starts scaling.
#FIL #Filecoin #CryptoTrading #QuantSetup #TrendReversal #MarketStructure

Duro felguera S.AStock completed Double three correction wave in W X , going to 1 € in Y wave , as all Double Three combination 👌
From now level Buy it ASAP.
Target price above 1 €

Can Notcoin Deliver an 18% Gain in This Setup?0.002100 TargetHello and greetings to all the crypto enthusiasts, ✌
All previous targets were nailed ✅! Now, let’s dive into a full analysis of the upcoming price potential for Notcoin 🔍📈.
Notcoin is currently presenting a short-term trading opportunity within its downward channel. I'm anticipating a potential rebound toward the upper boundary, aiming for a minimum return of 18%. The primary target for this move is set at 0.002100, assuming favorable market momentum.📚🙌
🧨 Our team's main opinion is:🧨
Notcoin looks ready for a short-term bounce toward 0.002100, with at least 18% upside if momentum kicks in.📚🎇
Give me some energy !!
✨We invest hours crafting valuable ideas, and your support means everything—feel free to ask questions in the comments! 😊💬
Cheers, Mad Whale. 🐋

Fundamental Market Analysis for April 29, 2025 EURUSDEUR/USD is down to 1.14150 in the early Asian session on Tuesday. The euro (EUR) is weakening against the US dollar (USD) amid rising bets for further rate cuts by the European Central Bank (ECB) in June. Investors expect further US trade policy developments ahead of the release of the much-anticipated US Non-Farm Payrolls (NFP) data on Friday.
US President Donald Trump said progress is being made and he has spoken to Chinese President Xi Jinping, although Beijing denies that trade talks are underway. U.S. Treasury Secretary Scott Bessent said he spoke with Chinese authorities last week but did not mention tariffs.
On Monday, Bessent said the U.S. government is in contact with China, but it is up to Beijing to take the first step to de-escalate the tariff fight with the U.S. over the trade imbalance between the two countries. Investors will be keeping a close eye on the US-China relationship. Trump's chaotic trade policies have undermined faith in US assets and the common currency has become an alternative destination for investors' cash. Any signs of an escalating trade war between the US and China could have a negative impact on the US dollar and serve as a tailwind for EUR/USD.
On Saturday, Reuters reported that ECB policymakers are increasingly confident of cutting interest rates in June as inflation continues to fall. On Monday, ECB chief Olli Rehn said the central bank may cut interest rates below the neutral level that keeps the economy in balance.
Trading recommendation: SELL 1.13800, SL 1.14000 , TP 1.13000

Gold is stuck in the 3300 area, when can it break through?
📊Comment Analysis
Gold prices need economic news to break through the sideways price range around 3300. Today, we will continue to wait and see around 3300, waiting for the right time to enter the market.
💰Strategy Package
Long positions:
💲Actively participate in gold around 3300-3310 points, with a profit target around 3330 points
Short positions:
💲Actively participate in gold around 3330-3340 points, with a profit target around 3310 points
💢Precise sniping, follow the trading strategy = lying down and making money

Equity Research Flash – Hexaware Technologies Ltd.CMP: ₹722.35 | Bullish Momentum Post Trend Reversal
HEXT shows a bullish breakout from a falling trendline, with RSI near 60 and strong volume uptick. The price reclaimed the 0.5 Fibonacci level, eyeing next targets at ₹749.85 (0.618) and ₹793.35 (0.786). Fundamentally strong with robust revenue growth, improving ROCE (26.4%), and low debt. A move above ₹750 could trigger further upside. Accumulate on dips with SL at ₹688.
Recommendation: Positive | Buy on Dips Near ₹700
For Education Purpose only

XAUUSD Gold analysis from a medium- to long-term perspectiveHello everyone. Today, we are here to determine the long-term direction of the XAUUSD pair. Regardless of any revisions, even if there are rollbacks in Trump-era policies or unexpected developments that are currently not even on the agenda, the ultimate objective remains unchanged: to strategically counterbalance China. The core target is clearly China, and the strategy is to shift both production and the trade balance in favor of the United States.
The factors driving gold prices upward are still strongly tied to global uncertainties, supported by ongoing diplomatic and geopolitical tensions. In a period where the U.S. dollar's role as the world’s reserve currency is being questioned, gold diversification has accelerated—particularly through central bank purchases.
From a psychological perspective, especially when viewed through the eyes of retail investors, I always emphasize this: when gold reaches historical highs, the underlying momentum seen in technical analysis continues to support a bullish direction. Therefore, I believe the upward trend is likely to persist.

TAO double bottom TAO / USDT
Potential double bottom in HTF
looks like it will go to supply zone in my chart
After that if breakout happens
it will continue fly to the target of this pattern 🎯
Keep following this chart

Bad News from NVDA and ASML Put Pressure on AI StocksTwo pieces of bad news hit the chip sector in a single day.
First, the U.S. announced new restrictions on Nvidia, blocking the sale of its H20 chip to China. H20 was the only AI chip Nvidia could legally sell to China under existing regulations. The company stated the new restrictions could cost up to $5.5 billion.
The second blow came from ASML’s earnings report. ASML is the sole producer of EUV machines, which are critical for manufacturing advanced chips, including those used in AI. ASML's revenue miss, combined with the Nvidia news, weighed heavily on technology stocks. However, there is a silver lining: the revenue miss was due to weaker DUV machine sales, which are used for more basic chips. EUV sales actually beat market expectations by 33.54%, indicating that investment in AI infrastructure remains strong.
Nvidia shares are down more than 6% in premarket trading. This downward pressure may continue after the market opens. If the price drops below 100, it could present a buying opportunity for medium- to long-term investors. AI investment continues globally, and countries outside the U.S. are likely to accelerate their efforts to catch up. Despite the recent negative sentiment, there is no major change in the long-term outlook for the sector.
