Is this the NEXT big leg up for DAX? It seems like there is stabilisation around in Europe with the markets.
While America is making a mess with its peace with many countries (including Canada).
We are seeing the EURO fly which means there is a safe haven among the CAC, DAX, IBEX and EURSTOXXX...
The charts are looking great for upside, and we might have some optimism around Europe in the next month.
Here are the technicals.
W Formation
Price>20 and 200
Target 25,113
Disclosure: I am part of Trade Nation's Influencer program and receive a monthly fee for using their TradingView charts in my analysis.
Fundamental Analysis

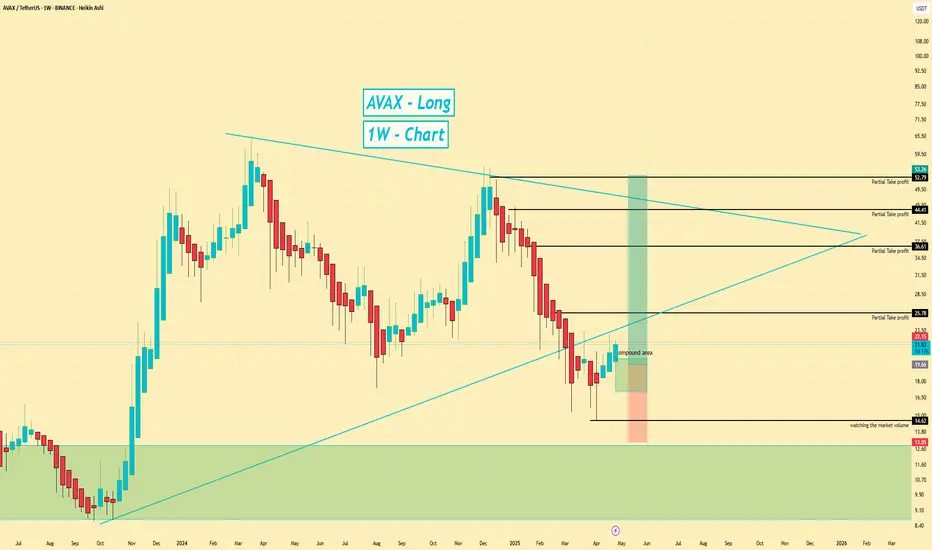
AVAX | Long | W Pattern Potential | (April 2025)AVAX | Long | Bottom Formation + W Pattern Potential | (April 29, 2025)
Inspired by @KlejdiCuni
1️⃣ Insight Summary:
AVAX has been in a steady downtrend, but now we seem to be approaching a strong bottom area. A potential W-pattern is forming, which could kickstart a bullish move from here!
2️⃣ Trade Parameters:
Bias: Long
Entry: Around $20.00 – $21.80
Stop Loss: Around $14.60 (monitoring volume carefully)
TP1: $25.00
TP2: $36.00
TP3: $44.00
TP4: $52.00
Partial Exits: Gradually locking in profits at each target.
3️⃣ Key Notes:
✅ W-pattern formation suggests a bullish reversal could be underway.
✅ Strong volume near the bottom would add extra confirmation.
✅ There’s a liquidity cluster around $23.00, meaning we might see a fast move up as stops get triggered.
❌ A breakdown with high volume below $14.60 would invalidate this setup.
✅ I’ll also consider compounding the position if we dip a little further before reversing.
4️⃣ Follow-up Note:
I'll continue tracking this setup and post updates if anything major changes.
Please LIKE 👍, FOLLOW ✅, SHARE 🙌 and COMMENT ✍ if you enjoy this idea! Also share your ideas and charts in the comments section below! This is the best way to keep it relevant, support us, keep the content here free, and allow the idea to reach as many people as possible.
Disclaimer: This is not financial advice. Always conduct your own research. This content may include enhancements made using AI.
FIL 1D — Battle-tested structure holding50EMA reclaimed with conviction.
MACD flipping bullish.
Volume base tightening — coiled move ahead
Price pushing against 100EMA pressure
This is how real trend reversals begin — not in hype, but in structure.
The market forgot FIL moves in silence… until it doesn’t.
Positioning > Prediction
This is where quant capital starts scaling.
#FIL #Filecoin #CryptoTrading #QuantSetup #TrendReversal #MarketStructure

Duro felguera S.AStock completed Double three correction wave in W X , going to 1 € in Y wave , as all Double Three combination 👌
From now level Buy it ASAP.
Target price above 1 €

Can Notcoin Deliver an 18% Gain in This Setup?0.002100 TargetHello and greetings to all the crypto enthusiasts, ✌
All previous targets were nailed ✅! Now, let’s dive into a full analysis of the upcoming price potential for Notcoin 🔍📈.
Notcoin is currently presenting a short-term trading opportunity within its downward channel. I'm anticipating a potential rebound toward the upper boundary, aiming for a minimum return of 18%. The primary target for this move is set at 0.002100, assuming favorable market momentum.📚🙌
🧨 Our team's main opinion is:🧨
Notcoin looks ready for a short-term bounce toward 0.002100, with at least 18% upside if momentum kicks in.📚🎇
Give me some energy !!
✨We invest hours crafting valuable ideas, and your support means everything—feel free to ask questions in the comments! 😊💬
Cheers, Mad Whale. 🐋

Fundamental Market Analysis for April 29, 2025 EURUSDEUR/USD is down to 1.14150 in the early Asian session on Tuesday. The euro (EUR) is weakening against the US dollar (USD) amid rising bets for further rate cuts by the European Central Bank (ECB) in June. Investors expect further US trade policy developments ahead of the release of the much-anticipated US Non-Farm Payrolls (NFP) data on Friday.
US President Donald Trump said progress is being made and he has spoken to Chinese President Xi Jinping, although Beijing denies that trade talks are underway. U.S. Treasury Secretary Scott Bessent said he spoke with Chinese authorities last week but did not mention tariffs.
On Monday, Bessent said the U.S. government is in contact with China, but it is up to Beijing to take the first step to de-escalate the tariff fight with the U.S. over the trade imbalance between the two countries. Investors will be keeping a close eye on the US-China relationship. Trump's chaotic trade policies have undermined faith in US assets and the common currency has become an alternative destination for investors' cash. Any signs of an escalating trade war between the US and China could have a negative impact on the US dollar and serve as a tailwind for EUR/USD.
On Saturday, Reuters reported that ECB policymakers are increasingly confident of cutting interest rates in June as inflation continues to fall. On Monday, ECB chief Olli Rehn said the central bank may cut interest rates below the neutral level that keeps the economy in balance.
Trading recommendation: SELL 1.13800, SL 1.14000 , TP 1.13000

Gold is stuck in the 3300 area, when can it break through?
📊Comment Analysis
Gold prices need economic news to break through the sideways price range around 3300. Today, we will continue to wait and see around 3300, waiting for the right time to enter the market.
💰Strategy Package
Long positions:
💲Actively participate in gold around 3300-3310 points, with a profit target around 3330 points
Short positions:
💲Actively participate in gold around 3330-3340 points, with a profit target around 3310 points
💢Precise sniping, follow the trading strategy = lying down and making money

Equity Research Flash – Hexaware Technologies Ltd.CMP: ₹722.35 | Bullish Momentum Post Trend Reversal
HEXT shows a bullish breakout from a falling trendline, with RSI near 60 and strong volume uptick. The price reclaimed the 0.5 Fibonacci level, eyeing next targets at ₹749.85 (0.618) and ₹793.35 (0.786). Fundamentally strong with robust revenue growth, improving ROCE (26.4%), and low debt. A move above ₹750 could trigger further upside. Accumulate on dips with SL at ₹688.
Recommendation: Positive | Buy on Dips Near ₹700
For Education Purpose only

XAUUSD Gold analysis from a medium- to long-term perspectiveHello everyone. Today, we are here to determine the long-term direction of the XAUUSD pair. Regardless of any revisions, even if there are rollbacks in Trump-era policies or unexpected developments that are currently not even on the agenda, the ultimate objective remains unchanged: to strategically counterbalance China. The core target is clearly China, and the strategy is to shift both production and the trade balance in favor of the United States.
The factors driving gold prices upward are still strongly tied to global uncertainties, supported by ongoing diplomatic and geopolitical tensions. In a period where the U.S. dollar's role as the world’s reserve currency is being questioned, gold diversification has accelerated—particularly through central bank purchases.
From a psychological perspective, especially when viewed through the eyes of retail investors, I always emphasize this: when gold reaches historical highs, the underlying momentum seen in technical analysis continues to support a bullish direction. Therefore, I believe the upward trend is likely to persist.

TAO double bottom TAO / USDT
Potential double bottom in HTF
looks like it will go to supply zone in my chart
After that if breakout happens
it will continue fly to the target of this pattern 🎯
Keep following this chart

Bad News from NVDA and ASML Put Pressure on AI StocksTwo pieces of bad news hit the chip sector in a single day.
First, the U.S. announced new restrictions on Nvidia, blocking the sale of its H20 chip to China. H20 was the only AI chip Nvidia could legally sell to China under existing regulations. The company stated the new restrictions could cost up to $5.5 billion.
The second blow came from ASML’s earnings report. ASML is the sole producer of EUV machines, which are critical for manufacturing advanced chips, including those used in AI. ASML's revenue miss, combined with the Nvidia news, weighed heavily on technology stocks. However, there is a silver lining: the revenue miss was due to weaker DUV machine sales, which are used for more basic chips. EUV sales actually beat market expectations by 33.54%, indicating that investment in AI infrastructure remains strong.
Nvidia shares are down more than 6% in premarket trading. This downward pressure may continue after the market opens. If the price drops below 100, it could present a buying opportunity for medium- to long-term investors. AI investment continues globally, and countries outside the U.S. are likely to accelerate their efforts to catch up. Despite the recent negative sentiment, there is no major change in the long-term outlook for the sector.

Google Ruling Could Be Very Bullish for TTDA U.S. judge has found Google guilty of illegally monopolizing the digital advertising technology markets. The monopolization of both the demand and supply sides has been a long-standing concern for the rest of the digital advertising sector.
This ruling may significantly benefit The Trade Desk (TTD), as it operates as an independent demand-side platform. The digital advertising market is projected to exceed $600 billion in 2025, and Google currently believed to be controls nearly 30% of that. Even a 5% slip in Google’s market share, with TTD capturing just 10% of that shift, could nearly double TTD's revenue. As a result, this ruling is can be considered very bullish for TTD, both in the medium and long term.
Technically, TTD recently tested the $40 level, a key support that has held since Q4 of 2020, indicating the stock is currently in a strong demand zone. With this news, the likelihood of that support holding and a bullish reversal increases.
Analyst consensus reflects an 85.8% upside potential. If the bullish scenario plays out, the horizontal level at $60 and the 200-day moving average could serve as key medium-term targets. From current levels to the 200-day SMA, the potential return is close to 50%.

XAU and how i'd trade this guylast week was horrible for buyer, i reckong it will follow its momentum and attack that weekly low i marked down there, otherwise that high still got some chance to be wrecked. Be flexible.

Gold Nears Key Decision Points in Short-Term TrendGold pulled back after testing the 3500 level. A reversal in rhetoric from former President Trump regarding China, along with some breathing room provided by Powell, eased market tensions. Reports indicate that meetings with executives from NYSE:TGT , NYSE:HD , and NYSE:WMT influenced Trump to reconsider his ultra-aggressive stance, as he recognized the imminent risks of inflation and potential supply chain disruptions that could begin within weeks. Additionally, rare earths could become a significant problem if a deal with China isn’t reached soon.
The 3500 level may now act as a major long-term top—provided the situation doesn't deteriorate further. Long-term topping signals for gold had already started to emerge; please refer to our earlier post for more details:
Short-Term Outlook
On the 15-minute chart, the downtrend has been broken. While geopolitical risks, particularly involving Ukraine and Russia remain elevated, gold may attempt to recover some lost ground. If the current corrective uptrend holds and 3350 is broken, a move toward slightly above 3400 could begin. However, if gold drops below 3325, there is a risk of another round of profit-taking and renewed selling pressure.

GBPUSD Analysis Today: Technical and Order Flow !In this video I will be sharing my GBPUSD analysis today, by providing my complete technical and order flow analysis, so you can watch it to possibly improve your forex trading skillset. The video is structured in 3 parts, first I will be performing my complete technical analysis, then I will be moving to the COT data analysis, so how the big payers in market are moving their orders, and to do this I will be using my customized proprietary software and then I will be putting together these two different types of analysis.

Market insight....XAUUSD.Bitcoin,EURUSDMarket Update: April 29, 2025
Gold (XAU/USD)
Gold is $3,330/oz, up ~0.5% on Monday from bargain-hunting. Selling appears limited despite last week’s rally to a record ~$3,500. Support is $3,300, resistance near $3,400–$3,500. U.S.-China trade uncertainty and Fed policy risk underpin demand, suggesting gold may hold above key support in the near term.
Bitcoin (BTC/USD)
Bitcoin is $93k–$95k, buoyed by bullish technicals. It trades above its 50-day moving average with RSI positive. Bulls briefly ran price to ~$95.3k, so resistance is near $94–$95k. Support lies around $92.8k (next at ~$90.0k). Sentiment is cautiously optimistic: a sustained break above $95k could spark new highs, while a slide below support would signal a deeper pullback.
EUR/USD
EUR/USD is around 1.14 after a weaker dollar on trade-war fears. Reuters noted EUR/USD at $1.1419 on Monday. The euro is ~10% stronger since early March. Near-term resistance is about 1.15 (multi-year highs), with support near 1.13–1.12. Investors await key U.S. data and Fed cues; continued dollar softness may lift EUR toward 1.15, while stronger U.S. data could cap further gains.

EURUSD I Weekly CLS I KL - OB, Model 1 target - 50% AMD in playHey, Market Warriors, here is another outlook on this instrument
If you’ve been following me, you already know every setup you see is built around a CLS range, a Key Level, Liquidity and a specific execution model.
If you haven't followed me yet, start now.
My trading system is completely mechanical — designed to remove emotions, opinions, and impulsive decisions. No messy diagonal lines. No random drawings. Just clarity, structure, and execution.
🧩 What is CLS?
CLS is real smart money — the combined power of major investment banks and central banks moving over 6.5 trillion dollars a day. Understanding their operations is key to markets.
✅ Understanding the behaviour of CLS allows you to position yourself with the giants during the market manipulations — leading to buying lows and selling highs - cleaner entries, clearer exits, and consistent profits.
🛡️ Models 1 and 2:
From my posts, you can learn two core execution models.
They are the backbone of how I trade and how my students are trained.
📍 Model 1
is right after the manipulation of the CLS candle when CIOD occurs, and we are targeting 50% of the CLS range. H4 CLS ranges supported by HTF go straight to the opposing range.
📍 Model 2
occurs in the specific market sequence when CLS smart money needs to re-accumulate more positions, and we are looking to find a key level around 61.8 fib retracement and target the opposing side of the range.
👍 Hit like if you find this analysis helpful, and don't hesitate to comment with your opinions, charts or any questions.
⚔️ Listen Carefully:
Analysis is not trading. Right now, this platform is full of gurus" trying to sell you dreams based on analysis with arrows while they don't even have the skill to trade themselves.
If you’re ever thinking about buying a Trading Course or Signals from anyone. Always demand a verified track record. It takes less than five minutes to connect 3rd third-party verification tool and link to the widget to his signature.
"Adapt what is useful, reject what is useless, and add what is specifically your own."
— David Perk aka Dave FX Hunter ⚔️

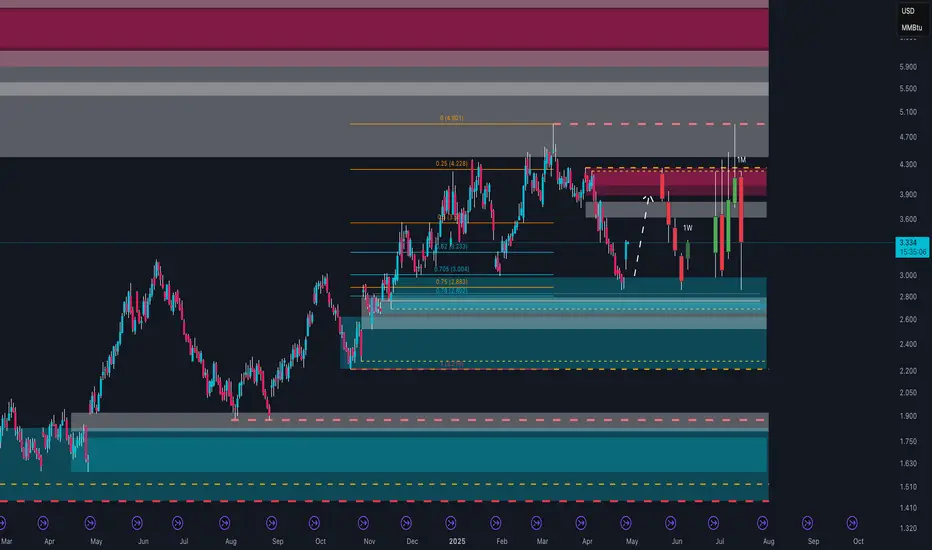
Natural Gas Ready to Explode?In recent months, Natural Gas (NG1!) has shown significant volatility, but now there are clear signals suggesting a major directional move could be imminent.
On the weekly technical chart, price has bounced from a strong demand zone between 2.50 and 2.70 USD/MMBtu, an area historically defended by institutional players. Currently, it is trading above 3.30 USD, consolidating in preparation for the next move. Key resistance zones to watch are between 3.90 and 4.20 USD, a region of high volume confluence and institutional supply.
Retail sentiment is extremely interesting: over 75% of retail traders are currently long. Historically, an excess of retail longs often leads to either corrections or accumulation/distribution phases, as large players tend to act against the majority.
Looking at the COT Report, the data supports the bullish thesis: non-commercials (speculative funds) remain net short, while commercials (physical operators) are increasing their long positions, indicating expectations of higher real demand in the medium term. This is a historically bullish signal, although it may not materialize immediately: commercials often start accumulating well before price movements occur.
Finally, seasonality favors the bulls: historically, from late April through mid-June, Natural Gas tends to perform positively, fueled by storage accumulation ahead of summer and the following winter season.
Strategically, a consolidation phase above 2.90–3.00 USD could serve as a base for larger moves towards 3.90 and eventually 4.90 USD, with the bullish scenario invalidated only below the 2.80 USD area.
Is Europe's Decline Grounding Airbus's Ascent?Europe's economic situation presents a complex picture of modest growth juxtaposed with significant challenges, creating uncertainty for major players like Airbus. In 2024, the European Union's GDP growth was projected to be below 1%, with only a slight acceleration anticipated for 2025. This sluggish economic expansion, when coupled with persistent inflation and ongoing geopolitical tensions, lays an unstable foundation for sustained economic prosperity.
The cohesion of the European Union itself is increasingly in question, influenced by the rise of nationalist sentiments and the potential for increased trade protectionism. The EU faces structural challenges, including economic disparities, political divisions, and growing Euroscepticism, which could precipitate its disintegration. Should this occur, individual countries would be forced to navigate complex economic and geopolitical landscapes independently, generating significant implications for multinational corporations like Airbus.
Concurrently, Airbus is navigating a highly competitive environment, most notably with its enduring rivalry with Boeing, which is actively seeking to overcome its recent operational and reputational hurdles. While Airbus has recently secured a larger market share, Boeing's inherent resilience, combined with the potential entry of new competitors, may challenge Airbus's current market dominance.
To sustain its competitive edge, Airbus must not only effectively manage the economic uncertainties and potential fragmentation within Europe but also maintain its commitment to technological innovation and efficient production. The company's ability to nimbly adapt to these multifaceted challenges will be crucial in determining its long-term success and continued leadership in the global aerospace industry.

ICP/USDT Breakout Potential: Descending Trendline Under PressureThis is the 4-hour chart for ICP/USDT, and it’s showing some interesting action. Over the past few months, ICP has been stuck in a downtrend with a clear descending trendline acting as resistance. However, each time it formed a falling wedge pattern, we saw a breakout to the upside, followed by short rallies.
Right now, the price is hovering around $5.10 and seems to be testing that same long-term trendline again. If it breaks above this level with strong volume, it could be the start of another bullish move. Definitely a chart to keep an eye on for a potential breakout in the coming days.

GOLD accumulate as the market lacks major fundamental impactSpot OANDA:XAUUSD moved significantly in early morning trading on Tuesday (April 29) and is currently trading at $3,315/oz, down 0.87% on the day at the time of writing.
OANDA:XAUUSD reversed losses on Monday and rebounded, having earlier dipped to around $3,268. The US Dollar (Dxy) fell broadly on Monday, supporting gold as investors cautiously awaited more news on US trade policy and braced for a week of in-depth economic data that could provide early indications of whether US President Trump’s trade war is having an impact.
The U.S. Dollar Index TVC:DXY fell 0.7% on Monday to close at 98.91, its lowest close in four trading days. The DXY has fallen 4.89% in April and is set to post its biggest monthly decline since July last year as Trump has shaken confidence in the reliability of U.S. assets.
A majority of economists polled by Reuters see a high risk of a global recession this year, with many saying that U.S. President Donald Trump’s tariffs have hurt business confidence. Bessant said on Monday that major U.S. trading partners have made “very good” proposals to avoid U.S. tariffs and one of the first deals to be signed would likely be with India.
Fed officials, including Chairman Jerome Powell, have said they are ready to cut rates if risks to economic growth become clear. But most officials appear to want to determine the impact of Trump’s tariffs on real economic indicators like inflation and employment before taking action.
This week, the US will also release first-quarter GDP data and the Fed's preferred inflation measure, core PCE, while Europe will also release preliminary GDP and inflation data.
Investors are also awaiting the US April jobs report on Friday, which is expected to show that employment is still growing, albeit at a much slower pace than a month ago.
Investors will also pay attention to the US JOLT jobs data for March and the second round of US-Japan tariff talks, due out today.
Technical Outlook Analysis OANDA:XAUUSD
On the daily chart, gold continues to move sideways as there is no fundamental impact big enough to break the structure to create a short-term trend. But in terms of position, gold is currently likely to decline as the RSI is pointing down quite far from 50, 50 in this case acts as the nearest target support indicating that there is still room for downside ahead in the short term.
However, in the overall picture, gold is still trending up mainly due to supporting factors such as the trending price channel as the main trend, the main support from EMA21 and as long as gold is above EMA21, in/above the price channel, it is still in the main uptrend, the declines should only be considered as short-term corrections or a buying opportunity.
During the day, gold is expected to accumulate with the main uptrend, the notable positions will be listed as follows.
Support: 3,292 – 3,267 – 3,245 USD
Resistance: 3,371 USD
SELL XAUUSD PRICE 3382 - 3380⚡️
↠↠ Stop Loss 3386
→Take Profit 1 3374
↨
→Take Profit 2 3368
BUY XAUUSD PRICE 3287 - 3289⚡️
↠↠ Stop Loss 3283
→Take Profit 1 3295
↨
→Take Profit 2 3301

No Change for EURUSDEURUSD continues its sideways movement above 1,1300, and there is no change in the outlook.
The trend remains bullish, but we might see a correction toward the next support levels first.
These levels, determined by Fibonacci retracement and previous highs, are 1,1253, 1,1183, and 1,1055.
Tomorrow, the first USD-related news releases are scheduled, which could have an impact, followed by the NFP data on Friday.

EUR/USD short: Will Moby Dick drag down the global economy?Hello traders
The allegory of our current global economy and Moby Dick, the rare white whale, hunted by the obsessed Captain Ahab, is not one I am writing about in a light hearted manner.
A refresher: Moby Dick(China) bites off Captain Ahab's(USA) leg and is subsequently relentlessly hunted by the obsessed captain who wants revenge. At the conclusion of the novel, Captain Ahab is oh, so close to killing the elusive whale but gets entangled in the rope of the harpoon and is dragged down to his own watery death by the wounded whale.
Moral of the story? Moby Dick is a classic American novel and China has not eaten the USA's lunch. I do not see any winners in this tariff war but rather the distinct possibility of a global recession and potential melt down like 2008/2009.
At the heart of this conundrum is DJT's obsession with trade balance going back to his first term. The irony being, the 2018 trade imbalance was the biggest ever under his watch.
I love these magnificent United States more than anything but let's get real. DJT won his second term on the persistent high inflation after COVID-19 and immigration not because we, as privileged Americans are suffering as the richest country on the planet(except for Swiss citizens). While I also support regulated immigration, we as Americans, do not want to perform the "menial" jobs that migrants are willing to do. My ancestors survived WW1, WW2, the dust bowl, the Great Depression and every subsequent calamity but never lost track of the integrity in ANY job that feeds a family.
There is a lot of whining about losing manufacturing jobs to China but I dare anyone who feels that they have missed out on a job opportunity to go and pick oranges in the blazing Florida sun with a 50 pound bag on the back or work a low paid job in a sneaker manufacturing facility.
Let's not forget what drives the USA economy: the consumer. We have benefitted from cheap/inexpensive Chinese labor and goods for a long time and will feel the pain if this tariff war is not resolved in a realistic manner. China's currency manipulation has always been geared towards boosting their exports and I do not foresee that policy changing anytime soon.
China is denying that any trade talks are happening and there is increasing day light visible between DJT and his Cabinet members. Bessant won't confirms trade negotiations and Rubio claims not to know what DJT's stance is towards Russia/Ukraine.
It all comes down to DJT's obsession with the white whale, China. Who will blink first? I do not know but this zero sum game is dangerous and could potentially plunge the entire global order into a crisis the likes of which will dwarf WW2 and 2008/2009.
I have initiated a short EUR/USD position at 1.1420 with an eye toward 1.0958 or lower. I am not claiming that the divestment in USA assets has run its course but at this point, I am inclined to reaffirm my belief in American exceptionalism but not in leadership. At this point, the Euro Zone still stands to lose more than the USA, especially in the light of tepid German economic performance and the unresolved Ukraine/Russia war.
There has been a lot of smoke and mirrors during the first 100 days with a flurry of executive orders to fight the woke culture, annex sovereign territories etc. but as human beings, we all have a need and right to shelter, food, clean water and air and the ultimate, the pursuit of happiness. And happiness goes right out the window when the aforementioned rights are not met or satisfied.
So, here lies the Moby Dick moment. Will DJT's obsession with tariffs and power drag us all down? Distinct possibility...
Thank you for listening to my two cents and best of luck with your trades. How you draw the distinction between noise and trading signals, is up to your own analysis. I can only speak for my own bank account and capital but tread lightly through this minefield that should never have happened in the first place.
