Wheat Trade ideaWheat has been in a downtrend for the past two years, but right now it’s sitting in a strong demand zone on the weekly chart for the year. Both the technicals and fundamentals are starting to look bullish, so this could be a solid setup for a long trade even if the overall trend is still down.
On Thursday, April 24, there was a nice daily rejection between the 545’00 and 539’00 levels. That would’ve been a good entry based on my strategy.
Most traders would avoid this kind of trade because of the strong downtrend, but I see everything lining up here: demand zone, fundamentals, and rejection. It doesn’t mean the market will reverse, but the risk is worth the potential reward.
I’m not expecting a huge move just taking what the market gives me. If fundamentals keep supporting the move, I’ll hold longer. If not, I’ll take profit earlier. It’s about staying realistic and disciplined.
Fundamental Analysis

Is the CGPT Retest a Setup-Are You Ready for It?Yello, Paradisers! Have you been watching CGPT closely? Because what we’re seeing now could be a textbook setup to liquidate early longs before a brutal downward move. This is the exact type of trap that punishes undisciplined traders and rewards those who wait.
💎After weeks of bullish momentum with clean higher highs and higher lows, #CGPTUSDT has now printed a clear change of character (CHoCH). The previous low was taken out, and now price has pulled back right into a high-probability resistance zone. This zone, between $0.115 and $0.118, aligns perfectly with a broken ascending trendline adding confluence that strengthens our bearish bias. Traders who aren't careful might interpret this retest as a sign of strength, but this could just be the market setting up its next liquidation wave.
💎Adding even more weight to this bearish thesis is the fact that #CGPT is currently trading below its 50 EMA on the 4H timeframe, showing clear weakness and confirming that the short-term momentum has already shifted in favor of sellers. This acts as dynamic resistance and makes it even harder for price to reclaim bullish control without a significant effort from buyers.
💎The structure is showing all signs of a classic trap. Price action is hesitant at resistance, and with momentum waning, a rejection from this level could spark a swift move down toward $0.09188, our first support zone. But that may not be the end of it. If selling accelerates, we are eyeing the $0.07133 area as a potential major demand zoneour strong support and where true smart money will likely accumulate. However, we must always remain tactical. If CGPTUSDT flips above $0.12526, this bearish scenario is invalidated and we would reassess for possible bullish continuation.
Discipline, patience, robust strategies, and trading tactics are the only ways you can make it long-term in this market.
MyCryptoParadise
iFeel the success🌴

EURUSD Pullback – All Eyes on Interest RatesEURUSD remained calm yesterday, showing little to no change.
The main event this week is the U.S. interest rate decision – a key driver that could shape the pair’s next move.
Support levels remain unchanged at 1,1253, 1,1183, and 1,1055 – areas where price may react.
Keep a close eye on price action – a bounce from these levels could confirm a continuation of the bullish trend.

Gold (XAU/USD) Analysis – 1D
🏛 1. Current Market Structure
🚀 Gold reached a peak at $3,500 following Trump’s tariff announcement, triggering a sharp bullish reaction.
🔻 This move was followed by a strong correction, leading price back down to key structural support zones.
🌍 2. Bigger Picture Outlook
📉 This violent retracement allowed the market to revisit accumulation areas, including tested supply zones and bullish OTE levels.
🔎 Price seems to be stabilizing now, suggesting a potential directional move could emerge once structure confirms.
🔍 3. Key Technical Observations
⬜️ Supply Zone: A structural area of interest now acting as potential support.
🟦 Bullish OTE: Located lower, it serves as a final line of defense in case of further downside.
📐 Descending trendline is currently being tested — a breakout would confirm bullish momentum shift.
🎯 4. Short-Term Expectations
📉 Controlled pullback scenario:
Price may revisit the supply zone, or even dip into the OTE, to consolidate before a bullish breakout.
📈 Confirmed bullish scenario:
A clean break above the trendline and recent highs would validate a strong reversal and aim again for $3,500+.
🔥 5. Upcoming Catalysts
📰 Geopolitical or economic updates linked to the US (tariffs, inflation).
📊 Institutional reaction to tested support zones.
💡 Volume confirmation on structural breakout.
✅ Conclusion
👉 After a sharp rejection from a geopolitical news-driven spike, gold is now retesting major support zones.
📍 Three key levels to watch:
The Supply Zone
The 50% retracement
The Bullish OTE
🔎 Price action around these areas will determine whether this is just a pullback — or the start of a new bullish leg.

Here is what you need to know on Tuesday, May 6:The US Dollar Index (DXY) managed to rebound from daily lows and end Monday’s session with humble losses near the key 100.00 hurdle. The final Balance of Trade data will be in the spotlight, seconded by the API’s weekly report on US crude oil inventories.
(DXY), which measures the value of the US Dollar against a basket of currencies, posted mild gains on Monday as the Taiwan Dollar surged over 5%. The move sparked a broader rally in Asian currencies amid speculation of FX conversions by exporters. Markets remained thin with multiple public holidays affecting liquidity.The DXY Index currently trades at 99.93, up 0.08% on the day, within a daily range of 99.46 to 100.05. Momentum remains neutral with a Relative Strength Index (RSI) of 40.84, while the Moving Average Convergence Divergence (MACD) flashes a buy signal. However, the 20, 100, and 200-day simple moving averages — at 100.13, 105.38, and 104.39, respectively — all point to continued bearishness. Additional downward pressure comes from both the 10-day and 30-day EMAs, which sit at 99.77 and 101.09. Key support is located at 99.60, with resistance at 99.77, 100.08, and 100.13.

Dollar Decline Against All Major CurrenciesThe Dollar’s decline didn’t start with the recent ‘Liberation Day’ tariffs. In fact, it has been gradually weakening since the 1970s.
More recently, however, the Dollar has lost value against many currencies since January. Why is that?
Why have the USD/CHF and USD/SGD strengthened against the US Dollar over the past few decades? One reason is that both countries have managed their money supply with discipline. For example, as of end-2024, Switzerland’s net federal debt stood at 141 billion Swiss franc, their debt to GDP ratio at 17.2%.
In contrast, the United States has expanded its national debt at an alarming rate. Some might point out that Japan’s debt-to-GDP ratio is even higher—around 230%. That is why the Japanese Yen has also been in decline for decades.
Why does printing more money through QE and increasing the money supply weaken a currency?
Just imagine in a close economy with 10 people and 1 central bank. If the central bank printed $100 and distributed equally to the 10, each of them will receive $10 to buy 10 available cheesecakes.
But now the central bank decided to print $1,000 and each person will have $100 to buy 10 available cheesecakes.
The global economy is not a close, but an open system.
When the US and other major economies printed massive amounts of money, they didn’t just inflate their own economies—they exported inflation worldwide. This contributes to rising cost of living not all around the world.
In my view, Gold is also a currency pair against the US at the start of 1971. The moment dollar unpeg itself from gold, gold appreciates. With each QE, we can see how the currencies have diluted with gold and inflation appreciating over these years.
Why different currencies have started to appreciate against the USD since January this year?
We can see all the currencies have either reached its bottomed in January and started moving higher or it formed a reversal pattern like the Aussie dollar and the Dollar Yuan, in this case with this inverted hammer, it is indicating Dollar Yuan to reverse downward, meaning dollar coming off and yuan to appreciate.
January was President Trump inauguration and February was when he rolled out tariffs against Canada, Mexico and China, and the market do not like that and has been selling the USD against the rest of the currencies?
If US has printed the so much money, but why other than Swiss franc and Singapore Dollar, many other currencies have been depreciating against dollars over the past decades?
I’d like to hear your thoughts on this.
Euro FX Futures & Options
Ticker: 6E
Minimum fluctuation:
0.000050 per Euro increment = $6.25
Disclaimer:
• What presented here is not a recommendation, please consult your licensed broker.
• Our mission is to create lateral thinking skills for every investor and trader, knowing when to take a calculated risk with market uncertainty and a bolder risk when opportunity arises.
CME Real-time Market Data help identify trading set-ups in real-time and express my market views. If you have futures in your trading portfolio, you can check out on CME Group data plans available that suit your trading needs www.tradingview.com
Trading the Micro: www.cmegroup.com

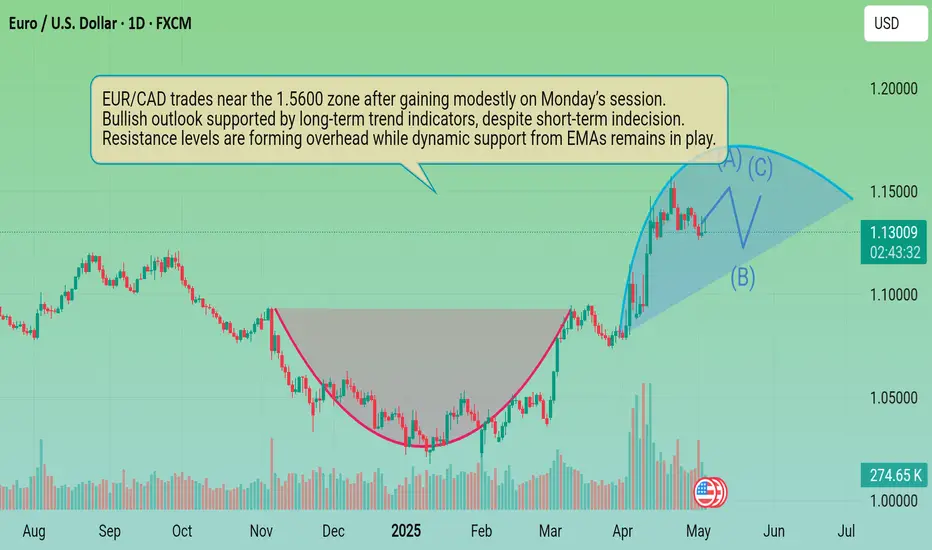
EUR/CAD Price Analysis: Euro edges higher near 1.5600 as longer-The EUR/CAD pair ticked higher on Monday, trading around the 1.5600 area after the European session. While price action remained within the middle of the daily range, the pair showed signs of underlying strength, aligning with a broader bullish structure. Momentum signals remain mixed for now, though the longer-term trend bias continues to favor the euro over the loonie.
Technically, the EUR/CAD setup holds a bullish tone despite some neutral momentum signals. The Relative Strength Index sits near 49, showing a balanced market, while the Moving Average Convergence Divergence leans bearish with a soft sell signal. The Awesome Oscillator is neutral, and the Bull Bear Power indicator suggests a slight bias toward buying pressure, offering mild confirmation of demand.
Breadbasket Basics: Trading Wheat Futures🟡 1. Introduction
Wheat may be a breakfast-table staple, but for traders, it’s a globally sensitive asset — a commodity that reacts to geopolitics, climate patterns, and shifting demand from dozens of countries.
Despite its critical role in food security and its status as one of the most traded agricultural commodities, wheat is often overlooked by traders who focus on corn or soybeans. Yet wheat offers a unique combination of liquidity, volatility, and macro sensitivity that makes it highly attractive for both hedgers and speculators.
If you’re new to trading wheat, this guide gives you a solid foundation: how the wheat market works, who the key players are, and what makes wheat such a dynamic futures product.
🌍 2. Types of Wheat and Where It Grows
One of the first things traders need to understand is that wheat is not a single, uniform product. It’s a diverse group of grain types, each with its own characteristics, end uses, and pricing dynamics.
The major classes of wheat include:
Hard Red Winter (HRW): High-protein wheat grown in the central U.S. — used in bread and baking.
Soft Red Winter (SRW): Lower protein, used for pastries and crackers.
Hard Red Spring (HRS): Grown in the Northern Plains; prized for high gluten content.
Durum Wheat: Used for pasta, grown mainly in North Dakota and Canada.
White Wheat: Grown in the Pacific Northwest; used for noodles and cereals.
Each class responds differently to weather, demand, and regional risks — giving traders multiple ways to diversify or hedge.
Major global producers include:
United States
Russia
Canada
Ukraine
European Union
Australia
India
These regions experience different planting and harvesting calendars — and their weather cycles are often out of sync. This creates trading opportunities year-round.
🛠️ 3. CME Group Wheat Contracts
Wheat futures are traded on the Chicago Board of Trade (CBOT), part of the CME Group.
Here are the two key contracts:
o Standard Wheat
Ticker: ZW
Size = 5,000 bushels
Tick = 0.0025 = $12.50
Margin = ~$1,750
o Micro Wheat
Ticker: MZW
Size = 500 bushels
Tick = 0.0050 = $2.50
Margin = ~$175
Keep in mind that margins are subject to change — always confirm with your broker. Micro contracts are ideal for scaling in/out of trades or learning market structure without large capital risk.
📅 4. Wheat’s Seasonality and Supply Chain
Unlike corn or soybeans, wheat is planted and harvested across multiple seasons depending on the variety and geography.
In the U.S., winter wheat (HRW and SRW) is planted in the fall (September–November) and harvested in early summer (May–July). Spring wheat (HRS) is planted in spring (April–May) and harvested late summer.
Globally, things get even more staggered:
Australia’s wheat is harvested in November–December
Ukraine and Russia harvest in June–August
Argentina’s crop comes off the fields in December–January
This scattered global schedule means news headlines about one country’s weather or war (think Ukraine in 2022) can quickly shift sentiment across the entire futures curve.
📈 5. Who Trades Wheat and Why
Wheat is traded by a wide range of participants — each with their own objectives and strategies. Understanding their behavior can give you an edge in anticipating market moves.
Commercial hedgers:
Farmers lock in prices to protect against adverse weather or market crashes.
Grain elevators and exporters use futures to manage inventory risk.
Flour mills hedge their input costs to protect profit margins.
Speculators:
Hedge funds and CTAs trade wheat based on global macro trends, weather anomalies, or technical setups.
Retail traders increasingly use micro contracts to gain exposure to agricultural markets with lower capital risk.
Spread traders bet on pricing differences between wheat classes or harvest years.
🔍 For retail traders especially, micro contracts like XW open the door to professional markets without oversized exposure.
🧠 6. What Makes Wheat Unique in Futures Markets
Wheat is often considered the most geopolitically sensitive of the major grains. Here’s why:
Price can spike fast — even on rumor alone (e.g., export bans or missile strikes near ports).
Production risks are global — the market reacts not just to the U.S. crop, but to conditions in Russia, Ukraine, and Australia.
Storage and quality matter — protein levels and moisture content affect milling demand.
Unlike corn, wheat doesn’t have a single dominant industrial use (like ethanol). This means food demand is king, and food security often drives policy decisions that affect futures pricing.
📌 7. Summary / Takeaway
Wheat may not get as much media attention as corn or soybeans, but it’s a deeply important — and deeply tradable — market. Its global footprint, class differences, and sensitivity to weather and politics make it a must-know for serious agricultural futures traders.
Whether you're just starting out or looking to diversify your trading playbook, understanding wheat is an essential step. Learn its rhythms, follow its news, and respect the fact that every crop cycle brings a new story to the market.
🧭 This article is part of an ongoing educational series exploring futures trading in agricultural commodities.
📅 Watch for the next release: “Soybeans: The Global Protein Powerhouse.”
When charting futures, the data provided could be delayed. Traders working with the ticker symbols discussed in this idea may prefer to use CME Group real-time data plan on TradingView: www.tradingview.com - This consideration is particularly important for shorter-term traders, whereas it may be less critical for those focused on longer-term trading strategies.
General Disclaimer:
The trade ideas presented herein are solely for illustrative purposes forming a part of a case study intended to demonstrate key principles in risk management within the context of the specific market scenarios discussed. These ideas are not to be interpreted as investment recommendations or financial advice. They do not endorse or promote any specific trading strategies, financial products, or services. The information provided is based on data believed to be reliable; however, its accuracy or completeness cannot be guaranteed. Trading in financial markets involves risks, including the potential loss of principal. Each individual should conduct their own research and consult with professional financial advisors before making any investment decisions. The author or publisher of this content bears no responsibility for any actions taken based on the information provided or for any resultant financial or other losses.

5 May Weekly NAS100 Forecast USTECH: Trade Talks and Fed Decision in Focus
Analysis:
Markets are at a pivotal juncture as investors monitor two critical developments: the potential resumption of U.S.-China trade negotiations and the Federal Reserve's upcoming policy decision.
Trade Negotiations: Renewed dialogue between the U.S. and China could alleviate tariff pressures, stabilize global supply chains, and bolster investor confidence, thereby reducing recession risks.
Federal Reserve Decision: The Federal Open Market Committee (FOMC) is scheduled to meet on May 6–7, 2025. While the Fed is widely expected to maintain the current interest rate range of 4.25%–4.50%, market participants are keenly awaiting Chair Jerome Powell's commentary for insights into future monetary policy directions.
Market Bias: Cautiously Bullish
The confluence of potential trade resolutions and a steady monetary policy stance supports a cautiously optimistic outlook. However, market volatility may persist pending concrete developments.
Key Levels to Watch:
USTECH (NASDAQ 100):
Resistance: 20 531
Support: 19 481
Conclusion:
Investors should remain vigilant, monitoring both geopolitical developments and central bank communications, as these factors will significantly influence market trajectories in the near term.
---
Disclaimer: This analysis is for informational purposes only and does not constitute investment advice. Always conduct your own research before making trading decisions.
---

NAS100 - Stock Market, Waiting for FOMC?!The index is above the EMA200 and EMA50 on the 4-hour timeframe and is trading in its ascending channel. I expect corrective moves from the specified range, but if the index continues to move upwards towards 21,000 points, we can look for the next Nasdaq short positions with a risk-reward ratio.
Last week, U.S. equity markets experienced $8.9 billion in capital outflows, while equity markets in Japan and the European Union saw net inflows. Additionally, U.S. Treasury bonds recorded an outflow of $4.5 billion—the largest since December 2023. Meanwhile, the gold market witnessed its first weekly investment decline since January.
Looking ahead, financial markets are focused on the upcoming earnings reports from major companies across sectors such as technology, healthcare, automotive, energy, and financial services. These reports are expected to significantly influence equity trends, investment strategies, and corporate outlooks. Below is a daily breakdown of key companies set to release earnings this week:
Monday, May 5, 2025
The week starts with a focus on the healthcare and biotech sectors:
• Before market open: Companies such as Palantir, Ford, Onsemi, and Tyson Foods will report earnings. Palantir and Ford are particularly noteworthy for investors in the tech and auto sectors.
• After market close: Healthcare firms like Hims & Hers Health, Axsome Therapeutics, and financial company CNA Financial will report.
Tuesday, May 6, 2025
Tuesday highlights several key tech earnings:
• Before market open: Celsius, Datadog, Rivian, and Tempus will publish their results. Rivian’s report is especially anticipated due to the intense competition in the electric vehicle space.
• After market close: Tech giants like AMD and Arista Networks will release earnings, along with Marriott from the hospitality sector.
Wednesday, May 7, 2025
A packed day for earnings reports:
• Before market open: Reports from Uber and Teva are expected, along with ARM Holdings, a key player in semiconductors.
• After market close: AppLovin, Unity, and Robinhood will release their reports—representing digital gaming, software, and fintech respectively.
Thursday, May 8, 2025
This day centers on digital health, cryptocurrency, and e-commerce:
• Before market open: Peloton and Shopify will report. Shopify’s performance is particularly critical in the online retail sector.
• After market close: Crypto firm Coinbase and online sports betting platform DraftKings are in focus.
Friday, May 9, 2025
Fewer companies will report, but some are of strategic interest:
• Firms like 1stdibs, Ani Pharmaceuticals, and Embecta are scheduled, as well as Telos and Algonquin—key names in energy and cybersecurity investing.
This week, markets are closely monitoring Wednesday’s FOMC meeting. At the March session, the Fed left rates unchanged and signaled only two potential cuts totaling 50 basis points for the year, based on its dot plot—suggesting a cautious approach to monetary easing.
Simultaneously, April’s U.S. Services PMI is set to be released today, providing clearer insights into post-tariff business activity.
Amazon’s CEO stated that, so far, there is no indication of reduced demand due to tariff concerns. Some inventory spikes were noted in specific categories, likely driven by stockpiling ahead of tariff implementation. Retail prices, on average, have not significantly increased, and most sellers have yet to raise prices—though that could change depending on how tariff policies evolve. Notably, essential goods have grown at twice the rate of other categories and now account for a third of all unit sales in the U.S.
Following April’s jobs report, the likelihood of a Fed rate cut in June dropped from 75% to 42%. With only one more employment report due before the June 18 meeting, hopes for an early policy shift have faded. Some analysts argue that without the tariff conflict, the Fed might already be cutting rates, given the downward trend in inflation, steady growth, and Congressional focus on fiscal measures.
The April jobs data showed that the U.S. labor market remains resilient—neither too strong to spark inflation fears nor too weak to trigger panic. After the release, with market confidence rebounding, Goldman Sachs forecasted the Fed’s first rate cut to come at the July 30 meeting.
The consensus expectation is for the Fed funds rate to remain in the current 4.25%-4.5% range, unchanged since January. The CME FedWatch tool currently assigns just a 1.8% chance of a rate cut at the upcoming meeting.
Economists warn that Trump’s newly imposed tariffs—active since April—could drive up prices and hurt employment, challenging the Fed’s dual mandate of controlling both inflation and joblessness. However, recent data shows inflation remained mild in March and the labor market held steady in April.
Nancy Vanden Houten, Chief U.S. Economist at Oxford Economics, wrote: “The data is strong enough for the Fed to stay on the sidelines and monitor how tariffs influence inflation and expectations.” While hard data remains stable, forecasts and sentiment surveys signal looming challenges. Business leaders and individuals express concern that rising costs may burden consumers and businesses in the coming months or years, possibly even tipping the economy into recession.

Gold Price Action Analysis – Breakout Potential Above ResistanceThis 1-hour chart for CFDs on Gold (XAU/USD) highlights key levels and potential scenarios based on recent price action. The current price is at $3,364.26, with an upward momentum of +0.85%. The chart marks a critical resistance zone (shaded red) around the $3,364 level. A breakout above this resistance may push price targets to $3,399 and potentially $3,410. Conversely, if price fails to break above, it may retrace to support zones near $3,340 or $3,320. Traders are watching closely for a breakout confirmation or a pullback.
Gold (XAU/USD) is currently testing a key resistance zone around $3,364. If it breaks above this level, price may target $3,399 and $3,410. If it fails, a pullback toward $3,340 or $3,320 is likely. Traders are watching for a breakout confirmation or rejection.

USDJPY, Bullish TrendFundamentally JPY is on bearish side
COT data shows highest long positions opened in JPY
dovish remarks by central bank positions JPY on bearish side
Expected stable rate of USD in coming FOMC rise bulls in USD
seasonality shoes USD bullish in MAY while JPY sideways
Current scenario of trump being lenient on tarrifs also bring momentum
in risk off scenarios i.e lower participant interest in JPY
On technical, USDJPY hit its strong weekly support level
Look for buy setups
68% fib retracement completed
Trendline support intact
currently sideways
buy in parts
buy 1. CMP at small risk
buy 2. upon closing above 144.296
Stoploss below 143.5

Bitcoin a Technical Summery technical summary based on what you're describing for BTCUSDT on the 4H timeframe:
Forecast from Mr Martin Date 05 May 2025
Current Setup:
Pattern: Two-sided consolidation/pattern (likely symmetrical triangle or range)
Key Support: ~89,000 USDT
Key Resistance: ~95,000 USDT
Scenarios:
Bullish Breakout:
If price holds above 95K and confirms breakout: Next target: ~98,000 USDT
Above 98K, could test psychological levels like 100K.
Bearish Breakdown: If price falls below 89K:nExpect a retest or quick rebound toward resistance (~95K).
You may see more details in the chart Ps Support with like and comments for more analysis Thanks

WTI rises above $57.50, continues recovery despite concerns overWest Texas Intermediate (WTI) crude Oil price continues to recover during Asian trading on Tuesday, hovering around $57.60 per barrel after a nearly 2% decline on Monday. However, gains were capped by concerns over rising global supply following an OPEC+ decision to accelerate output increases.
Last week, OPEC+, the Organization of the Petroleum Exporting Countries and its allies, agreed to ramp up production for a second straight month, announcing an additional 411,000 barrels per day (bpd) increase for June. This increase, contributed by eight members including Russia, brings the combined rise for April, May, and June to 960,000 bpd—effectively reversing 44% of the 2.2 million bpd in cuts implemented since 2022, according to Reuters estimates.
Sources within the group told Reuters that OPEC+ could fully reverse its voluntary cuts by the end of October if compliance with output quotas does not improve. Saudi Arabia is reportedly pressuring the group to accelerate the rollback of cuts to penalize Iraq and Kazakhstan for their repeated failure to meet agreed production targets.

AMD Longadvanced money destroyer? Long idea.
Good luck to all in these market conditions. Hopefully this is a very good idea like the ones we published previously that have been removed

XAUUSD- 1H UpdateChart Description – XAUUSD 1H (Gold Spot vs. USD)
This is a multi-scenario Smart Money Concept (SMC)-based projection chart for Gold (XAUUSD), focusing on potential bullish retracements and major bearish continuations, incorporating Buy Zones, Sell Zones, and Change of Character (CHOCH) areas.
🔍 Key Components:
🟣 Sell Zones
Two sell zones are identified, with the highest near the All-Time High (ATH) around the $3,500 mark.
These are areas of expected bearish reaction if price retraces upward after a low.
🟢 Buy Zones
Located between $3,200 – $3,160 and another deeper one near $2,960, where potential bullish reactions may occur.
🔵 CHOCH - 4H
Marked in red around $3,260 area, indicating a 4-hour Change of Character, suggesting a potential shift from bullish to bearish sentiment.
🔸 Key Price Levels
$3,120: Historical support/resistance.
$2,956.20: Major swing low and key demand zone.
📊 Projected Market Path (Colored Waves)
🔹 Blue Path (Bullish Retracement Scenario)
Price is expected to retrace into a sell zone around $3,400–$3,460 after testing the current demand.
From there, a major sell-off is anticipated.
🔷 Cyan Path (Bearish Continuation)
Following the retracement, the market is projected to break below the recent low and head toward lower buy zones, potentially near the $3,120 and $2,960 regions.
Shows lower-high and lower-low formation, consistent with a bearish trend.
🧠 Market Sentiment
This chart suggests a bearish outlook for Gold unless a structural shift invalidates the CHOCH zone and supply levels. The chart highlights the importance of:
Waiting for confirmation in the supply zones before shorting.
Considering buy opportunities only in valid buy zones with bullish reaction confirmation.

USDJPY Technical Outlook: SMC and Wyckoff Analysis 5 May 2025As of May 5, 2025, the USDJPY pair is trading around ¥144.30, reflecting a 0.40% decrease from the previous session. This movement follows the Bank of Japan's decision to maintain interest rates while revising growth forecasts downward, leading to a depreciation of the yen.
Technical Analysis:
Support and Resistance Levels: The pair is approaching a significant support zone near ¥143.00. A break below this level could expose the next support at ¥141.00, while resistance is observed around ¥148.00.
Relative Strength Index (RSI): The RSI is nearing oversold territory, suggesting potential for a short-term rebound.
Smart Money Concepts:
Order Blocks: A bullish order block is identified between ¥142.50 and ¥143.00, indicating potential institutional buying interest.
Liquidity Pools: Liquidity above the recent highs near ¥148.00 may attract price action if bullish momentum resumes.
Wyckoff Method Perspective:
Accumulation Phase: The recent price action suggests a possible accumulation phase, with the pair trading within a range between ¥140.00 and ¥146.00.
Spring Test: A false breakout below ¥143.00 could serve as a spring, leading to potentially high buying volume.
Fundamental Factors:
Bank of Japan (BOJ) Policy: The BOJ's decision to keep rates unchanged, despite lowering growth forecasts, has contributed to yen weakness.
Federal Reserve Outlook: Market participants are closely watching the ISM Services PMI later today and the upcoming FOMC meeting for signals on US monetary policy, which could impact USDJPY dynamics.
Conclusion:
The USDJPY pair is at a critical juncture, with technical indicators pointing to potential support near ¥143.00. Traders should monitor price action around this level for signs of accumulation or further downside. Fundamental developments, particularly central bank policies, will play a crucial role in determining the pair's direction in the near term.

BTC SHORT TERM FOLLOW UP BE SURE TO BUY AT 89-91k"Last alert for the dip — this is a follow-up to my initial analysis on the short-term period."


Caution: USD/HKD rate tests decisive PEG of 7.75Introduction: Since the start of 2025, the US dollar has been the only major currency to post a significant decline on the forex market. In fact, it is the only so-called major currency to have fallen on Forex this year. Against this backdrop, Donald Trump's trade war has weakened the greenback's image as a safe haven in the face of the risk of global economic recession. Institutional investors have increased their short positions in the US dollar in recent weeks, reaching a net short exposure of US$17 billion according to the CFTC's COT report. It should be noted that the rebound in the US equity market has not led to a strong rebound in the US dollar (DXY), although the latter is stabilizing in the short term against the euro.
The US dollar (DXY) has lost over 8% against a basket of major currencies since the start of the year, and remains under heavy pressure against Asian currencies at the start of the week, notably the Hong Kong and Taiwan dollars.
1) Institutional bearish positioning reaches a zone of excess
Analysis of data from the CFTC's latest COT (Commitment Of Traders) report shows that institutional positioning on the US dollar is reaching excessive levels: on both the EUR/USD and JPY/USD rates, bearish USD positions are reaching high levels which could be close to their paroxysm. The DXY (index of the US dollar against a basket of major currencies) shows a technically bearish monthly close, but oversold signals are increasingly numerous on the weekly and daily horizons. Sellers are beginning to reach the technical thresholds seen in the years 2023 and 2024, and the DXY appears to be stabilizing in the short term as we await the FED's next monetary decision on Wednesday May 7. The case of the dollar against Asian currencies is also revealing: volatility is exploding, forcing monetary authorities such as those in Hong Kong and Taiwan to intervene. This confirms that the dollar's weakness is beginning to generate tensions on fixed exchange rate regimes, notably the USD/HKD PEG.
2) The USD/HKD exchange rate on the decisive PEG of 7.75;
Faced with pressure on its currency, the Hong Kong Monetary Authority was prompted to intervene massively on the foreign exchange market, buying back 6 billion US dollars in one day. This intervention is aimed at defending the PEG, the peg between the Hong Kong dollar and the greenback, threatened by the latter's downward momentum, as the pair flirts with the lower limit of the corridor set between 7.75 and 7.85.
Despite the dollar's notable decline, it would be premature to see it spiraling out of control, and it could stabilize this week with the FED's monetary policy decision on Wednesday May 7. US economic fundamentals remain robust, starting with the labor market, which continues to perform well according to the latest NFP report. Jerome Powell is unlikely to yield to Donald Trump's pressure on Wednesday May 7, and the resumption of the US federal funds rate cut is not expected before the summer.
Conclusion: to sum up, although the correction in the dollar appears to be part of an underlying trend this year, 2025, it is beginning to look oversold in the short term. For the USD/HKD rate, the 7.75 threshold should be kept under very close surveillance this week.
DISCLAIMER:
This content is intended for individuals who are familiar with financial markets and instruments and is for information purposes only. The presented idea (including market commentary, market data and observations) is not a work product of any research department of Swissquote or its affiliates. This material is intended to highlight market action and does not constitute investment, legal or tax advice. If you are a retail investor or lack experience in trading complex financial products, it is advisable to seek professional advice from licensed advisor before making any financial decisions.
This content is not intended to manipulate the market or encourage any specific financial behavior.
Swissquote makes no representation or warranty as to the quality, completeness, accuracy, comprehensiveness or non-infringement of such content. The views expressed are those of the consultant and are provided for educational purposes only. Any information provided relating to a product or market should not be construed as recommending an investment strategy or transaction. Past performance is not a guarantee of future results.
Swissquote and its employees and representatives shall in no event be held liable for any damages or losses arising directly or indirectly from decisions made on the basis of this content.
The use of any third-party brands or trademarks is for information only and does not imply endorsement by Swissquote, or that the trademark owner has authorised Swissquote to promote its products or services.
Swissquote is the marketing brand for the activities of Swissquote Bank Ltd (Switzerland) regulated by FINMA, Swissquote Capital Markets Limited regulated by CySEC (Cyprus), Swissquote Bank Europe SA (Luxembourg) regulated by the CSSF, Swissquote Ltd (UK) regulated by the FCA, Swissquote Financial Services (Malta) Ltd regulated by the Malta Financial Services Authority, Swissquote MEA Ltd. (UAE) regulated by the Dubai Financial Services Authority, Swissquote Pte Ltd (Singapore) regulated by the Monetary Authority of Singapore, Swissquote Asia Limited (Hong Kong) licensed by the Hong Kong Securities and Futures Commission (SFC) and Swissquote South Africa (Pty) Ltd supervised by the FSCA.
Products and services of Swissquote are only intended for those permitted to receive them under local law.
All investments carry a degree of risk. The risk of loss in trading or holding financial instruments can be substantial. The value of financial instruments, including but not limited to stocks, bonds, cryptocurrencies, and other assets, can fluctuate both upwards and downwards. There is a significant risk of financial loss when buying, selling, holding, staking, or investing in these instruments. SQBE makes no recommendations regarding any specific investment, transaction, or the use of any particular investment strategy.
CFDs are complex instruments and come with a high risk of losing money rapidly due to leverage. The vast majority of retail client accounts suffer capital losses when trading in CFDs. You should consider whether you understand how CFDs work and whether you can afford to take the high risk of losing your money.
Digital Assets are unregulated in most countries and consumer protection rules may not apply. As highly volatile speculative investments, Digital Assets are not suitable for investors without a high-risk tolerance. Make sure you understand each Digital Asset before you trade.
Cryptocurrencies are not considered legal tender in some jurisdictions and are subject to regulatory uncertainties.
The use of Internet-based systems can involve high risks, including, but not limited to, fraud, cyber-attacks, network and communication failures, as well as identity theft and phishing attacks related to crypto-assets.

bullish bias if inflation remains elevated.DXY is firming after last week’s strong US jobs data, which beat expectations and reduced the odds of an early Fed rate cut.
Bullish bias, especially if inflation remains elevated.
Be ready to adjust to both sides of the equation.

Gold price sticksGold price (XAU/USD) sticks to its modest intraday gains above the $3,250 level through the Asian session on Monday, though it lacks strong follow-through buying or a bullish conviction. Against the backdrop of the protracted Russia-Ukraine war, an escalation of the Middle East conflict keeps the geopolitical risk in play. Furthermore, the uncertainty over US President Donald Trump's tariff plans weighs on investors' sentiment and benefits the traditional safe-haven precious metal.
Meanwhile, heightened economic uncertainty on the back of Trump's tariffs fails to assist the US Dollar (USD) to capitalize on the upbeat US monthly jobs report-inspired bounce. Apart from this, bets for an imminent start of the Federal Reserve's (Fed) rate-cutting cycle lend additional support to the non-yielding Gold price. Traders, however, seem reluctant to place aggressive bets and opt to move to the sidelines ahead of a two-day FOMC policy meeting starting on Tuesday.

ETERNAL - Eternal Ltd. (2 hours chart, NSE) - Long PositionETERNAL - Eternal Ltd. (2 hours chart, NSE) - Long Position; short-term research idea.
Risk assessment: Medium {volume structure integrity risk}
Risk/Reward ratio ~ 2.36
Current Market Price (CMP) ~ 240
Entry limit ~239 to 237 (Avg. - 238) on May 05, 2025
1. Target limit ~ 247 (+3.78%; +9 points)
2. Target limit ~ 251 (+5.46%; +13 points)
Stop order limit ~ 232.5 (-2.31%; -5.5 points)
Disclaimer: Investments in securities markets are subject to market risks. All information presented in this group is strictly for reference and personal study purposes only and is not a recommendation and/or a solicitation to act upon under any interpretation of the letter.
LEGEND:
{curly brackets} = observation notes
= important updates
(parentheses) = information details
~ tilde/approximation = variable value
-hyphen = fixed value
