No Change for EURUSDEURUSD continues its sideways movement above 1,1300, and there is no change in the outlook.
The trend remains bullish, but we might see a correction toward the next support levels first.
These levels, determined by Fibonacci retracement and previous highs, are 1,1253, 1,1183, and 1,1055.
Tomorrow, the first USD-related news releases are scheduled, which could have an impact, followed by the NFP data on Friday.
Fundamental Analysis

EUR/USD short: Will Moby Dick drag down the global economy?Hello traders
The allegory of our current global economy and Moby Dick, the rare white whale, hunted by the obsessed Captain Ahab, is not one I am writing about in a light hearted manner.
A refresher: Moby Dick(China) bites off Captain Ahab's(USA) leg and is subsequently relentlessly hunted by the obsessed captain who wants revenge. At the conclusion of the novel, Captain Ahab is oh, so close to killing the elusive whale but gets entangled in the rope of the harpoon and is dragged down to his own watery death by the wounded whale.
Moral of the story? Moby Dick is a classic American novel and China has not eaten the USA's lunch. I do not see any winners in this tariff war but rather the distinct possibility of a global recession and potential melt down like 2008/2009.
At the heart of this conundrum is DJT's obsession with trade balance going back to his first term. The irony being, the 2018 trade imbalance was the biggest ever under his watch.
I love these magnificent United States more than anything but let's get real. DJT won his second term on the persistent high inflation after COVID-19 and immigration not because we, as privileged Americans are suffering as the richest country on the planet(except for Swiss citizens). While I also support regulated immigration, we as Americans, do not want to perform the "menial" jobs that migrants are willing to do. My ancestors survived WW1, WW2, the dust bowl, the Great Depression and every subsequent calamity but never lost track of the integrity in ANY job that feeds a family.
There is a lot of whining about losing manufacturing jobs to China but I dare anyone who feels that they have missed out on a job opportunity to go and pick oranges in the blazing Florida sun with a 50 pound bag on the back or work a low paid job in a sneaker manufacturing facility.
Let's not forget what drives the USA economy: the consumer. We have benefitted from cheap/inexpensive Chinese labor and goods for a long time and will feel the pain if this tariff war is not resolved in a realistic manner. China's currency manipulation has always been geared towards boosting their exports and I do not foresee that policy changing anytime soon.
China is denying that any trade talks are happening and there is increasing day light visible between DJT and his Cabinet members. Bessant won't confirms trade negotiations and Rubio claims not to know what DJT's stance is towards Russia/Ukraine.
It all comes down to DJT's obsession with the white whale, China. Who will blink first? I do not know but this zero sum game is dangerous and could potentially plunge the entire global order into a crisis the likes of which will dwarf WW2 and 2008/2009.
I have initiated a short EUR/USD position at 1.1420 with an eye toward 1.0958 or lower. I am not claiming that the divestment in USA assets has run its course but at this point, I am inclined to reaffirm my belief in American exceptionalism but not in leadership. At this point, the Euro Zone still stands to lose more than the USA, especially in the light of tepid German economic performance and the unresolved Ukraine/Russia war.
There has been a lot of smoke and mirrors during the first 100 days with a flurry of executive orders to fight the woke culture, annex sovereign territories etc. but as human beings, we all have a need and right to shelter, food, clean water and air and the ultimate, the pursuit of happiness. And happiness goes right out the window when the aforementioned rights are not met or satisfied.
So, here lies the Moby Dick moment. Will DJT's obsession with tariffs and power drag us all down? Distinct possibility...
Thank you for listening to my two cents and best of luck with your trades. How you draw the distinction between noise and trading signals, is up to your own analysis. I can only speak for my own bank account and capital but tread lightly through this minefield that should never have happened in the first place.

Daily Analysis- XAUUSD (Tuesday, 29th April 2024)Bias: Bullish
USD News(Red Folder):
-JOLTS Jobs Opening
Analysis:
-Strong pullback on asian session
-Looking retest to 0.236 fib level
-Potential BUY if there's confirmation on lower timeframe
-Pivot point: 3300
Disclaimer:
This analysis is from a personal point of view, always conduct on your own research before making any trading decisions as the analysis do not guarantee complete accuracy.

A market setting up.Monday in the S&P 500 daily chart indicates that buyers bought the break in this market setting up a bullish bias in a week that is filled with economic and equity reports which create a tremendous amount of uncertainty.

EURUSD scenario 28:04/2025English : According to our analysis, we anticipate a BULLISH scenario.
Morocan Darija : kanchofo d'apres l'analyse dyalna antsanaw TLOO3
ATENTION : I only share my ideas, not signals

Bull in a China Shop. The S&P 500 Index After 100 Days of TrumpPresident Donald Trump's first 100 days in office were the worst for the stock market in any postwar four-year U.S. presidential cycle since the 1970s.
The S&P 500's 7.9% drop from Trump's inauguration on Jan. 20 to the close on April 25 is the second-worst first 100 days since President Richard Nixon's second term.
Nixon, after taking office as President of the United States (for the second time) on January 20, 1973, witnessed the S&P 500 index fall by 9.9% in his first 100 days in office, due to the unsuccessful economic measures he took to combat inflation, which led to the recession of 1973-1975 when the S&P 500 index losses of nearly to 50 percent.
It all started in January 1973 in the best soap opera traditions of Wall Street, at the historical peaks of the S&P 500 index..
..But less than two years later it quickly grew into a Western with a good dose of Horror, because the scenario of a 2-fold reduction of the S&P 500 index was unheard those times for financial tycoons and ordinary onlookers on the street, since the Great Depression of the 1930s, that is, for the entire post-war time span since World War II ended, or almost for forty years.
Nixon later resigned in 1974 amid the Watergate scandal.
On average, the S&P 500 rises 2.1% in the first 100 days of any president's term, according to CFRA, based on data from election years 1944 through 2020.
The severity of the stock market slide early in Trump's presidency stands in stark contrast to the initial "The Future is Bright as Never" euphoria following his election victory in November, when the S&P 500 jumped to all-time highs on the belief that Mr. Trump would shake off the clouds, end the war in Ukraine overnight, and deliver long-awaited tax cuts and deregulation.
Growth slowed and then, alas, plummeted as Trump used his first days in office to push other campaign promises that investors took less seriously, notably an aggressive approach to trade that many fear will fuel inflation and push the U.S. into recession.
The S&P 500 fell sharply in April, losing 10% in just two days and briefly entering a bear market after Trump announced “reciprocal” tariffs, amid a national emergency that gave him free rein to push through tariffs without congressional oversight.
Then Trump began yanking the tariff switch back and forth, reversing part of that tariff decision and giving countries a 90-day window to renegotiate, calming some investor fears.
Many fear more downside is ahead.
Everyone is looking for a bottom. But it could just be a bear market rally, a short-term bounce of sorts.
And it's not certain that we're out of the woods yet, given the lack of clarity and ongoing uncertainty in Washington.
Time will tell only...
--
Best 'China shop' wishes,
@PandorraResearch Team


Relative Strength in Individual NamesTJX has been basing for 5+ Months near it's ATH.
Despite the market conditions the past 2 months this held up really well.
We broke up out of the base just to pullback below it. I think a lot of traders are frustrated after the FBO and now we can curl up back above it and really get going.
This has stellar QoQ earnings growth and Sales growth.
Coming off an inside day looking for a move back above $128.
Entry: $127.04 Add: $128.12
Stop: $125.11
Target: $143

LNG LongLNG has been basing for 3+ months near its ATH.
It is coming off 2 back to back inside days.
QoQ earnings growth $3.84 $3.93 $4.33
We got a nice shakeout below $200 stopping out a lot of investors and now its trading back above all it's key moving averages.
Entry: $234.71 add: $236.35
Stop: $229.62 - $230.65
Target: $257

ETHBTC x ETH.DETHBTC x ETH.D
Ethereum bitcoin pair and ethereum dominance will gain upward momentum with the reaction it receives from the major support line in 2019
The better Ethereum is, the better Altcoins will be.

[ETH] New Investment OpportunityThis is for me a new investment opportunity on CRYPTOCAP:ETH for the next bullrun. We see this crypto struggling a lot to pump and I am honestly not the biggest CRYPTOCAP:ETH fan as I am huge CRYPTOCAP:SOL fan but here is still an opportunity for me.
Great Trade !

No Guessing. No Praying. Just Precision — Smart Money Moves Only📆 XAUUSD Daily Plan – April 29, 2025
🔥 Macro & Market Context:
Gold continues its tactical chess game between premium supply traps and reactive support zones.
Price is currently hovering around 3342, teasing a breakout or another trap inside the 3340–3355 resistance block.
Tomorrow we also have important USD news: 🔵 CB Consumer Confidence
🔵 JOLTS Job Openings
Expect potential volatility during NY session — stay adaptive, not predictive.
🎯 Bias Overview:
HTF Bias (H4–Daily): Bullish (Higher Highs and Higher Lows structure still intact)
LTF Flow (M15–H1): Corrective bullish retrace inside HTF uptrend
📍 Key Levels to Watch:
🔺 Resistance Zones:
3340–3355 → Minor Premium Resistance (currently being tested)
3372–3376 → Strong Trap Sell Zone (next immediate target above)
3380–3390 → Major Liquidity Pool (big decision area if price pumps further)
🔻 Support Zones:
3284–3288 → Intraday Demand + Bounce Zone
3233–3237 → HTF Major Reversal Demand
🎯 Refined Sniper Zones:
🟩 Buy Zone #1: 3284–3288
(H1 demand cluster + previous clean reaction)
🟩 Buy Zone #2: 3233–3237
(Deep HTF OB + untapped liquidity anchor)
🟥 Sell Zone #1: 3372–3376
(M15–H1 OB + liquidity trap setup)
🟥 Sell Zone #2: 3380–3390
(Premium supply and major liquidity sweep)
👀 Eyes On:
Reaction at 3372–3390: Weak rejections = tactical sell opportunities.
Respect for 3284–3288: Bullish continuation if defended strongly.
Violation below 3230: HTF momentum shift possible toward deeper discount.
📢 Final Message:
Gold’s setting traps for both bulls and bears — but we’re hunting precision, not chaos. 🏹
Patience = Power.
Confirmation = Survival.
🔥 Trading Focus Tip:
"First wicks grab liquidity. First breakouts fool emotions.
We wait for the second reaction — that's where the sniper eats."
If this map helps you stay focused, smash that ❤️ and follow, drop your thoughts below, and let's trade the smart flow together! 🚀✨

Do you guys even know how to bull?This isn't a place to panic.
This is where real buyers start loading.
Volume is talking. Price structure is shifting.
Weak hands cry. Quants position.
Adapt or get trampled.
#FIL #Crypto #QuantMindset

Gold prices bottomed out and rebounded, market trend analysis.Analysis of gold trend: From the perspective of market sentiment, interest-free gold as a safe-haven asset has performed strongly this year, with prices soaring by nearly $700 and hitting record highs several times. However, the recent optimistic expectations of easing global economic and trade relations have boosted market risk appetite, and the equity market has generally performed positively. Some funds have flowed out of safe-haven assets such as gold and turned to risky assets, which is also the main psychological factor under pressure on gold prices. If market risk appetite continues to improve, global economic and trade relations further ease, and the US dollar strengthens, gold prices may face greater downward pressure. From a technical point of view, the gold price needs to effectively fall below the $3,265-3,260 range in the short term before a larger correction downward may be confirmed. Once confirmed to fall below, the gold price may quickly fall to the 50% retracement level near $3,225, further pointing to the $3,200 mark. If $3,200 is lost, it will suggest that gold may have peaked in the short term.
Gold opened higher in the Asian session on Monday and continued to fall last week after hitting 3336. The idea of the Asian session was to directly bearish at the analysis point of 3277. After hitting the lowest point of 3268, it fluctuated upward. The European session also fell to 3273 and then rebounded. The highest point in the US session just reached 3336 again, a standard bottoming and rebounding trend. Since it is an adjustment structure, let's re-analyze the idea. The gold price fell at 3500 and rebounded at 3260 last Wednesday. The rhythm was volatile. It rebounded above 3260 many times below and did not cross the first rebound high of 3367 above.
Today, we mainly focus on the closing price. If it stands firmly at the 3313 line, we will adjust our thinking on Tuesday. On the contrary, it will fall back after encountering resistance at 3336, today's opening high, and go to 3278. On Tuesday, we will continue to look at the idea of swinging and falling. Now it is the end of the market, and the market is also falling from a high.

GOLD → The chances of a further decline are growing...FX:XAUUSD continues to test support at 3270 for a breakout. Any de-escalation of the conflict between the US and China could trigger a price drop. But it's not that simple...
Gold under pressure amid tariff war and ahead of US data
On Monday, gold is testing last week's low of $3260, remaining under pressure from a strengthening dollar and easing trade risks between the US and China.
Investors are preparing for the release of key US GDP and labor market data, which could influence expectations for Fed rates. Against this backdrop, the correction in gold could be replaced by growth if macro statistics turn out to be weak and geopolitical risks remain.
Another retest of support could trigger a breakout. It is necessary to monitor the situation between China and the US. Any de-escalation will trigger a decline.
Resistance levels: 3299, 3326
Support levels: 3268.9, 3245, 3232
Since the opening of the session, the potential for a further decline has been exhausted. Gold may strengthen to the indicated resistance zones. A false breakout of 3300/3326 could trigger a decline, which could bring the price closer to the support breakout of 3270.
With respect, R. Linda!

SHIB/USDT Confirmation for Buy Trend ContinuationOn the 4-hour timeframe, we are in a buy trend, and the price has approached the buy GWS, where we are monitoring for a possible continuation of the buy trend. We need to wait for the price to react at the buy GWS and form a confirmation for the continuation of the buy trend. By waiting for confirmation from the market, we aim to avoid a potential false breakout.

ATOM/USDT review chart 4HHello everyone, let's look at the 4H ATOM chart for USDT, in this situation we can see how the price has affected from the upper limit of the downward trend channel, however, staying in the upper part of the channel. Going further, let's check the places of potential target for the price:
T1 = $ 4.79
T2 = $ 5,26
Т3 = 5.63 $
Let's go to Stop-Loss now in case of further declines on the market:
SL1 = $ 4.29
SL2 = $ 4.02
SL3 = $ 3,57
Looking at the RSI indicator, you can see a healthy relaxation crossing the lower limit, which produces space for a potentially new growth movement. The MacD indicator that has returned to the center of the range, which also creates potential for upward movement.

XAUUSD Weekly-Daily-H4 Outlook – April 28, 2025"Gold’s Game: Range Trap... or Breakout Incoming?" 👀⚡
🔥 Macro + Micro Context:
Macroflow: No major macro catalysts today — market sentiment driven mostly by technicals, liquidity behavior, and late-week reactions.
Bias:
HTF (D1–W1): Still bullish-biased long-term, unless 3220–3235 breaks cleanly.
LTF (H4–M30): Currently trapped in a wide distribution range 3380–3260, showing signs of both liquidity sweeps and engineered traps.
Liquidity Dynamics:
Both upside and downside liquidity have been targeted multiple times. Equal highs/lows patterns forming, suggesting fakeouts are highly probable before any real move.
📈 STRUCTURAL RANGE:
🔵 Main Range:
• Top: 3380–3395 → major flip zone (premium side)
• Bottom: 3260–3280 → major demand zone (discount side)
📚 Inside the range:
• Liquidity is being farmed on both sides — expect fake spikes, stop hunts, and whipsaw moves before breakout.
🔑 H4 Key Zones (Above Current Price):
Level Type Notes
3380–3395 Major Supply + Flip Zone HTF orderblock + FVG + previous sell trap
3410–3415 Minor Supply Zone M30–H1 imbalance + small FVG
3448–3455 Major Premium Supply HTF OB + FIBO 1.618 extension + historical premium trap
3490–3500 ATH Area Strong psychological level + institutional interest
🔑 H4 Key Zones (Below Current Price):
Level Type Notes
3260–3280 Major Discount Demand Strong H1-H4 unmitigated OB + liquidity grab zone
3220–3235 HTF Reversal Demand Last HTF pivot for bullish bias
📊 Expected Scenarios:
Bullish Path:
Hold 3260–3280 → Break 3380–3395 → Target 3415 → Then 3450–3500 range sweep.
Bearish Path:
Fail at 3380–3395 → Sharp rejections back into 3280 → Potential crash toward 3235 and 3210.
👀 EYES ON:
Watch the 3380–3395 flip zone closely.
If price fails there with heavy wicks and low volume, bulls are trapped again.
If price holds above 3395–3415 cleanly, bulls regain control for 3450+.
🧠 FINAL MESSAGE:
"The best traders don’t predict. They prepare."
"Trap or breakout — it’s all about reaction, not prediction. Stay sharp, stay liquid, and don’t chase the donkey moves."
🔔 Follow for real-time smart updates
💬 Comment your bias below: bull 🐂 or bear 🐻? Let’s grow the community together!
#Gold #XAUUSD #TradingView #SmartMoney #RangeTrap #GoldOutlook

Economy - Moving ForwardWhat's expected of the economy?
For 2025, the stock market started strong, the three major U.S. indexes soared to its all-time highs, putting confidence in retail investors.
End of Q1, we've seen a shift in the market due to tariffs and the start of a trade war. Why are the tariffs bad for the U.S. economy?
The biggest problem with tariffs is that it could drive higher prices in consumer goods through "taxes" in imported goods. It also causes disruption in supply chain, slower economic growth, retaliation from foreign countries, etc. The economic data also shows signs of a possible recession.
Not everything is lost.
Asian countries such as Japan, Korea, and Indian are taking in the lead in trade talks with Donald Trump. China has given exemptions to certain U.S. goods in order to ease the trade war, leading to a potential trade talks with the economy giants, the U.S. The 90 day reciprocal tariffs are also an opening for talks.
Let's see how it goes.

XRP GETS THE ETF APPROVAL!✨ Hey hey, hope all is well, happy to be here with some good news as I'm sure many of you have heard as well, we knew this week could be intense but this is great to see, and without further delay, we'll give the quick rundown.
✨ Yesterday the 27th the U.S. Securities and Exchange Commission Approved three XRP ETFs from ProsShares which is an issuer of ETFs. The ETF's will be three XRP-tracked ETFs as listed: an Ultra XRP ETF, an Ultra Short XRP ETF and a normal short XRP ETF. So basically two ETF's with x2 leverage for the long and shorts and one normal ETF for basic shorts.
✨ Also to note is that the SEC has yet to approve ProShares separate application for a Spot XRP ETF so their still waiting on that approval alongside other asset managers with other XRP spot fund applications such as 21Shares and Grayscale so it seems the SEC is still waiting to approve any direct spot futures on XRP so when that does happen it'll no doubt boost price action and bolster sentiment. I've also added a reference link below to an article on the ETF's for anyone who'd like to read more into the matter.
www.theblock.co
✨Below we'll also take quick look at our technical analysis for the day highlighting a new channel that's formed since we last broke out of our descending channel.
✨As the chart demonstrates, we can see that traders managed to avoid falling below the horizontal channel we spoke on last time and that combined with the ascending channel that's formed and this ETF news has really helped XRP rally back up already over 6% for the week so happy to see the development and the S&P 500 itself has been rallying the last week so that's helped too.
✨ I'll leave the idea here for now, we mainly just have to watch that ascending channel for price action and hope traders can keep price within the channel and continue pushing, especially with the ETF news to help, so keep watch for that on the technical, watch news for the beyond technical and keep posted with me for more updates of course!
✨ As always, thank you so much for all the support, really appreciate you guys and let's keep at it, things will work out.
Best regards,
~ Rock '

Bitcoin surpasses Google: Why BTC rallied to $94,000In April 2025, Bitcoin once again captured the spotlight by breaking above $94,000, reaching a market capitalization of $1.86 trillion. This surge pushed BTC ahead of Alphabet (Google’s parent company), making it the fifth-largest asset in the world.
The impressive rally in Bitcoin this year has been fueled by a combination of macroeconomic factors and developments within the crypto space itself. New financial instruments, political shifts, and technological advancements have made Bitcoin more appealing and accessible to a wide range of investors.
5 key drivers behind Bitcoin’s growth in 2025:
1. Approval of spot Bitcoin ETFs in the U.S.: For the first time, the SEC greenlit spot Bitcoin ETFs, allowing major institutional players to gain exposure through regulated investment products. This triggered a significant inflow of capital into the crypto market.
2. Weakening dollar and stock market declines: As global economic growth slowed and the U.S. dollar lost ground, Bitcoin emerged as a hedge asset — often compared to gold — with investors seeking safer alternatives to traditional markets.
3. Pro-crypto political climate in the U.S.: The new U.S. administration has adopted a supportive stance on crypto, easing regulations and even announcing plans to build national crypto reserves. This strengthened investor confidence across the market.
4. Bitcoin’s growing role as ‘Digital Gold’: The perception of Bitcoin as a long-term store of value continues to rise. More large investors and corporations are now including BTC in their asset diversification strategies.
5. Technological advancements: The rollout of second-layer solutions like the Lightning Network has made Bitcoin transactions faster and cheaper. This has improved real-world usability and expanded the global user base.
In 2025, Bitcoin continues to gain momentum, breaking new records and cementing its role as one of the world’s most important financial assets. The combination of spot ETF approvals, political backing, macroeconomic shifts, and ongoing tech innovation has created fertile ground for its growth. With each passing day, BTC becomes increasingly attractive to both institutional and retail investors — setting the stage for further gains in the coming years.
Still, Bitcoin’s future will depend on how crypto regulations evolve, the pace of technological breakthroughs, and global economic conditions.

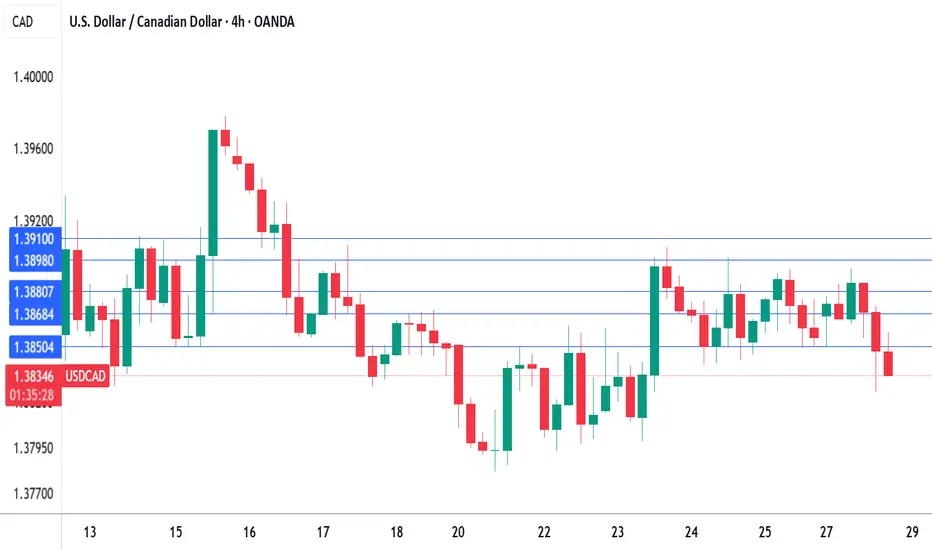
Canadian dollar in holding pattern on Election DayThe Canadian dollar is showing limited movement on Monday. In the European session, USD/CAD is trading at 1.3868, up 0.10% on the day. There are no economic releases out of the US or Canada today.
It's Election Day in Canada. Prime Minister Mark Carney, who has only been in office since March, is favored to win the election. Carney's Liberal Party was badly trailing the Conservatives but US President Trump has ignited Canadian nationalism and turned the election race upside down.
Trump has talked about annexing Canada and although most Canadians don't expect that to happen, there is strong resentment against the US tariff policy, which has hit Canada even though the two countries have a free trade agreement.
Carney is viewed as a strong leader who can stand up to Trump and the markets have priced in a Liberal majority. If the Liberals are forced to make a coalition with the smaller parties, the new government would be considered less stable and that would likely trigger some CAD weakness. If the Conservatives manage to pull out a surprise election victory, the Canadian dollar would likely get a boost.
Canada's retail sales declined 0.4% m/m in February but bounced back in March with a strong gain of 0.7%. On an annualized basis, retail sales slipped to 4.7% in February, down from a revised 5.3% in January.
The improvement in March was driven by consumers making purchases ahead of US tariffs, but consumer spending is likely to deteriorate. The Bank of Canada will be keeping a close eye and will have to consider further rate cuts if upcoming economic data is weak. The BoC maintained the cash rate at 2.75% earlier this month and meets next on June 4.
USD/CAD is testing resistance at 1.3868. Above, there is resistance at 1.3880 and 1.3910
1.3850 and 1.3838 are the next support levels
ATOM / USD🔹 Current price: $4.46
ATOM is trading below its averages and indicators are showing a reversal. I expect short-term gains, especially given the fundamental improvements.
Fundamental Factors:
• Activation of the IBC protocol in February 2025, providing interoperability with Ethereum and BSC.
• Expanding the ecosystem through Interchain Security and launching new applications.
