XAUUSD – Daily Trading Plan – April 28, 2025🎯 Market Outlook:
Gold remains trapped in a corrective range between 3260 and 3380, after an aggressive rally to new all-time highs.
Currently, price is consolidating just below a major supply/flip zone (3380–3395) and above a key support pocket (3260–3280).
HTF (High Timeframe) bias: Still bullish as long as the 3220–3235 pivot holds.
LTF (Lower Timeframe) flow: Sideways, with minor bullish attempts inside the range.
🔥 Key Zones to Watch:
Resistance Zones:
3380–3395 → Major flip and strong resistance zone.
3350–3360 → Minor local resistance inside premium.
Support Zones:
3260–3280 → Major intraday support + liquidity pocket.
3220–3235 → Last pivot to maintain bullish HTF bias (critical for any continuation).
👀 Eyes On:
Price reaction inside 3380–3395 → Will it reject again or break through to unlock 3410–3430?
Weakness signs near 3350–3360 → Watch for potential bull traps if momentum fades.
Respect for 3260–3280 → A bounce from here would confirm buyers still protecting liquidity pockets.
HTF invalidation below 3220 → Would flip the entire structure bearish short-term.
📢 Final Words:
Goldie's playing chess, not checkers — patience and sniper precision will make the difference this week. ♟️✨
Stay sharp, stay smart — we trade real flow, not hopes or dreams.
🔔 Follow the flow, adapt the plan, and let's continue hunting clean moves together!
#Gold #XAUUSD #SmartMoney #MindsetMatters #GoldMindsFX
Fundamental Analysis


#XAUUSD:From Our Last Analysis 534+ Pips What Next?We published our analysis on gold on April 24th, highlighting the bullish market presence. The price indeed reversed from our zone, enabling us to make a significant move of over 234 pips. We anticipate a continuous price increase from our entry zone, potentially reaching 3500$. There are several reasons behind this belief. Firstly, the escalating war-like tension between India and Pakistan could lead to a surge in gold prices, potentially surpassing the previous high. Secondly, the heightened tensions among global investors are expected to result in an extreme bullish movement in gold prices.
Given the volatility of gold, we recommend trading cautiously and taking extra precautions while trading gold.
Wishing you good luck and safe trading!
Thank you for your support! 😊
If you’d like to contribute, here are a few ways you can help us:
- Like our ideas
- Comment on our ideas
- Share our ideas
Team Setupsfx_
❤️🚀

Opportunity Beneath the Fear: SPY's Reversal SetupIn the Shadow of Headlines: SPY’s Drop Could Be 2025’s Big Opportunity
As markets react sharply to renewed tariff fears and Trump-related headlines, SPY continues its descent. Panic is setting in—but behind the noise, a strategic opportunity may be quietly forming.
While many rush to exit, others are beginning to position for the bounce. A well-structured entry strategy could be key to turning uncertainty into gains.
Entry Zone (Staggered):
🔹 543: First watch level—look for signs of slowing momentum.
🔹 515: Deeper entry point as the selloff extends.
🔹 <500 (TBD): Stay flexible—if panic accelerates, this could mark a generational setup.
Profit Targets:
✅ 570: Initial rebound target.
✅ 590: Mid-range level if recovery builds.
✅ 610+: Full recovery potential—rewarding those with patience and vision.
Remember: Headlines fade, but price action and preparation stay. This selloff may continue—but it might also be laying the foundation for 2025’s most powerful move. The key? Enter with discipline, protect your capital, and let the market come to you.
⚠️ Disclaimer: This content is for educational purposes only and does not constitute financial advice. Trading carries significant risk. Always conduct your own research and use proper risk management.

Coinbase Global (COIN) – Bridging Crypto and Traditional FinanceCompany Snapshot:
Coinbase NASDAQ:COIN is cementing its role as the gateway to the crypto economy, offering secure trading, custody, and institutional-grade financial services—positioning itself for expansion well beyond retail.
Key Catalysts:
Bank Charter Ambitions 🏦
Exploring a bank charter, potentially evolving into a full-service financial institution
Would diversify revenue and boost regulatory credibility, key in the maturing crypto sector
Institutional Growth Momentum 📈
Extending credit to major players like CleanSpark
Building sticky, high-value relationships and reducing retail dependency
Strengthening Financials 💰
14.8% pre-tax margin
39.16% profit contribution margin → Clear operating leverage and path to sustainable, scalable profitability
Trusted Brand Advantage 🛡️
Strong institutional trust + regulatory compliance reputation → defensible moat in a volatile industry
Investment Outlook:
✅ Bullish Above: $160.00–$162.00
🚀 Target Range: $280.00–$290.00
🔑 Thesis: Regulatory expansion + institutional scale-up + financial efficiency = long-term crypto-finance powerhouse
📢 COIN: Not just a crypto exchange—an evolving financial institution for the digital future.
#CryptoFinance #Coinbase #DigitalAssets #Fintech #InstitutionalGrowth #BankingFuture

MSTR.....down down she goes (MSTZ inverse!)MSTR just hit the top of the Bollinger band and all the hot air is coming out (quickly). Let's see where this lands, but nice to time to load up on MSTZ IMHO.....
Best of luck and always do your own due diligence!

GOLD falls more than 40 Dollars, widening correction rangeSpot OANDA:XAUUSD unexpectedly accelerated its decline during the Asian trading session on Monday (April 28). The current price of gold is around 3,280 USD/ounce, down more than 40 USD on the day. The price of gold has gradually decreased compared to the intraday high of 3,336.98 USD/ounce reached at the beginning of the trading session.
The easing of trade tensions between China and the United States has weakened gold’s appeal as a safe haven. Gold prices have fallen more than 5% since breaking above $3,500 an ounce last Wednesday.
The latest developments around US-China trade relations and the release of key US macroeconomic data will trigger gold’s near-term price action. Market participants will be closely watching US economic growth and employment data this week.
The latest data from the US Commodity Futures Trading Commission (CFTC) showed that hedge fund managers cut their net long positions in gold futures and options to a 14-month low.
Technical Outlook Analysis OANDA:XAUUSD
On the daily chart, gold has dropped below the raw price of $3,300 and at its current position it could continue to decline further with a short-term target of around $3,245 where the price confluences with the upper edge of the price channel.
Although gold has fallen significantly from $3,500, looking at the overall chart, gold still has bullish conditions with support from EMA21 and the rising price channel as the long-term trend. On the other hand, the down trending RSI is also approaching the 50 level, in this case the 50 level is the closest support at present, indicating that there may not be much room for decline in the short term.
Once gold is back in action above the 0.382% Fibonacci retracement level, it will be in position to rebound with a target of around $3,371 in the short term.
During the day, the bearish correction could continue but will be limited by the EMA21 and the price channel. Along with that, the bearish correction along with the main uptrend will be noticed by the following technical positions.
Support: $3,245 – $3,228 – $3,200
Resistance: $3,292 – $3,371
SELL XAUUSD PRICE 3328 - 3326⚡️
↠↠ Stop Loss 3332
→Take Profit 1 3320
↨
→Take Profit 2 3314
BUY XAUUSD PRICE 3226 - 3228⚡️
↠↠ Stop Loss 3222
→Take Profit 1 3234
↨
→Take Profit 2 3240

ES Futures: Upcoming Mag 7 Earnings and NFP Report
This week, although there was not much market-moving macro newsflow over the weekend, we are approaching month-end. In addition, several key catalysts are on the horizon, including earnings from the Magnificent 7 and the release of Non-Farm Payrolls (NFP) data, which typically arrives on the first Friday of the month.
The Federal Reserve is currently in its blackout period ahead of the interest rate decision scheduled for May 7th, 2025.
As part of our process, we will be reviewing technical levels and drawing a plan based on current market structure. ES futures are currently trading above the March 2025 lows. A “death cross” — where the 50-day moving average crosses below the 200-day moving average on the daily timeframe — was recently observed. This pattern is commonly touted by analysts as a bear market indicator.
However, in a macro-driven environment, this could potentially be a false signal.
Key Levels:
• mCVAL: 5622
• Upper Neutral Zone: 5620 -5585
• March 2025 Low: 5533.75
• 2022 CVAH: 5384.75
• Lower Neutral Zone: 5171.75 -5150.75
Our scenarios are as follows:
Scenario 1: Range-bound price action
A P-shaped micro composite profile suggests resistance at our neutral zone. It is labeled neutral because the price is trading above the March 2025 lows. However, if the level above acts as resistance, we expect further range-bound price action. Markets may trade below the mCVAL for further price discovery and potentially establish a new short-term range, with the 2024 lows acting as downside support.
Scenario 2: Mag 7 and NFP as bullish catalysts
Four of the Magnificent 7 companies are reporting earnings this week. The Mag 7 collectively represent around one-third of the S&P 500 index by market capitalization. Microsoft and Meta are scheduled to report on Wednesday after the close, while Amazon and Apple report on Thursday after the close.
On Friday, the NFP data will be released. This could serve as a fundamentally net-positive catalyst for U.S. markets, especially in light of recent shocks that have weakened sentiment.
In this scenario, we will be closely watching our neutral zone and mCVAL as potential areas to initiate long trades.
Glossary Index for all technical terms used:
Blue Zones: Neutral zones.
C: Composite (prefix before VAL, VAH, VPOC, VP, AVP)
mC: micro-Composite (prefix before VAL, VAH, VPOC, VP, AVP)
VAL: Value Area Low
VAH: Value Area High
VP: Volume Profile
CME_MINI:ES1!

SELL GBPJPYscalping setup, there is uptrend behaviour but the price has reached the resistance and sellers may push it down. We may short with caution

OIL sell setup H1Hello! Friends,
Greetings. Please leave a Like if you like the idea.
Before start talking about technical Let's share your LOVE by giving me LIKES to support this work. Thanks in advance.

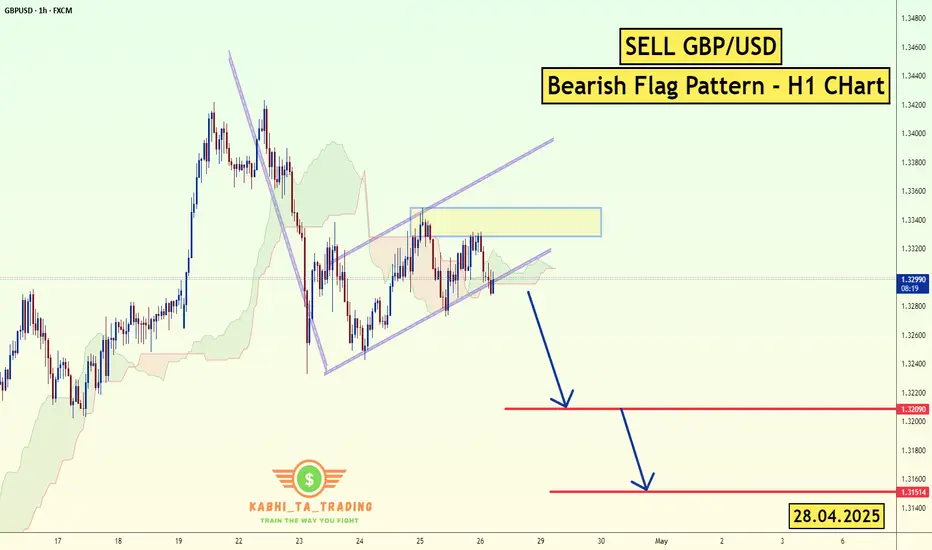
GBP/USD - H1 - Bearish Flag (28.04.2025)FX:GBPUSD The GBP/USD Pair on the H1 timeframe presents a Potential Selling Opportunity due to a recent Formation of a Bearish Flag Pattern. This suggests a shift in momentum towards the downside in the coming hours.
Possible Short Trade:
Entry: Consider Entering A Short Position around Trendline Of The Pattern.
Target Levels:
1st Support – 1.3209
2nd Support – 1.3151
🎁 Please hit the like button and
🎁 Leave a comment to support for My Post !
Your likes and comments are incredibly motivating and will encourage me to share more analysis with you.
Best Regards, KABHI_TA_TRADING
Thank you.
Fundamental Update :
on Monday as the trade tensions between the U.S. and China provided some relief to investors, while a stronger dollar further weighed on prices.
The U.S. dollar TVC:DXY rose 0.2% against a basket of currencies, making bullion more expensive for overseas buyers. TVC:DJI SP:SPX NASDAQ:IXIC also rising .
Gold shocks pull the trend towards the bearish side!Gold market trend analysis:
Gold technical analysis: You should have seen the exaggeration of gold, right? Gold has also experienced several major ups and downs in history, but this time is definitely one that can be recorded in the history books. The daily lines in the past few months are very exaggerated, and the rise and fall range is unprecedented. Just today's Asian market, a simple dive is dozens of points. This is the market. The market is always right. We need to respect it the most, rather than blindly look at it subjectively. Surviving in such a big market is the most important thing. Many times, the fluctuation of gold is basically not related to technicality. We try to follow the direct pursuit mode in operation, and we can catch big profits in such a big market. Last week, the weekly line closed with a big tombstone, the weekly line top appeared, and the air force appeared. In May, gold will at least adjust to around 3,000.
The above is the 4-hour pattern, which is repairing below the moving average. If the bulls break 3370 again, there is a possibility of rising again. Otherwise, gold will adjust deeply again. This wave of adjustment is at the weekly level. The daily pattern is also turning into a peaking mode. Note that the rise and fall of gold is not based on technical aspects, but more on fundamentals and big data, as well as the impact of tariffs. Without these influences, we will be bearish this week. If the decline of the big C wave continues, the target will be 3230 (the half point of the entire April rebound) in turn. 3165 is the Fibonacci 61.8 position of the callback and also the previous high point, which is easy to form a rebound. Today's gold focuses on two major suppressions, one is the hourly suppression around 3300, and the other is 3315 and 3328, both of which are opportunities for air forces. On the whole, today's short-term operation strategy for gold is to short on rebounds and to buy on pullbacks. The upper short-term focus is on the 3298-3300 resistance line, and the lower short-term focus is on the 3265-3260 support line. Friends must keep up with the rhythm. It is necessary to control the position and stop loss, set stop loss strictly, and do not resist single operation. The specific points are mainly based on real-time intraday trading. Welcome to experience, exchange real-time market conditions, and follow real-time orders.

next 9 days...There's still complete chaos in NASDAQ:GERN , but the quarterly report is approaching, and the market is running out of time to ignore the stock's true valuation. Let's see what happens in the next 9 days. In my view, the chart currently looks like this. A return to the mean looks very promising...

Gold-Silver Ratio: Silver’s Lag and Historical DivergencesThe gold-silver ratio - the number of silver ounces equals in value to one ounce of gold – has surged recently as gold prices rally while silver underperforms. Gold, a traditional safe-haven, has climbed to record highs amid economic uncertainty, whereas silver, which is partly an industrial commodity, has struggled to break past $35/oz. As a result, the ratio is around 100 – meaning gold is ~100 times the price of silver despite the correction in the ratio from its peak around 125.
For context, the ratio averaged 57 from 1975-2000, and between 2000-2025 the ratio has ranged from 32 and 125 (with the max level reached this month with an average of 68. The ratio has observed extreme spikes in unusual crises).
Today’s elevated ratio highlights the divergence between gold’s sharp rally and silver’s lagging performance. The 25-year mean of the ratio is at 68, suggesting the present levels (100) represent an extreme deviation in favour of gold.
Historical Parallels in Gold-Silver Divergences
Similar wide divergences between gold and silver have occurred in the past. Key historical episodes illustrate how silver eventually played “catch-up” after lagging gold – albeit with varying lag times:
1970s – Silver’s Late Surge: After the U.S. abandoned the gold standard, gold prices soared while silver lagged. However, silver eventually staged a sharp rally later in the decade, quickly closing the gap and driving the gold-silver ratio sharply lower.
1980s – Prolonged Underperformance: Following the 1980 peak, precious metals collapsed, with silver suffering far more than gold. The gold-silver ratio surged and remained elevated through the 1980s and 1990s, as silver failed to catch up and largely moved sideways until the 2000s.
Early 2000s – Post-Recession Catch-Up: After the 2001 recession, gold began a
new bull market while silver initially lagged. Eventually, silver outpaced gold’s gains over the next several years, significantly narrowing the gold-silver ratio.
2008 Financial Crisis – Sharp Divergence and Recovery: The 2008 crisis caused gold to outperform sharply as silver collapsed. However, as the economy recovered, silver staged a dramatic rebound, quickly closing the gap and normalizing the ratio by 2011.
Why Is Silver Lagging Now? Industrial Demand Uncertainty
Roughly half of silver demand is industrial (electronics, photovoltaics, chemicals). Persistent worries about a global manufacturing slowdown and elevated inventories have capped silver’s upside just as investors have chased gold for geopolitical protection.
Source: Silver Institute
Worries about industrial demand have been exacerbated by the recent trade uncertainties which impact industrial sectors in an outsized manner.
By contrast, gold’s appeal as a safe haven has been boosted by geopolitical and inflation fears, driving it to record highs in 2025.
Despite cyclical swings, the underlying secular trend has crept higher for decades. Gold’s monetisation (central-bank reserves, ETF holdings surge) versus silver’s demonetisation, higher real production costs for gold, and silver’s growing industrial elasticity are all factors that represent a risk to normalization of the GSR.
Even a forceful mean-reversion might therefore stall nearer 60–70 than the sub-40 extremes of earlier cycles.
Hypothetical Trade Setups
History shows that once macroeconomic uncertainty clears, silver often recovers lost ground quickly. In previous periods of extreme gold-silver divergence, from the 1970s through 2008, silver staged strong rallies that pushed the gold-silver ratio (GSR) back toward normal levels.
Today, however, silver’s outlook remains clouded by uncertainty, particularly amid the ongoing trade war. Prices risk stalling below resistance around $35/oz. Consequently, the normalization in the GSR may instead result from a correction in gold prices. Gold has consistently broken record highs, and its long-term outlook remains firmly bullish. Nevertheless, concerns about the sustainability of the recent rally are valid - last week, gold fell sharply after setting a new high above $3,500/oz.
In summary, a normalization in the GSR could result from either a silver rally or a gold correction. While each path remains uncertain, a position focused on the ratio itself is relatively insulated from further divergence.
Given this environment, we could express our view in GSR through a long position in silver and a short position in gold. Investors can implement this using CME Micro Silver and Micro Gold futures. This setup benefits from 72% margin offsets. The Micro contracts balance the notional value between both legs by using one contract each.
A hypothetical trade setup consisting of a short position in CME Micro Gold futures expiring in June (MGCM2025) and a short position in CME Micro Silver futures expiring in June (SILM2025), offering a reward to risk ratio of 1.6x, is described below.
MARKET DATA
CME Real-time Market Data helps identify trading set-ups and express market views better. If you have futures in your trading portfolio, you can check out on CME Group data plans available that suit your trading needs tradingview.com/cme .
DISCLAIMER
This case study is for educational purposes only and does not constitute investment recommendations or advice. Nor are they used to promote any specific products, or services.
Trading or investment ideas cited here are for illustration only, as an integral part of a case study to demonstrate the fundamental concepts in risk management or trading under the market scenarios being discussed. Please read the FULL DISCLAIMER the link to which is provided in our profile description.

PAPL - Good epxectation for earnings, collect potential?Hi guys we would be looking into Paypal Today
Analysts maintain a "Moderate Buy" consensus on PYPL, with 17 buy, 17 hold, and 2 sell ratings. The average 12-month price target is $84.69, suggesting a potential upside of about 29.6% from the current price. Price targets range from $49 to $125.
Earnings Performance
In the most recent quarter, PayPal reported adjusted earnings per share (EPS) of $1.20, a 22% year-over-year increase, surpassing expectations. However, revenue grew by 6% to $7.85 billion, slightly below forecasts. Notably, PayPal has exceeded EPS estimates in each of the last four quarters.
Growth Initiatives and Strategic Outlook
Branded Checkout Enhancements: Efforts to improve user experience and competitiveness against rivals like Apple Pay
Venmo Monetization and Debit Card Expansion: Initiatives to increase revenue through Venmo and broader payment options.
Fastlane Guest Checkout: A new feature aimed at streamlining the checkout process, with significant monetization expected in 2025.
Valuation and Future Prospects
PayPal's current valuation at 14 times forward 2025 earnings is below its five-year average P/E of 50.5, indicating potential for multiple expansion. Forecasts suggest revenue could reach $35.1 billion in 2025, with EPS around $4.93.
Our Conclusion
Given its strategic initiatives, consistent earnings performance, and favorable valuation, PayPal appears poised for growth. While challenges like competition in digital payments persist, the company's focus on innovation and user experience may drive its stock price upward in the coming years.
📌 Trade Plan
📈 Entry: 65.50
✅ Target: 75.50 - Targeting the weak resistance
❌ SL: 55.50 - protecting the trade above the bottom zone

April 28, 2025 - Broken Supply Chains, and the DC CircusHello everyone, it’s April 28, 2025. The week ahead promises to be spectacular (or a complete disaster) depending on which way the wind blows out of Washington. So far, the futures are down about 0.6% this morning, as everyone’s trying to cut risk ahead of a week crammed with Big Tech earnings ( NASDAQ:AAPL , NASDAQ:MSFT , NASDAQ:AMZN , NASDAQ:META ), a mountain of macro data (PCE, GDP, ISM, jobs), and of course, the never-ending Trump tariff soap opera.
On the US politics front, Trump stayed uncharacteristically quiet over the weekend, no new bombshells. But whispers about “talks” with China surfaced, without any real confirmation. Meanwhile, several countries are supposedly rushing to negotiate tariff deals with the US. Expect headlines (and chaos) throughout the week.
Supply chains are starting to crack. Container traffic from China to the US has plunged 60%, and if deals aren’t made by mid-May, we could be staring down empty shelves and layoffs in transport and retail sectors. Think “Black Friday” without anything to buy.
Meanwhile, the drama at the Fed continues. Kevin Warsh, still salty about not replacing Powell, attacked the Fed’s “media circus” style, blaming it for post-Covid inflation. Warsh wants the Fed to go old-school: shut up, protect the dollar, and stop playing superhero. No forecasts, no endless press conferences. Just cigars and silence.
On the macro side, this week’s economic data could turn into a horror show: weak jobs numbers, soft GDP, slowing PCE, all raising the probability of recession. If that happens, expect markets to start begging the Fed to cut rates sooner rather than later.
Assets snapshot:
• BLACKBULL:WTI : $63.36
• OANDA:XAUUSD : $3,307
• INDEX:BTCUSD : $94,000
In short: expect maximum volatility, endless surprises from DC, and a market that could spin on a dime. Stay sharp, stay skeptical, and brace for anything.

Bitcoin continuation higherSeems like btc is not going to retest lower limits and npocs at 91200$ region.
Chart looks strong and i think she will continue higher from here .
Lets see if we can reach that 100k psychological level.

Bullish Crypto: Top Altcoins Choice —Your Pick (Session 4)You are back!
Are you back are you?
I am getting many new Altcoins requests so let's do a new Top Altcoins Choice session, Your Pick.
Look at this weekly Bitcoin chart, what do you see?
Today is Friday and the session is full green. The action is happening at the top of the candle.
» Can Bitcoin hit $100,000 by next week?
It is possible. Bitcoin can easily grow less than $6,000 in two days.
» Can Bitcoin hit $120,000 before the month ends?
It is possible but not likely, let's be honest.
» Can Bitcoin hit $150,000 in May 2025.
Absolutely, why not, it is actually not that high.
» Can Bitcoin hit $200,000 in this 2025 bull market cycle top?
Bitcoin can hit $180,000, $200,000 or even go beyond.
Look at this weekly chart and tell me in the comments section what do you see?
I see a market that is very strong.
I see bullish action, bears are weak.
Where are the signals that would give strength to a bear in this type of chart? Where is the downside? Where are the negative aspects, it looks green, it is green and ready to grow up and blow.
It is only a matter of time before Bitcoin moves above $100,000 for the second time in its history. The first time of course in December 2024. Then the All-Time High peak, the correction and now we are moving back up.
Are you aware.... Did you know that Bitcoin will never trade back below 80K? I told you buying below 90,000 was a great opportunity, the last chance now to buy below 100,000 before the 2025 bull market bullish wave.
When Bitcoin moves above $100,000 the Altcoins will blow up. The Altcoins are starting to grow now, to recover now but not yet, May 2025 is the month of the Altcoins market maximum growth. Everything will grow, but the Altcoins will grow many times more than Bitcoin because the Alts are smaller, because the correction was stronger on those.
Knowing that the Altcoins market is bullish, recovering a major bottom, set to grow and going green, which one is your Top Altcoin Choice, Your Pick?
Leave a comment with your Choice of Altcoin and I will do an analysis for you, 100% FREE. Choose one pair only and if the chart looks good, I will publish.
Any specific questions leave in the comment, for example: Short-term reversal potential, mid-term targets, All-Time High potential, many signals, chart structure, fundamentals, etc.
Why are you here?
Why are you trading?
How long have you been trading for?
Share some of you; your heart, your mind your soul, share some information about you so that the analysis can be personalized...
Thanks a lot for your continued support.
Let's do a new session of Your Top Altcoins Choice.
Session 4.
Namaste.

The Gold-Silver Ratio ExplainedCOMEX: Micro Gold Futures ( COMEX_MINI:MGC1! ), Micro Silver Futures ( COMEX_MINI:SIL1! )
The Gold-Silver Ratio is a financial term that measures the relative value of gold to silver. Specifically, how many ounces of silver it takes to buy one ounce of gold.
The Gold-Silver Ratio is an important tool for traders and investors. It has been used to indicate the market sentiment towards these two precious metals. A high ratio suggests that gold is more valued than silver, often seen during economic turmoil or when investors seek safe-haven assets. On the contrary, a lower ratio implies that silver is gaining value relative to gold, which normally occurs during periods of economic growth and strong industrial demand.
The ratio fluctuates over time due to supply and demand dynamics, geopolitical events, and changes in the global economy. By analyzing the ratio, traders can make informed decisions about when to buy or sell. This ratio reflects not only the market’s valuation of these metals but also an instrument for profit-making in the commodities market.
Historical Gold to Silver Ratio
Since 2000, the Gold-Silver Ratio has seen considerable fluctuations, reflecting various economic and market conditions. In the first decade of the 21st century, the ratio hovered around 65:1, meaning it took 65 ounces of silver to buy one ounce of gold.
However, the ratio has spiked during times of economic uncertainty. For example, during the financial crisis of 2008, the ratio reached highs not seen in decades. More recently, in the wake of the COVID-19 pandemic and the ensuing economic turmoil, the ratio surged, at one point exceeding 110:1 in 2020, indicating a strong preference for gold as a safe-haven asset compared to silver.
Over time, the Gold-Silver Ratio has been trending up, meaning gold has gained value at a faster pace compared to silver.
As of last Friday, gold is trading around all-time high at $3,330, while silver is quoted at $33.0. This makes the Gold-Silver Ratio almost exactly at 100.
When to Buy and Sell based on the Gold-Silver Ratio?
The decision to buy or sell the ratio hinges on interpreting its current value in the context of historical trends and market conditions.
When to Buy Silver: A high Gold-Silver Ratio, typically at or above the 90:1 mark, suggests that silver is undervalued relative to gold. This is often interpreted as a buying signal for silver. In such scenarios, silver is cheaper than gold, and investors may see it as an opportunity to purchase silver at a relatively low price. The rationale is that if the ratio decreases, the relative value of silver will increase compared to gold, potentially leading to significant gains.
When to Sell Silver/Buy Gold: Conversely, when the Gold-Silver Ratio is low, say around 50:1, it indicates that silver is relatively expensive, or gold is undervalued. In such situations, investors might consider selling silver and buying gold. The expectation is that the ratio will normalize or increase, meaning that gold’s value could rise relative to silver, offering a favorable return on the gold investment.
The Gold-Silver Ratio can be a valuable indicator of when to buy or sell gold and silver. However, since the ratio is not stable but upward trending over time, we could not use a mean-reversion strategy. The price band for normal, high and low ranges should be updated regularly.
Trade Setup with Micro Gold and Silver
Traders could deploy the Gold-Silver Ratio trading strategy using COMEX Micro Gold Futures ( AMEX:MGC ) and Micro Silver Futures ( AMEX:SIL ). The big advantages of using futures contracts are capital efficiency and leverage.
MGC contracts have a notional value of 10 troy ounces of gold. With Friday settlement price of $3,330.7, each June contract (MGCM5) has a notional value of $33,307. Buying or selling one contract requires an initial margin of $1,500 at the time of writing.
By putting a deposit equivalent to less than 0.5 ounce, traders could gain the full exposure to 10 ounces of gold. If gold prices move up by 5%, a long futures position would double in value (= (33307*0.05) / 1500 = 111%). This futures contract has a built-in leverage of 22:1.
Conversely, Micro Silver (SIL) contracts have a notional value of 1,000 troy ounces of silver. With Friday settlement price of $33.02, each June contract (SILM5) has a notional value of $33,020. Buying or selling one contract requires an initial margin of $3,000 at the time of writing.
By putting a deposit equivalent to 91 ounces, traders could gain the full exposure of 1,000 ounces of silver. If silver prices move up by 5%, a long position in Micro Silver futures would gain 55% (= (33020*0.05) / 3000). This futures contract has a built-in leverage of 11:1.
Micro gold futures (MGC, 10 oz) contracts tap into the deep liquidity of standard-size gold futures contracts (GC, 100 oz). As of last Friday, GC has an open interest (OI) of 447,356 contracts, while the OI for MGC is 44,449, according to data from CME Group.
The OI for standard Silver Futures (SI, 5000 oz) and Micro Silver Futures (SIL, 1000 oz) are 154,276 and 12,345, respectively.
Happy Trading.
Disclaimers
*Trade ideas cited above are for illustration only, as an integral part of a case study to demonstrate the fundamental concepts in risk management under the market scenarios being discussed. They shall not be construed as investment recommendations or advice. Nor are they used to promote any specific products, or services.
CME Real-time Market Data help identify trading set-ups and express my market views. If you have futures in your trading portfolio, you can check out on CME Group data plans available that suit your trading needs www.tradingview.com

Gold is expected to rise in the US market
🌐 Driving factors
Geopolitical situation: US President Trump's special envoy Witkov held a three-hour meeting with Russian President Putin in Moscow last Friday to discuss the US plan to end the war in Ukraine. The Kremlin said that the positions of the two sides have become closer.
Iran and the United States said on Saturday that they have agreed to continue nuclear talks in the coming week, but Iranian Foreign Minister Abbas Araqchi was "extremely cautious" about whether the negotiations aimed at resolving the decades-long deadlock can be successful. US President Trump expressed confidence in reaching a new agreement with Iran to prevent the country from developing nuclear bombs.
Latest news: Russian President Putin announced on the 28th that a ceasefire will be implemented from 0:00 on May 8 to 0:00 on May 11.
Bullish sentiment in the market cools down
📊Comment analysis
After the Asian session gold gapped up and opened, it began to fall back quickly to around 3267. After a small rebound in the European session, it continued to retreat. It is currently maintained near 3290. It may continue to fall in the short term, and the support below is maintained near the previous low of 3265-3260 US dollars. This position will also determine the trend of the long and short positions in the later period. It is very likely to retreat again near this position in the evening and continue to make directional choices in the later period. Once the support is effective, the US session may usher in a rebound again, and the key suppression area above is maintained near the integer level of 3300. This position is also the high point of the rebound in the European session, and it will also be the key suppression position of the US session. The operation idea of the US session is very simple. Continue to maintain a certain fluctuation in this range. Once it breaks through, consider stopping loss and exiting.
🔷Technical side:
For the current gold, the 4-hour chart is fluctuating widely between 3330-3270, and is currently near $3295.
✔Operational suggestions, keep short-term trading:
US gold operation strategy:
If you try to go long at 3265-60 first, the target is around 3280-3290, and the loss is 3255. If you first pull back to 3295-00, go short with a light position, and the target is around 3270-3265, and the loss is 3205. In the short term, the long and short positions may continue to pierce, so you need to operate with caution!
💥Risk warning
Liquidity risk: The market may be bearish in early May, and price fluctuations may be amplified.
Policy black swan: Trump may suddenly change tariff policies or personnel changes at the Federal Reserve, causing violent market fluctuations.
Technical false breakthrough: There are a large number of stop-loss orders near $3350, so be wary of reversals after inducing longs.
Summary: This week, the gold market will be affected by geopolitics, the Fed's policies and the trend of the US dollar, and the fluctuation range is expected to be between $3260 and $3350. Investors need to pay close attention to key support and resistance levels and adjust their strategies flexibly.

3 Oversold Stocks Poised for a Rally – MAS, IQV & TMOBelow is today’s SmartApingAI snapshot of three highly oversold names showing early signs of a rebound. Scroll down for a quick refresher on each company’s fundamentals, key technicals, and what makes them attractive at current levels.
1. Masco Corp ( NYSE:MAS )
What They Do:
Masco designs, manufactures and sells a broad range of home-improvement and new-construction products, including faucets, cabinets, hardware, coatings and architectural products.
Customers:
• Homeowners tackling renovation projects
• Professional contractors and builders
Income Source:
Primarily through the sale of mid-range to premium fixtures, cabinetry systems and paint/coatings.
Geographic Footprint:
• ~85% North America
• ~15% Europe
Product Pricing:
Mid-range to premium, with strong brand recognition in kitchen and bath fixtures.
SmartAping AI Model Target Price:
$81.36
Technical Snapshot:
• Broke below—and then bounced off—the $57 weekly support zone
• Now trading at $60.42, up from the intra-week low
• WiseStrat Macro ASI: deeply oversold at –120, turning bullish
• WiseStrat Micro ASI: still bearish, suggesting cautious position sizing
Why Watch:
Home-improvement spending has held up despite moderating housing starts, and MAS’s disciplined balance sheet and dividend yield (~2%) make it a compelling recovery play if consumer confidence picks up.
2. IQVIA Holdings Inc ( NYSE:IQV )
What They Do:
IQVIA provides data analytics, research services and technology solutions that power clinical trials, market research and real-world evidence for the life-sciences industry.
Customers:
• Pharma and biotech firms
• Medical device companies
• Healthcare providers and payers
Income Source:
Subscription and project-based fees for data platforms, consulting and trial execution services.
Geographic Footprint:
• 50% Americas
• 30% EMEA (Europe, Middle East & Africa)
• 20% Asia-Pacific
Product Pricing:
Variable, tailored to project scope—from high-volume data subscriptions to multi-million-dollar trial outsourcing contracts.
SmartAping AI Model Target Price:
$275.35
Technical Snapshot:
• Dropped below the $137 weekly support last week, then staged a relief rally
• Currently at $150.28
• WiseStrat Macro ASI: extremely oversold at –127, now in bullish reversal mode
• WiseStrat Micro ASI: turning positive, hinting at building short-term momentum
Why Watch:
With global R&D spend on track to exceed $250 billion this year, IQVIA’s blend of analytics and CRO services is in high demand. A seasonal uptick in trial starts could catalyze upside toward our $275 target.
3. Thermo Fisher Scientific Inc ( NYSE:TMO )
What They Do:
Thermo Fisher supplies scientific instruments, reagents and software used in research, diagnostics, manufacturing and safety testing across life-sciences and industrial markets.
Customers:
• Academic, government and corporate research labs
• Clinical and diagnostic facilities
• Biopharma manufacturers
Income Source:
Sales of equipment (from a few hundred to multi-million dollars), consumables, and service contracts.
Geographic Footprint:
• ~50% North America
• ~30% Europe
• ~20% Asia-Pacific & other
Product Pricing:
Ranges widely: entry-level lab kits to high-end sequencers and complete lab automation lines.
SmartAping AI Model Target Price:
$645.83
Technical Snapshot:
• Tested and held the $412.73 weekly support last week, bouncing back to $424.24
• WiseStrat Macro ASI: oversold at –129, now showing bullish tilt
• WiseStrat Micro ASI: still negative, cautioning potential retest of $412
Why Watch:
Strong long-term secular drivers—gene therapy, personalized medicine and diagnostics—remain intact. A washout in biotech funding fears has left TMO trading at a rare discount to growth peers.

US DOLLAR TO LOOSE THE FIGHT AGAINST THE SWISS FRANC????Good day once again traders on USDCHF we hab=ve a beautiful market structure as you can see the market dipped into our D1 FVG then showed us a bearish market structure shift after breaking the buyside $, combining that with time of day gives us a high propability trade,GOODLUCK!!!

PENGUUSDT - strong signal to buy!PENGU is giving a very strong buy signal on the 3-day timeframe.
The main trend has been bearish for almost a full year, and this is the first time the coin shows a solid signal of a trend reversal — the red trendline has been broken, and the previous high (marked on the chart) has been taken out.
Breaking the trendline with a massive green candle is a strong confirmation for buyers' momentum in this area.
Taking out the high indicates a shift from a downtrend to an uptrend.
It’s crucial that the blue line (the broken high) does not get lost to the downside.
Best regards Ceciliones 🎯
