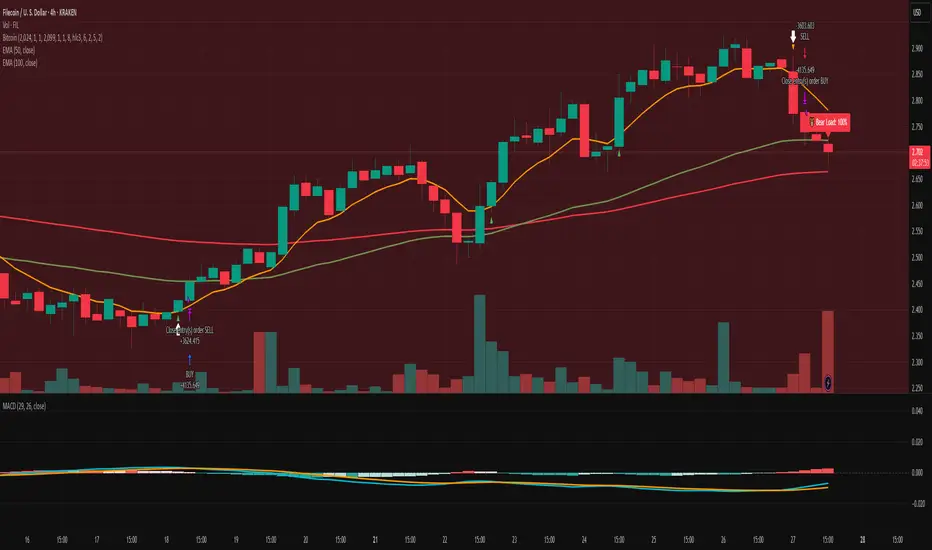
Controlled Pullback Before the Next MoveMarkets don't move in straight lines — they reset to reload.
Today’s shakeout was surgical — a clean retest of key support zones.
Volume surged, but price held above critical EMAs. No structural break.
This is how strong hands accumulate.
Flush out late longs.
Transfer weak hands to strong.
Set up asymmetric upside.
Momentum indicators cooling → perfect setup for re-ignition.
Fast Finality F3 activation still ahead. Infrastructure narrative not priced in yet.
Position smart. Think bigger.
The pain today?
Fuel for the quant engines tomorrow.
#FIL #Filecoin #Crypto #QuantMindset
Fundamental Analysis
MEME: HOW THE HUMAN BRAIN WORKSSuper in-depth infographic detailing how the human brain works. Crypto People TOO! 🤣🤣🤣🤣
You can right-click the image below and select "Save As..." to download and share it with your friends.
Have FUN!

XAUUSD CRAZY MOVES🚨 XAUUSD CRAZY MOVES Full Timeline (with full reasons) 🚨
2008 ───📉 (Oct) -$240 Crash
– Global Financial Crisis (GFC) hits hard: Banks collapse, stock markets crash.
– Investors dump everything (even gold) for cash (USD liquidity panic).
– Margin calls everywhere. Fear at extreme levels.
2011 ───📉 (Sept) -$385 Crash
– Eurozone debt crisis explodes (Greece, Italy, Spain on edge).
– US loses AAA credit rating (S&P downgrade), shocking global markets.
– Gold hit a parabolic top ($1900+), sharp correction follows as panic peaks.
2011 ───📉 (Dec) -$240 Crash
– Ongoing Eurozone collapse fear.
– ECB emergency actions create temporary calm, triggering gold sell-off.
– Investors rotate back into USD and bonds, dumping gold for safety.
2013 ───📉 (Apr) -$270 Crash
– Fed hints at tapering QE (Quantitative Easing) — "Taper Tantrum".
– Massive hedge fund liquidations triggered (forced sales).
– Gold broke key support levels → Panic selling flood.
2013–2019 ──▶▶▶ Sideways ($1000–$1400)
– Strong USD strengthens further as US economy recovers.
– Low inflation, rising interest rates (Fed hikes 9 times).
– No real inflation fear = no reason for gold bulls to attack. 😴
2020 ───📉 (Mar) -$240 Doji
– COVID-19 pandemic explodes globally.
– Massive stock market crash → margin calls hit gold too.
– Gold dumped for cash during extreme liquidity panic → but quickly rebounded after.
2020–2023 ──▶▶▶ Sideways ($1730–$2080)
– Inflation spikes globally (highest since the '80s) 📈
– Central banks (especially the Fed) launch aggressive rate hikes to kill inflation.
– Tug of war: Inflation fears (bullish for gold) vs Rising rates & strong USD (bearish for gold).
2024 ───📈 (Mar) Bullish Breakout
– Regional banks collapse (credit tightening starts).
– Growing fears of a full-blown recession.
– Fed forced to stop hiking, dollar weakens — gold surges.
2025 ───🚀 (Apr) +$530 Mega Bull Candle
– Trump wins US election — announces massive new tariffs (Trade War 2.0).
– Global recession risks explode 🌍
– Inflation reignites as tariffs hit goods prices hard.
– Financial markets tremble → Gold explodes to new all-time highs.

UPS ready for FlyWe can see in short and simple terms that there is a good opportunity to buy this company. In a situation that we may not reach as often as in 2017
And now there is a good opportunity for 30% growth..
How to buy and consult in the Solobox collection

Gold weekly chart with buy and sell levelsFrom the 4H chart you posted, here's a quick breakdown first:
Trend: We're seeing bearish pressure overall after a strong bullish leg. The price is under important retracement levels (0.382, 0.5, 0.618 Fib retracements).
Key Levels:
Strong resistance zone at 3340-3352 (aligned with Weekly Highs, Daily Highs, and a Supply Zone).
Immediate support around 3290 and 3228 (Weekly Open and previous price clusters).
Volume Delta: -3.72% macro (bearish), showing sellers have the upper hand currently.
Important Price Zones:
Sell zone: 3328-3340
Buy zone: 3228-3206
Scalping Strategy on 15-Minute (assuming London / NY crossover sessions):
Bias: Slightly bearish unless strong bullish reversal signals appear.
Ideal sessions: London Open (7-9 AM GMT) and NY Crossover (12-3 PM GMT).
Possible Scalping Setups
1. Sell Setup:
Trigger: If price retraces back up to 3328-3337 zone during London open or NY crossover and shows rejection (pin bars, engulfing patterns on 15M).
Entry: Short at around 3330-3335.
SL: Above 3345.
TP1: 3308 (Sell level on chart).
TP2: 3290.
Bonus TP: 3270 if momentum strong.
2. Buy Setup:
Trigger: If price dips into 3228-3206 (near Weekly Open) and shows bullish reaction (hammer, bullish engulfing).
Entry: Long between 3220-3230.
SL: Below 3200.
TP1: 3254.
TP2: 3270.
Bonus TP: 3290 if NY session volume kicks in.

XAUUSD – Weekly Outlook (April 28 – May 3)XAUUSD – Weekly Outlook (April 28 – May 3)
Current Structure:
Massive bullish momentum intact — we are still climbing into extreme premium territory.
Price has broken all previous structure highs and is trading well above the last known CHoCH (confirmed weekly bullish flow).
Current Weekly candle is showing minor exhaustion but no clear reversal confirmation yet.
Key Weekly Observations:
Premium Zone: 3350–3500 → extreme overbought territory, where distribution/reversal could begin forming.
Immediate Support: 3110–3150 → previous major liquidity grab + breakout area (could act as reaccumulation if retested).
Unmitigated Zones Below:
~2900–2950 → old FVG left behind (possible bounce if deeper correction happens).
Strong demand clusters still much lower, around 2050–2100 (only relevant if a major cycle shift occurs).
Liquidity and Flow:
Liquidity has been swept above all major highs — now hunting for fresh liquidity pools either at extreme highs (above 3350) or deeper below (below 3200).
Strong liquidity vacuum between 3280 and 3150 zones if a weekly rejection happens.
Bias:
Still bullish but hyper-extended — smart money will likely start hunting liquidity pockets on both sides soon.
Watching for early signs of weekly exhaustion or topping (large wicks, strong engulfing candle).
✅ Weekly Bias: Cautious bullish, watching for early topping patterns
✅ Key Levels to Watch: 3350–3500 (resistance), 3150–3110 (support)
🌟 Final Note for the Community:
We’re flying at premium altitudes — but don’t get drunk on heights! 🛫 Stay sharp, stay humble. Gold doesn’t ask, it takes. Let’s keep mastering the game, one sniper move at a time.
👉 Follow, like, and comment your outlook — let’s grow this smart community together! 🚀✨
#Gold #XAUUSD #SmartMoney #WeeklyOutlook

SUIUSDT - Don't wait for pullback!SUI is the star of this season — on the 3-day chart, it just broke out of a falling wedge pattern with a massive green candle.
The price also reacted strongly to the 0.618 Fibonacci level, indicating there’s still plenty of upside potential ahead.
Don’t wait for pullbacks — coins like this rarely give clear entry opportunities, and any correction is usually very shallow.
It’s either you buy now, or regret it later.
Best regards Ceciliones 🎯


Cup with Handle pattern in IEXA nice Cup with Handle pattern is forming in IEX.
A good 90% ROI potential in medium term as per the technical chart pattern.
Currently it is trading near it's median PE with great ROE & ROCE numbers, high margin due to monopoly with steadily growing EPS, which adds conviction for it's upside momentum.
Please refer to the drawings for details.
It has potential to go much higher in long term, will share the Elliott Wave Chart later.
Do your own due diligence before taking any action.
Peace!!

Gold Trend Weekly Review Operation strategy layout for next weekWhat news has recently affected the trend of gold and crude oil? How to judge the future market of gold bulls and bears?
Spot gold fell nearly 1% on Friday, closing at 3316.26. Although the price of gold finally closed above 3300 this week, the trend of gold prices this week can be described as ups and downs. The intraday transactions fluctuated by nearly $100 many times. Under the situation of trade tensions, the market was risk-averse, pushing the price of gold above 3500. After Trump's unilateral statement on tariffs eased, coupled with the 3500 mark, investors closed their long positions, and the lowest price of gold fell to around 3260 during the week. At the moment when tariffs were deadlocked, any remarks made by Trump on tariffs did not reduce the risk of the market, but increased the uncertainty of the market and the volatility of gold prices. So far this year, gold has risen by more than 25%. Trump's repeated changes in his criticism of Powell this week are also a major factor driving the sharp fluctuations in gold prices. U.S. President Trump said on Monday that the U.S. economy may slow down unless interest rates are lowered immediately, and criticized Federal Reserve Chairman Powell again. Powell said that interest rates should not be cut until it is clearer that Trump's tariff plan will not lead to a sustained surge in inflation.
The ADP employment report, known as the "small non-farm", will also be released next Wednesday, along with the latest PCE inflation and consumption data. The crucial core PCE price index is expected to rise 0.1% month-on-month in March, and the year-on-year growth rate will slow from the previous value of 2.8% to 2.5%; personal consumption is expected to maintain a month-on-month increase of 0.4%, indicating that US household consumption remains strong. However, the real focus will be the non-farm payrolls report scheduled for release next Friday, and speculation is currently very intense about when the Fed will cut interest rates. Non-farm payrolls growth is expected to slow from 228,000 in March to 130,000 in April, and the unemployment rate remains unchanged at 4.2%. Average wages may increase by 0.3% month-on-month in April. The disappointing non-farm payrolls, coupled with weak core PCE data, may reinforce expectations that the Fed will cut interest rates by 25 basis points in June rather than July, but for May, the market generally expects the Fed to remain on hold. From a macro-trend perspective, gold is still in an upward trend, as real yields may continue to fall against the backdrop of the Fed's accommodative policy. But in the short term, if positive news about tariffs continues to come, gold prices may fall further as the market is re-adjusting expectations. In the long run, structural positive factors still exist, and emerging markets have further room for adjustment in the composition of foreign exchange reserves, and may gradually move closer to the reserve structure of developed countries in the future. Fed officials said they are not in a hurry to adjust monetary policy, and further observation is still needed to determine how the Trump administration's tariff policy affects the US economy.
Analysis of gold market trends next Monday:
Gold technical analysis: From the performance of the daily chart, the recent trend of gold prices has shown a high consolidation trend, with a significant correction from the high point near $3,500. After hitting the low point of the week, the gold price rebounded to a certain extent, but the rebound strength was blocked near the 23.6% Fibonacci retracement level (about 3368-3370 US dollars), which has now become an important short-term resistance. The opening trend of the gold market on Friday was like yesterday. The upward mode started in the Asian session, rising all the way to around 3370 US dollars. However, it encountered strong resistance here and then turned downward and started to fall. It is worth noting that on Friday, the gold price not only failed to break through this key resistance level, but also fell below the low point hit by the European and American sessions yesterday, and rebounded after reaching the lowest point of 3265 US dollars.
From the current market structure, the position of 3260 US dollars has become the focus of the market. Investors need to pay close attention to whether the gold price can reach or even fall below this point. Once it effectively falls below, the short trend will be further strengthened, and the market may usher in a deeper adjustment. From the current situation, there are two Yins enclosing Yangs, so the adjustment will continue at the beginning of next week; of course, this adjustment can be replaced by sideways trading, which means that it is not ruled out that it will run back and forth in the 3260-3370 range. On the whole, the short-term operation strategy for gold next Monday is to focus on long positions on pullbacks and short positions on rebounds. The short-term focus on the upper side is 3368-3370 resistance, and the short-term focus on the lower side is 3265-3260 support. Friends must keep up with the rhythm. It is necessary to control the position and stop loss, set stop loss strictly, and do not resist single operations. The specific points are mainly based on real-time intraday trading. Welcome to experience and exchange real-time market conditions.

Why Solana (SOL) might correct to the $75–$85 range?Let’s break down why Solana (SOL) might correct to the $75–$85 range, considering fundamental factors, news, events, technical analysis, Coinbase orders, and on-chain activity.
Fundamental Factors
Solana is a high-performance blockchain known for its speed and low fees. However, in 2024–2025, it faces several challenges that could impact its price. One of these challenges is the phenomenon of meme tokens, often referred to as the " Meme Casino ," which has become a significant part of Solana’s ecosystem.
1. Decline in DeFi, NFT, and Meme Token Activity
Solana has been widely used for DeFi and NFT projects and has established itself as the leading blockchain for meme tokens. However, in 2024–2025, these sectors are experiencing a downturn. For instance, NFT trading volume and DeFi activity on Solana have significantly dropped compared to their peak levels in 2021–2022. Interest in meme tokens like BONK, which temporarily boosted demand for SOL, may also fade due to the volatility of this market. This reduces the demand for SOL tokens for transactions within the ecosystem, putting downward pressure on the price and diminishing the token’s fundamental value.
2. Competition from Other Blockchains
Solana competes with networks like Ethereum (following the Ethereum 2.0 upgrade and the introduction of sharding), Arbitrum, Optimism, and newer players such as Sui and Aptos. These blockchains also offer high performance and low fees, potentially drawing developers and users away from Solana and reducing interest in SOL.
3. Regulatory Risks
In 2024–2025, regulators worldwide, particularly in the U.S., are tightening control over cryptocurrencies. Meme tokens, which drive a significant portion of Solana’s activity, are often associated with scams. I believe that 99.999% of meme tokens are scam coins, and this could lead to regulatory actions that harm the meme sector on Solana. Since Solana heavily relies on this sector, the price of SOL could plummet to levels like $2–$11.
4. Declining Interest in Meme Tokens on Solana
In 2023–2024, meme tokens like BONK temporarily increased Solana’s popularity and demand for SOL. However, in 2025, this hype may fade, as the meme token market is prone to sharp rises and falls. This could reduce network activity and, consequently, the price of SOL. In other words, "the music is slowly fading."
Technical Analysis
On the provided SOL/USDC chart (5-day timeframe), several key points support the idea of a correction to the $75–$85 range:
➖ Volume Profile
On the right side of the chart, the volume profile shows a significant trading volume (a thick zone) in the $75–$85 range. This indicates strong support, making it a likely area for the price to return to due to high liquidity.
➖ Trend Structure
The chart shows signs of a slowing uptrend: shorter upward impulses and increasing volatility (short candles with long wicks). This could signal a reversal or the start of a correction.
➖ Correction Target: $75–$85 Zone ("Coinbase Orders")
The $75–$85 range, marked as "Coinbase orders," is a support zone with limit buy orders. For example, on Coinbase alone, there are orders for 44,419 SOL worth $3,553,520. Similar orders may exist on other exchanges like Binance, Kraken, OKX, and others, creating a strong demand zone.
➖ Hyperliquid Liquidation Map
According to the Hyperliquid Liquidation Map, the $75–$85 range contains liquidation levels for long traders. A drop to this level could trigger a cascade of liquidations, intensifying the downward move but also attracting buyers looking for an entry point.
What Event Could Trigger a Correction?
An expected correction in Bitcoin to the $70,000–$76,000 range could act as a trigger for Solana and other cryptocurrencies to fall, as the altcoin market often follows BTC.
===
I believe this will be the last corrective bounce for cryptocurrencies, synchronized with a bounce in the S&P 500. After that, I expect all markets to enter a deep decline.
🤔🤔🤔

Mitigation at 3370 Sparks Sweep at 3260’s, (Bullish Build-Up)The mitigation at 3370’s led to a sweep through the 3260’s, setting the stage for a bullish build-up. As the momentum gathers, the next weekly formation awaits confirmation of the continuing bullish sentiment. follow for more insights , comment , and boost idea .


EURAUD, 68% FIb retracement completed, Buy setupFundamental Analysis
1. Seasonality shows bullish momentum in EURAUD from 10 Apr to Mid of May
2. COT data shows net positions reduction in AUD while Increasing in EUR
3. Overall score of EUR is bullish and AUD is bearish
Technical Analysis
1. EURAUD broke 2 year Rectangular consolidation box
2. strong breakout appear
3. Bulls are in charge
4. 68% fib retracement completed
5. Look for 2 setups
i. if breakout above sideways region then buy setup 2
ii. If breakdown, then look for setup 1

MAGS SUPER STRUCTURE FORMING CAUTION!We have MEGA superstructures forming everywhere. H&S Eiffel Towers, etc.. None will be more devastating to 401ks and people's portfolios than the MAGS breaking down from this mammoth structure.
Last chance to GTFO forming.
CAUTION is in order!
Click Boost, Follow, Subscribe. Let's get to 5,000 followers ))

MES!/ES1! Day Trade Plan for 04/25/2025MES!/ES1! Day Trade Plan for 04/25/2025
📈 5530 5560
📉 5475 5445
Thanks to all my followers! Truly appreciate the support!
Please like and share for more NQ levels Tues & Thurs 🤓📈📉🎯💰
*These levels are derived from comprehensive backtesting and research and a quantitative system demonstrating high accuracy. This statistical foundation suggests that price movements are likely to exceed initial estimates.*

Quant Strike Setup Detected on FIL (Filecoin) – Heikin Ashi SeqFilecoin (FIL) has now printed 10 consecutive green Heikin Ashi candles on the 1D timeframe.
8+ consecutive green HA candles statistically signal momentum regime shifts.
10+ raises probability of trend continuation even further.
##Systematic models and trend-following algos are likely to auto-flag this setup.
Why:
Heikin Ashi filters noise, smoothing volatility.
Breaking above key resistance zones ($2.90 – $2.95) with volume could trigger a quant-driven momentum acceleration.
##If triggered, expect not a scalp move — but a position squeeze higher.
Notes:
Markets evolve faster than opinions.
The data suggests asymmetric opportunity is brewing — machines will react first.

Ye Chart Kuch Kehta Hai : Cholamandalam Financial HoldingCholamandalam Financial Holdings Limited (CFHL), a marquee name among India’s top 5 NBFCs by market capitalization and a key entity within the Murugappa Group, continues to demonstrate robust financial health and growth momentum. As a Core Investment Company registered with the RBI, CFHL offers a diversified portfolio of financial products and risk management solutions through its group companies, catering effectively to both individual and corporate clients.
Recent Performance Highlights:
The company has delivered a commendable profit CAGR of 20.5% over the past five years, underscoring consistent earnings growth.
Stock price performance has been exceptional, with a CAGR of 23% over 10 years, accelerating to 48% over 5 years, 45% over 3 years, and an impressive 83% in the last year alone.
Compounded profit growth remains strong, with 19% over 10 years, 21% over 5 years, 29% over 3 years, and 24% trailing twelve months (TTM).
Latest Quarterly and Annual Results:
Q4 FY25 disbursements rose 7% year-on-year to ₹26,417 crore, while annual disbursements crossed the ₹1 trillion mark at ₹1,00,869 crore, a 14% increase.
Assets Under Management (AUM) surged 30% year-on-year to ₹1,99,876 crore.
Net income for Q4 FY25 increased by 29% to ₹3,758 crore; Profit After Tax (PAT) grew 20% to ₹1,267 crore for the quarter and 24% to ₹4,259 crore for the full year.
The company maintains strong capital adequacy with a CAR of 19.75%, well above regulatory norms, and a comfortable liquidity position.
Asset quality remains robust with Gross NPA stable at 3.97% and NNPA at 2.63%, below RBI’s PCA threshold.
Technical Outlook:
From a technical perspective, the stock is poised for a breakout, perfectly positioned at the golden ratio level on the Fibonacci retracement, forming a classic cup pattern-an ideal setup signaling strong upside potential. The financial sector, particularly NBFCs, is currently in favor, and Cholamandalam stands out as one of the hottest picks in this space.
Investment Strategy:
Given the strong fundamentals and technical setup, this is an opportune moment to consider a position in CFHL. Investors should calibrate their stop-loss levels according to individual risk tolerance to safeguard capital while participating in the anticipated upward momentum.
This synthesis combines strong fundamentals with favorable technical signals, making Cholamandalam Financial Holdings a compelling investment candidate in the current market environment.

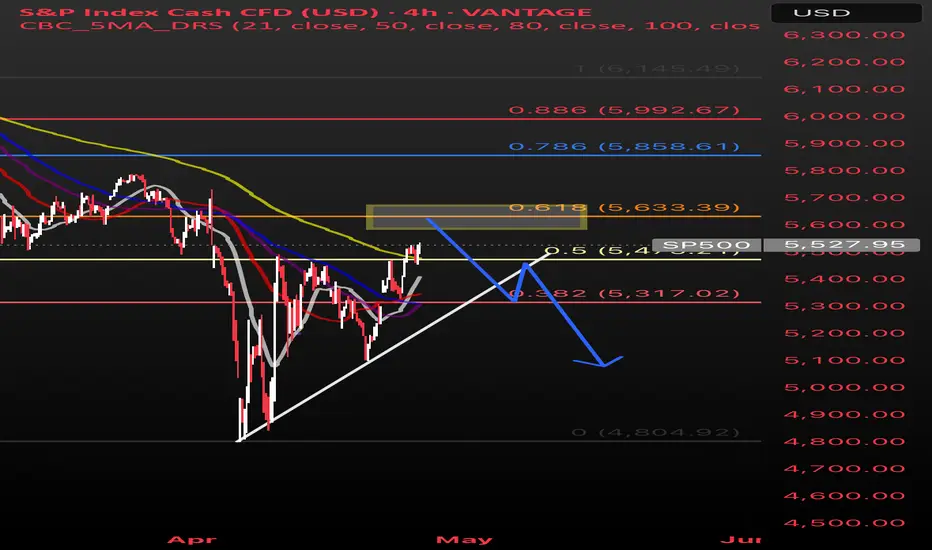
S&P 500: What’s Happening?S&P 500 Market Update
Recent changes to tariffs have made investors feel more confident, and because of that, the S&P 500 has broken out of a downward trend it had been stuck in. This breakout suggests prices could continue rising for now.
However, technical analysis shows that many investors might still be cautious. A lot of them may plan to sell if the market climbs back near $5,650 (faded yellow rectangle box on chart), trying to limit losses compared to when prices dropped to around $4,800 a few weeks ago.
If the market struggles to get past $5,650 (faded yellow rectangle box on chart), we could see prices fall again, possibly down to around $5,300, before the market settles for a bit and decides on its next big move.
• Blue line: shows the path I expect the market to take based on investor behavior and technical patterns.
• White line: shows the general trend where buyers typically step in. If the price falls through this line, it could signal more downside ahead.
MNQ1!/NQ1! Day Trade Plan for 04/25/2025MNQ1!/NQ1! Day Trade Plan for 04/25/2025
📈 19430 19580
📉 19140 18980
Thanks to all my followers! Truly appreciate the support!
Please like and share for more NQ levels Tues & Thurs 🤓📈📉🎯💰
*These levels are derived from comprehensive backtesting and research and a quantitative system demonstrating high accuracy. This statistical foundation suggests that price movements are likely to exceed initial estimates.*

XAUUSD M15Liquidity is one of the fundamental pillars of Smart Money trading.
Understanding where and how it is formed is essential to enter with the big institutions (Smart Money) and not against them.
The market always aims to catch liquidity before making its real move.
Your role: Identify liquidity areas to anticipate where the market will trap retails... and position yourself at the best price.
ALGICT TRADERS ACADEMY

Gold analysis resultThis analysis was the first analysis posted on this page and this video shows the result of this analysis in the long term, this analysis was done with the lowest drawdown.
Sasha Charkhchian
