Nasdaq WE ARE DOOMED! IF Trump will keep doing same bs)NQ on top of the range, have to wait for weekly opening because there are few direction where it can go
1 - without correction all the way up till 20044 and 20200( daily IFVG)
2 - correction till breaker ~19200, liq grab rebalance here and all the way up
3 - it will be deviation of the range that we had then aggressive market shift( ChoCH) with FVG small pull back to 19200-19400 (depends on FVG) and then all the way down till 18-17-16k (red line)
Fundamental Analysis

GOOG LongGOOG
Fundamentals:
- Low P/E = 18, compared to historical average 24
- Expert consensus $204
- Growing EPS and Revenue
- Shares buyback
Technicals
- Near Year ATR Low
- Near 200VWMA Extension 25%
Entry
- 163
- 125
Take:
- 200
- 225
- 250
Stop:
- 100

BTC- crash is coming? Most likely no)In its best traditions, bitcoin in one impulse reached the monthly target 95000, which I wrote about
The probability of a correction to set a higher low in the equilibrium area of the range is increasing.
Probably in May the crypto market will have to pass the last stability test, in case of success we will get excellent opportunities for spot and speculative positions before the next cyclical growth spiral.
For now have to wait for weekly open but there are 2 options:
pump till PWH and then move on correction
slow bleeding till 0.5 or mb till 83k in worst case and then pump to ATH

BITCOIN → Consolidation or reversal? Why is $ 95000 important?BINANCE:BTCUSD held up quite strongly during the tariff war and largely weathered the storm, while the stock market and indices were in free fall. The improvement in the fundamental situation has once again heightened interest in the asset among traders and investors.
Earlier, I pointed out that against the backdrop of falling markets (due to Trump's policies and tariff wars), Bitcoin is holding up fairly well. It cannot be compared to gold, which maintains its status as a safe haven, but overall it has stayed out of the 73K risk zone.
Countries are continuing negotiations in the US, which generally points to an improvement in the trade situation, but all attention remains on relations between China and the US, and a resolution may be close.
Technically, on the daily/weekly timeframe, the price has broken through the trend resistance and the asset has moved from the sell zone to the buy zone, which in general only increases interest in the flagship. Bitcoin is stuck in the 95K-92K range. A false breakout of resistance provokes a correction, and now we need to monitor the price and see where the correction will stop. This will show us important support that could become the basis for consolidation.
Resistance levels: 95K, 100K, 102.5K
Support levels: 93.5, 92.9, 92, 91K
To break through 95K and continue growing, Bitcoin must form consolidation. There is none at the moment, and a correction and halt may indicate the approximate boundaries of consolidation. However, the focus is on 95 - 93.5 - 92K. If the price manages to stay within the local boundaries and continues to storm the 95K resistance, we will have a chance for a breakthrough and continued growth to 100K. Otherwise, Bitcoin may form a deeper correction, for example to 91-88K
Best regards, R. Linda!

TradeCityPro | Deep Search: In-Depth Of ONDO👋 Welcome to TradeCity Pro!
In this analysis, I want to fully review the ONDO project for you. First, I’ll go over the project’s information, and then we'll move on to its technical analysis.
🔹Introduction to Ondo Finance (ONDO)
Ondo Finance is an open and decentralized investment bank designed to bridge the gap between traditional finance and decentralized finance (DeFi). Founded in 2022 and based in the Cayman Islands, Ondo's mission is to democratize access to institutional-grade financial services. Its ecosystem is built to serve a wide range of stakeholders including DAOs, institutional players, and retail investors. Ondo's key innovation lies in tokenizing real-world assets, thereby making them accessible to a broader audience via blockchain technology.
🔹ONDO Token and Governance
The ONDO token plays a central role in the governance of the Ondo decentralized autonomous organization (DAO). Token holders have specific rights within the DAO, particularly over the governance of Flux Finance, which is one of the main platforms in the Ondo ecosystem. ONDO holders are empowered to propose and vote on changes, allocate funds for projects, and influence the platform’s direction, ensuring community-driven governance. The ONDO token sale occurred in mid-2022 and was purchased by over 18,000 individuals.
🔹Technology and Infrastructure
Ondo leverages blockchain technology to offer decentralized financial services. It operates on a secure and transparent distributed ledger system, which ensures that transactions are immutable and resistant to tampering. The platform uses Proof-of-Stake (PoS) as its consensus mechanism to validate transactions, offering both security and energy efficiency. Ondo is also integrated with various DeFi protocols and utilizes techniques from traditional finance to repackage DeFi exposures into institutional-grade risk-return profiles. Strategic partnerships with firms like BlackRock, Morgan Stanley, and Coinbase enhance its interoperability and credibility.
🔹Real-World Use Cases
Ondo's primary application is in the tokenization of real-world assets such as real estate or treasuries. This allows users to invest in fractionalized assets, lowering the barrier to entry for institutional-quality financial products. The platform is used for intellectual property management through blockchain-based records, enabling secure and transparent tracking. Ondo also engages in community events and educational initiatives to raise awareness about blockchain technology. Furthermore, it offers technical and business development services such as smart contract deployment and treasury management to startups and institutions.
🔹Key Developments and Milestones
In 2022, the Ondo DAO was officially launched, providing a decentralized governance framework. Following that, the foundation introduced Flux Finance, a major protocol under Ondo DAO governance. The Ondo Foundation has formed several partnerships to expand its ecosystem and drive innovation. One of the important initiatives includes Ondo USDY LLC, which issues the USDY stablecoin. Ondo has also focused on education, contract deployment, and treasury management, solidifying its operational backbone and long-term strategic vision.
🔹Team and Founders
Ondo Finance was founded by Nathan Allman and a team of former Goldman Sachs digital asset professionals. Nathan Allman brings a strong background in engineering and financial operations, serving as a key driver of the project’s vision. The founding team’s experience in traditional finance has been instrumental in shaping Ondo’s hybrid model, which integrates DeFi tools with institutional-grade strategies.
🔹Fundraising and Token Sale
Ondo Finance has conducted multiple fundraising rounds. An initial coin offering (ICO) took place on CoinList on May 12, 2022, raising $22 million. The token was priced at $0.055, with a minimum purchase of $100 and a maximum of $20,000. Another funding round was the IEO on Gate.io Startup, conducted from January 17 to January 18, 2024, which raised $40,000.
In total, Ondo has raised $46.04 million, including $22.04 million from public sales and $24 million from private and institutional funding rounds.
🔹Tokenomics
The ONDO token has a maximum supply of 10 billion tokens. Distribution is divided as follows: 52.1 percent for ecosystem growth, 33 percent for protocol development, 12.9 percent for private sales, and 2 percent for community access sales. As of now, 33.9 percent of the total supply is unlocked, with another 19.4 percent scheduled for future unlocks. Approximately 46.7 percent remains locked.
🔹Vesting Schedule
The vesting of ONDO tokens is structured into distinct categories. Ecosystem growth tokens are released linearly over five years, with 24 percent unlocked as of January 2024 and 39.2 percent expected to unlock gradually. Protocol development tokens have a one-year cliff, followed by a three-year linear unlock, with 25 percent becoming available in April 2025. Private sales follow the same schedule as protocol development, while community access sales were 90 percent unlocked from the beginning with full linear unlock over one year.
—
Certik: 87.50✅
🔹Top Ondo Wallets
Trust Wallet
imToken
MetaMask
Torus
Coinbase
TokenPocket
iToken Wallet
Binance web3 wallet
🔹Liquidity Pools
Uniswap
Balancer
🔹Top Holders
0x677fd4ed8ae623f2f625deb2d64f2070e46ca1a1
0x460ae5a6666fcb9635ba99b541b31279e59665370x
524083970c7a1e62fbaa61d38781f87a4f191fd0
0xa63eace47618b9677261b09b32e3ca2b5c0a0182
0xd2e6e930e25456ffcd4df0124563cc334f3284f4
🔹Significant TVL Growth in Ondo Despite Sharp Liquidity Decline
Since mid-January 2025, the total value locked (TVL) in Ondo has increased from 157,000 ETH to 631,000 ETH, reflecting significant growth in its TVL. However, in terms of liquidity, Ondo has experienced a sharp decline since late March, with a drop of nearly 50% compared to the previous month.
🔹On-Chain Analysis of ONDO
Looking at ONDO’s on-chain data, the $0.833 level stands out as a key support zone based on the concentration of tokens currently in profit. On the flip side, the $0.856 area acts as a resistance level, with approximately 124 million ONDO tokens currently held at a loss. However, the volume of tokens in profit remains higher overall, which can be interpreted positively — these zones represent value and may attract increased demand.
From a network activity perspective, there has been a noticeable decline, particularly in the number of new addresses being created.
Analyzing supply and demand, approximately 75% of ONDO tokens are held by whales, indicating strong whale dominance. Address-level data shows that wallets holding between 10 and 100 million tokens have shown minor demand, while older holders are contributing meaningful inflows. Additionally, wallets identified as "investor" addresses have also demonstrated renewed buying interest.
👀 Now that we’ve reviewed the project's details, let’s dive into ONDO’s technical analysis.
📅 Weekly Timeframe
In the weekly timeframe, as you can see, there aren't many candles yet, so we can’t perform a complete analysis on this timeframe.
✔️ However, you can observe that after the project launched in January 2024, there was an upward movement up to the 1.3927 area, followed by a correction down to 0.5871.
💥 After this correction, the next bullish leg continued up to the 2.0565 area.
📈 During this bullish cycle, there’s also an ascending trendline that the price has reacted to multiple times, and now it has touched it again.
⚡️ The main support on this timeframe is at 0.5871, and the main resistance is at 2.0565. So, if you already hold ONDO and are considering setting a stop-loss, breaking 0.5871 could be a good point to activate it.
🔽 This level can also be used as a trigger for a short position. Breaking 0.5871 could create a downtrend in ONDO.
🛒 For spot buying, the main trigger is breaking 2.0565, and if this level is broken, the price could register a new ATH.
📅 Daily Timeframe
In the daily timeframe, as you can see, the price has been supported by the trendline and has shown a very quick reaction, with bullish momentum pushing it above the 0.9253 resistance.
📊 Currently, the price has reached the SMA99 and reacted to it. The volume of the candles reacting to the SMA99 has increased, and if the price stabilizes above the SMA99, the main bullish leg could begin.
💫 The next resistance the price faces is at 1.1933, and if the SMA99 is broken, I believe the price can easily rise to this level.
☘️ Moreover, if this level is also broken, the price could climb up to 2.0565.
📉 For ONDO to turn bearish on this timeframe, the first trigger would be a fake breakout above 0.9253.The main bearish trigger would be breaking both the trendline and the 0.7122 level.
📝 Final Thoughts
This analysis reflects our opinions and is not financial advice.
Share your thoughts in the comments, and don’t forget to share this analysis with your friends! ❤️

IQiyi (IQ) - updating the Chart and story-trading during crisisNASDAQ:IQ some notes on the iqiyi chart.
1: fundamentals: the stock is expected to earn 20 cents this year and eventually grow to 50 cents per share eps, earnings power and earnings growth is very attractive at current prices.
2:Technicals: 2.00 level is significant for may and june options cycle. could we be in a major wedge at the 3 to 1.50 levels, marking a coiling up area. we took out the all time low of oct 2022 and make a new low around 1.50. , could this become a major accumulation zone during the trump/china tarriff crisis?
3.Sentiment: chinese stocks are very hated and under owned, there are many chinese stocks trading at or below tangible book value, news is very dark seeming for trade in china, with many chinese manufacturers shutting down due to lack of usa product demand with tarriff uncertainty.
Bullish
I love moments like this. they are not easy to trade and invest in. But they are real time history happening before our eyes. Sand through your hands. Remember these times.

XRP / RIPPLE | 30M | IMPORTANT LEVELSFriends,
I valued your requests and prepared the following Ripple analysis: If Ripple drops below the level of 2.1807 for 30 minutes, the target will be the 2.1424 level. This level holds a very significant support zone.
The most critical support level is located at 2.1085.
If Ripple does not fall below this support zone, my target level for Ripple will be 2.2495.
Please don't forget to like.
Thank you to everyone who supports with likes.

EURUSD Bullish or Bearish Today?As you can see in my chart drawing, EURUSD is going through an uptrend channel. Now it's coming from the channel resistance, so it might be a pullback until the channel bottom.
On the other hand, the euro is gaining fundamental strength against the USD!
Therefore, the trend may persist until this week's NFP. This analysis is based on the current trend and fundamental situation of the market.
This information is not financial advice or any trade signal; it's just for educational purposes, so please do your own analysis before taking any entry on this asset.
Thank you

M2 Money Supply W/ Trix As M2 money supply breaks out here is an interesting look back. Since 1959 the Trix indicator has never crossed below the zero line until late 22 early 23 signaling the biggest contraction in money supply since the mid 90s after recording the largest expansion recorded post plandemic. Now with it back above the zero line and supply ticking above previous highs, will we see normal rate of expansion, or will these recent readings become the new norm? Regardless, the fiat printers will not stop as the chart clearly shows up and to the right. This is why Bitcoin exist and why governments cannot be trusted no matter who is charge, the printer is always warmed up and ready to go brrrr.

Gold at a Turning Point? The Case for a Correction!Gold has been on an unrelenting vertical rally, but the cracks are starting to show! On the quarterly chart, the price has just kissed the 161% Fibonacci extension of a key channel, a level that often signals exhaustion. Meanwhile, volume has been quietly fading since early 2023, despite this marathon of a bull run with no meaningful correction yet. Is the market running out of steam? The charts are whispering a pullback—don’t miss the signs!

Key Buying Levels For Monday Use Proper Money Management !
This trade is based on advanced Concept
Follow for more !
Take only 1% Risk on this Trade

XAUUSD 1H FORECASTHello guys, let me tell you that in the weekly outlook we have given for gold, we should hold it until our FVG reaches the Bearish OB, and when we reach there, we can sell from there and our target will remain until the bullish order block.

#BTC #BTCUSD #BTCUSDT #BITCOIN #Wyckoff #Analysis #Eddy#BTC #BTCUSD #BTCUSDT #BITCOIN #Wyckoff #Analysis #Eddy
This analysis is based on the analytical style of the Wyckoff Distribution Structure of Schematics 1 and 2.
I have outlined for you the important parts of the Wyckoff style on the one-hour timeframe.
Currently, we are in Phase C of the Wyckoff Distribution Structure.
We have to wait for the completion of this phase and the start of Phase D of the Wyckoff Distribution Structure.
When will this structure be fully confirmed? When the Bitcoin price falls to the 91800 support and gathers the final spring when this support is broken for the fall, we will enter a short position by getting the necessary confirmations based on our style and strategy.
💬 Note: It is not exactly clear whether the market maker will act based on Schematic 1 or 2, so the best entry point for short positions will be the 91800 support break. If, based on the schematic 1, the Bitcoin price UTAD and test formed, high-risk traders who are willing to trade in the opposite direction can enter a short position by getting confirmation in the time frames below 15 minutes.
Where will the targets be? The first target is 62000 and the second target can be 46000 dollars.
When can you safely close the position and enter a reverse trade, that is, long or buy? When a Wyckoff accumulation structure is formed at one of the targets.
The responsibility for the trade is yours and I have no responsibility for your failure to comply with the risk and capital management.
Good luck and be profitable.
I also invite you to review and view my latest analysis on Bitcoin via the link below:
For altcoins, follow my analysis on the Total 3 chart.
My analysis of the Total 3 chart:

Solana | BULLISH ON SOL | SOL Dominates Blockchain RevenueEven with a dip in activity particularly around memecoins, Solana has managed to hold its ground impressively when it comes to generating revenue.
While you might think fewer transactions would automatically mean less money coming in, Solana's performance shows otherwise. This ability points to the solid value being created by the different applications and uses on the network right now.
A big reason for this financial resilience is the continued strength of dApps on Solana. These apps have been really effective at bringing in fees and adding value to the network. It seems that while the hype around certain speculative tokens has died down significantly, the core utility and economic activity within Solana's dApps are still going strong. This shift towards more fundamental uses for generating revenue is a really positive sign for how the network can keep growing in the long run.
Looking ahead the future for SOL is bright imo as more projects are linking Artificial Intelligence with Solana, taking advantage of its speed and low costs to build new things. Plus, the introduction of Solana ETFs in Canada is a big step.
Other Solana-based alts including Official Trump (TRUMP), Jupiter (JUP), Raydium (RAY), and Bonk (BONK), have followed SOL with good price increases.
It seems like the focus is shifting towards building more lasting and useful applications. With ongoing support for developers and increasing interest from the traditional financial world, Solana seems well-positioned to handle market ups and downs and keep finding new ways to create value in the future. I'll definitely be watching to accumulate for the long-term.
______________________________
BINANCE:SOLUSDT

BTCUSD 1H FORECASTHello guys, I hope you are well let me tell you that the BTC prediction we made in the weekly outlook forecast will be the possible same move

Arbitrum-ARBUSD Periodic Analysis-Issue 80 (Free Access)The analyst believes that the price of Arbitrum will decrease within the time specified on the countdown timer. This prediction is based on a quantitative analysis of the price trend.
___Please note that the specified take-profit level does not imply a prediction that the price will reach that point. In this framework of analysis and trading, unlike the stop-loss, which is mandatory, setting a take-profit level is optional. Whether the price reaches the take-profit level or not is of no significance, as the results are calculated based on the start and end times. The take-profit level merely indicates the potential maximum price fluctuation within that time frame.

USDJPY 1H FORECASTHello guys, I hope you are well let me tell you that for now we will hold until the Bullish OB and after that we will buy from here and our target will remain the resistance.This is our weekly outlook, not a signal setup.

#BTCUSDT:Price Moving Well From $88,000 to $96,000,Next $128,000Bitcoin has moved well from our last idea of $88,000 to $96,000. However, a small correction is expected, which could be a good point to enter a swing trade. This could take the price to a new record high of around $128,000.
We have three targets, but each can be set based on your overview. The last three candles are not clear, so it’s best to wait for price to have a clearer indication of its next move.
We wish you the best and good luck in your trading journey. Thank you for your unwavering support! 😊
If you’d like to contribute, here are a few ways you can help us:
- Like our ideas
- Comment on our ideas
- Share our ideas
Team Setupsfx_
❤️🚀

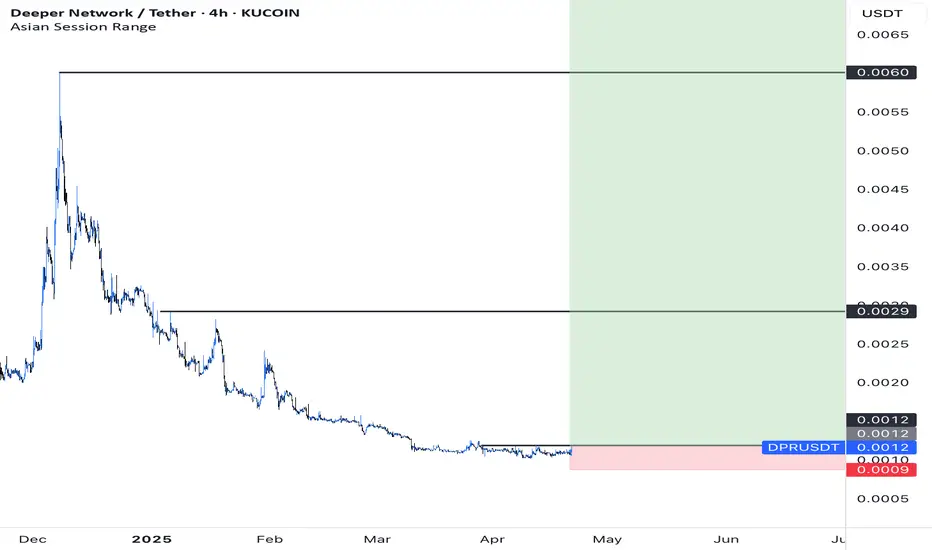
Deeper network (DPR)Perfect point to buy 1000XAll time low . most probably 100 USD can make 1 Million in a couple of months . DYOR
GOLD WEEKLY - Key Events to Watch: ADP, Core PCE, Non-Farm📌 Weekly Gold Outlook – Key Events to Watch: ADP, Core PCE, Non-Farm Payrolls 📉📈
🌍 Fundamental Overview
Last week, gold faced heavy selling pressure after failing to sustain its rally above the $3,450 level. Easing concerns over the US–China trade tensions and a stronger US Dollar — supported by stronger-than-expected Durable Goods Orders — triggered a sharp correction in Price.
The US Federal Reserve (Fed) continues to adopt a cautious stance, awaiting clearer economic data before adjusting its monetary policy. Meanwhile, recent figures from both the US and China show signs of economic resilience, reducing safe-haven demand for gold in the short term.
Key Events This Week:
ADP Non-Farm Employment Change
Core PCE Price Index m/m
Non-Farm Payrolls (NFP)
Volatility is expected to rise sharply as these major economic indicators are released.
📊 Technical Analysis – XAU/USD 2H Chart
Gold is currently undergoing a corrective phase after its strong rally earlier this month. Price is forming a descending channel and consolidating around critical support and resistance zones.
Immediate Resistance: 3,325 – 3,377
Immediate Support: 3,275 – 3,235
As long as Price remains capped below 3,325, the bearish bias will remain dominant.
🧩 Main Scenarios for This Week
Short-Term Rebound:
Price may retest the 3,275–3,277 area before sellers regain control.
Medium-Term Bearish Pressure:
If Price fails to reclaim the 3,325 resistance zone, it could break lower toward 3,235, 3,197, and potentially deeper into the 3,108 or 3,066 liquidity zones.
Bullish Reversal Scenario:
A sustained breakout and close above 3,377 would invalidate the bearish outlook and suggest a move toward the 3,420 target.
🔍 Key Price Zones for This Week
Resistance: 3,325 → 3,377 → 3,420
Support: 3,275 → 3,235 → 3,197 → 3,108 → 3,066
🧠 Suggested Trading Strategy
Prefer short positions when Price retraces toward the 3,275 – 3,325 resistance zone, aiming for downside targets at 3,235 and 3,197.
Be cautious with long positions: only consider buying if Price drops deeply into 3,108 or 3,066 and shows strong support reaction.
⚡ Note:
Given the upcoming releases of ADP, Core PCE, and Non-Farm Payrolls, the market is expected to experience significant volatility.
Stay disciplined and await detailed intra-week updates around key event times.

GBPUSD 1h FORECAST Hello guys, I hope you are well let me tell you that this is our next move direction, this is our forecast weekly outlook, in which we are going to tell you to buy from here and our target will be up to the resistance area.

#BTC #BTCUSD #BTCUSDT #BITCOIN #Update #Analysis #Eddy#BTC #BTCUSD #BTCUSDT #BITCOIN #Update #Analysis #Eddy
I have identified the important support and resistance areas of the weekly timeframe for you.
I have identified the important resistance prices for the start of the decline with the red line and the important support prices for the start of the growth with the green line.
This analysis is based on a combination of different styles, including the volume style with the ict style.
Based on your strategy and style, get the necessary confirmations for this analysis to enter the trade.
Don't forget about risk and capital management.
The responsibility for the transaction is yours and I have no responsibility for your failure to comply with your risk and capital management.
💬 Note: An important analysis will be presented on the lower timeframe on Bitcoin soon, which, based on the chart and explanations sent in that analysis, you can hunt for Bitcoin's decline by getting confirmation, pay attention to the current chart and consider important liquidity, including the Decision and Extreme areas.
Be successful and profitable.
For altcoins, proceed according to my analysis on the Total 3 chart.
My analysis of the Total 3 chart:
You can also view and review my previous analyses on my TradingView page.
Please don't forget to like and follow, your support encourages me to continue on my path and provide more analysis and updates.

Trump's remarks may cause a stir in gold
💲Let's comment on the price of gold next week from April 28, 2025 to May 2, 2025
🌐World situation
Earlier, it was reported that China has exempted some US goods from tariffs, a development that has suppressed the safe-haven appeal of gold.
But on the 25th, US President Trump told reporters on Air Force One that unless China makes substantial concessions, it will not cancel the tariffs imposed on China. Over the past week, the US has continued to send confusing and even contradictory signals on the issue of tariffs on China, and market sentiment has deteriorated.
On the 26th, after a brief meeting between US President Trump and Ukrainian President Zelensky in the Vatican, both sides also sent "positive" signals.
Will the Russian-Ukrainian conflict usher in a turning point?
The General Staff of the Ukrainian Armed Forces reported later that day that fighting in the Kursk region was still ongoing. The Ukrainian army held its ground and used a variety of weapons to carry out effective firepower strikes on the enemy, causing losses to the Russian army. The Ukrainian General Staff stressed that the Ukrainian troops were not surrounded and that Russia's statement on the end of hostilities in the region was "purely propaganda in nature." The Ukrainian General Staff also said that fighting by the Ukrainian army in local areas of Belgorod Oblast is still ongoing.
The escalation of the India-Pakistan conflict may also increase safe-haven buying of gold.
📊Comment Analysis
Earlier this week, investors withdrew $1.27 billion from the SPDR Gold Shares ETF, the largest single-day outflow since 2011. At the same time, gold prices hit an all-time high above $3,500, suggesting that there may be some profit-taking factors. In 2011, similar outflows coincided with the peak of gold's last super cycle, marking the beginning of a long period of consolidation for gold, which was not broken until 2020. But this does not guarantee that this will be a turning point, and there are still many positive factors at work, including trade uncertainty, safe-haven demand, central bank demand, and Wall Street's calls for further increases in spot gold prices.
Next week, the gold market will welcome the release of the World Gold Council's first quarter "Gold Demand Trends" report. In addition, US President Trump's 100th day rally on Tuesday may become an important window for gold prices to choose to test the 3,500 mark again or continue to fall from 3,300.
🔷Technical aspect:
Based on the resistance and support levels of gold prices in the H4 framework, Labaron has identified the following important key areas:
Resistance: $3357, $3498
Support: $3228, $3155
✔Operational suggestions
Short-term trading:
Bearish strategy:
If the gold price rebounds to the range of $3,330-3,350, you can try to short, with a target of $3,250 and a stop loss of $3,355.
Bullish strategy:
If the gold price holds the support of $3,260, you can go long with a light position, with a target of $3,330 and a stop loss of $3,240.
Long-term investors: Pay attention to the Fed's policy trends and geopolitical situation. If the gold price falls back to below $3,200, consider investing in batches.
💥Risk Warning
Liquidity risk: Market trading may be bearish in early May, and price fluctuations may be amplified.
Policy black swan: Trump may suddenly announce tariff policies or personnel changes at the Fed, triggering violent market fluctuations.
Technical false breakthrough: There are a large number of stop-loss orders near $3,350, so be wary of reversals after inducing more.
Summary:
Next week, the gold market will be affected by geopolitics, Fed policies and the trend of the US dollar, and the expected fluctuation range is $3,250-3,350. Investors need to pay close attention to key support and resistance levels and adjust strategies flexibly.
