DXY Outlook: FVG Retest Complete — Is 105 the Next Sweep?DXY Weekly Forecast
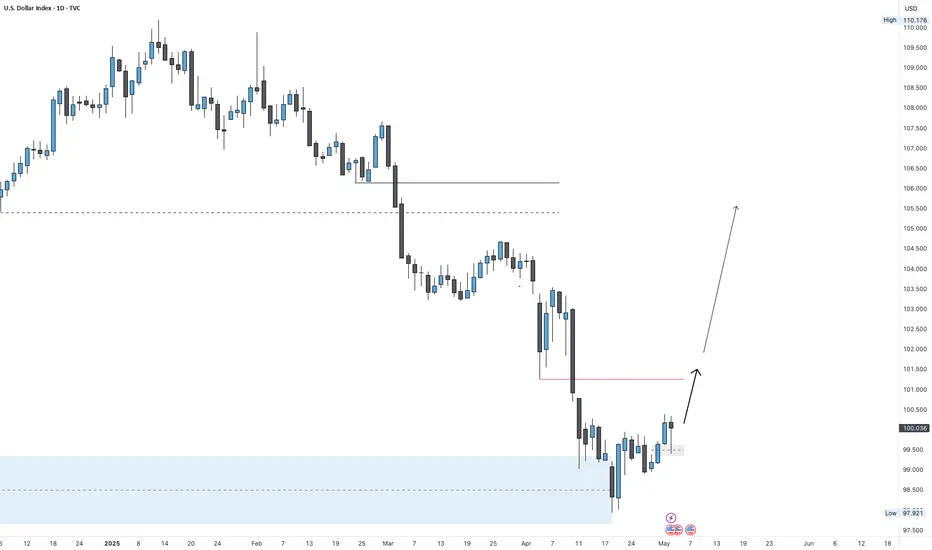
In recent weeks, DXY dropped to the extreme demand zone, sweeping the lows around 98–99, before launching a bullish reversal and breaking through multiple minor highs.
Last Friday, price retested a daily Fair Value Gap — perfectly aligned with the NFP release — and held. Now, we may see some sideways consolidation at this level before continuation higher toward the 105.000 zone, where key liquidity sits above prior highs.
Bias: Bullish
Key Zones:
• Support: 102.000 (FVG / demand area)
• Resistance: 105.000 (liquidity target)
The structure is clean: bulls in control, as long as the FVG zone holds.
—
Weekly forecast by Sphinx Trading
Drop your thoughts in the comments.
#DXY #DollarIndex #USD #ForexAnalysis #LiquiditySweep #SphinxWeekly #FairValueGap #NFP #SmartMoney
Fundamental Analysis
EurUsd short The 4 hour chart is currently exhibiting a clear downtrend. This bearish momentum reached a strong daily resistance level. Unless price action can decisively break above this resistance, the trend is likely to persist in favor of the bears.

It’s the right time to short📌Fundamentals:
This week, the Federal Reserve will hold a rate decision, which is expected to dominate the market this week. In addition, we need to continue to pay attention to news related to the international trade situation.
📊Technical aspects:
The 1-hour moving average begins to turn, so the unilateral decline of gold has temporarily come to an end. However, the rise of gold has reached the key resistance area in the early stage, which is the starting point of the early stage of 3330. It is obviously not appropriate to chase more at this position, so the short-term may begin to adjust, and gold will go short at 3325 first. The market is changing rapidly. If gold breaks upward without stepping back, there will be no opportunity to go long. Then there is no need to chase more gold. Go short first and look at the decline and adjustment. On the whole, the short-term operation strategy of gold today is to go short on rebounds and go long on pullbacks. The short-term focus on the upper resistance of 3328-3330, and the support on the lower side is 3280-3293.
🎯Practical strategy:
Short gold when it rebounds to around 3325-3328, target around 3300-3280.
Buy gold when it falls back to 3280-3295, target around 3325-30.

Long ESSwing from last week, back at breakeven.
Entry with possible support at around $5650 (I entered early…)
SL below $5600-
TP $5800 and lets let 1 runner go to $6000 if AMD earnings goes well!

Wheat Trade ideaWheat has been in a downtrend for the past two years, but right now it’s sitting in a strong demand zone on the weekly chart for the year. Both the technicals and fundamentals are starting to look bullish, so this could be a solid setup for a long trade even if the overall trend is still down.
On Thursday, April 24, there was a nice daily rejection between the 545’00 and 539’00 levels. That would’ve been a good entry based on my strategy.
Most traders would avoid this kind of trade because of the strong downtrend, but I see everything lining up here: demand zone, fundamentals, and rejection. It doesn’t mean the market will reverse, but the risk is worth the potential reward.
I’m not expecting a huge move just taking what the market gives me. If fundamentals keep supporting the move, I’ll hold longer. If not, I’ll take profit earlier. It’s about staying realistic and disciplined.

Gold new Update 🧠 Chart Analysis Summary:
Current Price: Around 3,240.610.
Resistance Zone: 3,256 – 3,264 (highlighted in orange).
Support Zone: Around 3,220 (highlighted with a green target).
Chart Pattern: Looks like a possible liquidity grab above before a potential sell-off (indicated by the hand-drawn zig-zag upward move and large downward arrow).
🎯 Trade Setup Suggestion (Short Position):
Entry: Around 3,256 – 3,264 (wait for price to enter this supply/resistance zone).
Stop Loss (SL): Just above 3,270, ideally at 3,273 (above the marked resistance).
Take Profit (TP): Around 3,220, as marked on the chart (support area).
⛳ Summary:
Risk: ~10–15 points.
Reward: ~35–40 points.
Risk-to-Reward: Roughly 1:3, which is favorable.

FIL Stands While the Top 20 Bleed – Watch This DivergenceWhile top 20 crypto assets flash red across the board, Filecoin (FIL) prints green — up +0.49% on the day. This isn't noise — it's signal.
Price is holding its ground above support while sitting just under the 50 EMA resistance at $2.79. Bear Load at 75% means pressure, but it’s thinning.
The shakeout phase might be nearing its end.
MACD is flattening — signs of reversal brewing.
Smart capital hunts relative strength when others panic.
FIL is showing resilience, potential accumulation, and could be preparing for a break while the rest sleep.
Quant eyes are watching.
#FIL #Filecoin #CryptoTrading #TrendReversal #QuantEdge #Altcoins #MarketDivergence #TechnicalAnalysis #EMA #MACD

Gold (XAUUSD) 4H Chart – Key Resistance Test: Breakout or RejectSimple Analysis:
Price is currently at a resistance zone (~$3,335).
Two possible outcomes are drawn:
Bullish scenario: Break above current resistance → move toward the next resistance (~$3,500+).
Bearish scenario: Rejection from current resistance → fall back to the support zone (~$3,240).
EMAs:
50 EMA (red) is above 200 EMA (blue) = bullish bias, but price must break resistance to continue upward.
Summary:
Watch for a breakout above ~$3,335 for bullish continuation, or a rejection for a potential drop to support near ~$3,240.

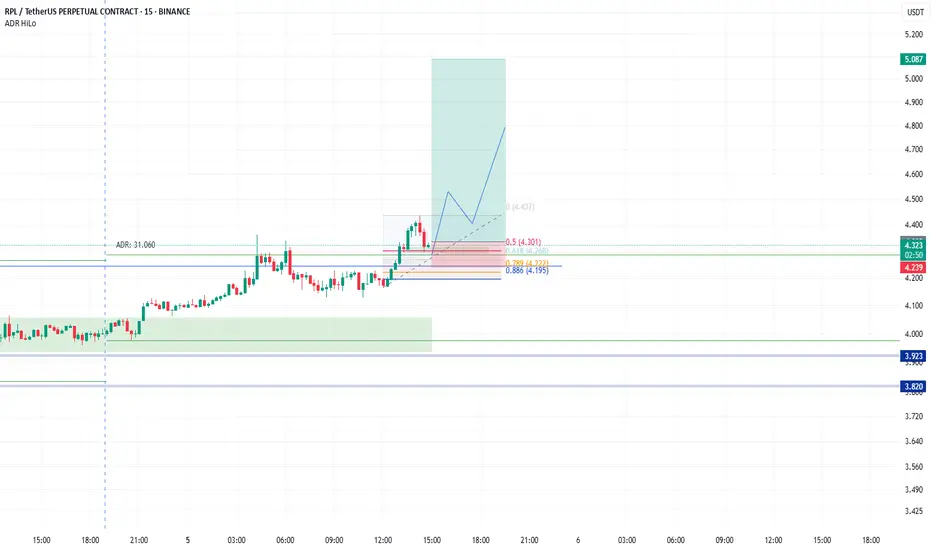
RPLUSDT lucrative long opportunityRPLUSDT showing stong bullish momentum while others crypto asset didnt . this is the best point to jump on
BTC Next target 70kwaiting for one bad news that will accelerate the fall of BTC into this zone, the Printing press has not yet been launched, the data is stable but everything is on the verge of collapse, in order to start the movement of lowering the rate and the printing press, the market needs to collapse again

EURCAD SHORTInitiating a short on EUR/CAD as risk sentiment deteriorates and technicals point to a downside move. The pair has failed to break above and is forming a potential lower high, with momentum indicators showing bearish divergence. A break below adds confirmation to the
short setup.
Entry:
Stop Loss:
Take Profit:
Risk/Reward Ratio:
Timeframe:

XAUUSD - Gold Trend Before FOMC!Gold is trading above its EMA200 and EMA50 on the 4-hour timeframe and is trading on its uptrend line. A continued upward move in gold will put it in the supply zone, where it is possible to look for short positions. A downward correction in gold will also open up long positions.
Gold traders endured another turbulent week, marked by the second consecutive decline in prices—once again underscoring the market’s acute sensitivity to economic news and developments.
Adrian Day, CEO of Adrian Day Asset Management, offered a cautiously humorous take on the situation by likening it to the Peggy Lee song that asks, “Is that all there is?” He pointed out that gold has pulled back by over 7% from its recent high in less than two weeks.Although this correction is notable, it hasn’t been deep enough to flush out all short-term traders or weak-handed investors from the market.
Day added that rising fears of a U.S. recession—which typically exert early downward pressure on gold—alongside the possibility of easing U.S.-China trade tensions, may limit investment demand for gold in the short term. Concluding his comments, he maintained a cautious stance, saying that further downside remains likely and that his outlook for the coming week is bearish.
Meanwhile, U.S. President Donald Trump, in a new interview with NBC, addressed several key economic and political issues. He stated that if necessary, the deadline for selling TikTok would be extended, and some tariffs on Chinese goods might become permanent. Nevertheless, he indicated that he is also considering reducing certain tariffs in the future.
Trump emphasized that small businesses do not require additional assistance and that the Federal Reserve should cut interest rates. He confirmed that Jerome Powell will remain Fed Chair through the end of his term in 2026. He also mentioned potential successors for his own position, naming Vance and Rubio as possibilities.
After a week dominated by employment data, the upcoming week will be entirely focused on monetary policy. The centerpiece will be the May FOMC meeting, the Fed’s rate decision, and Jerome Powell’s press conference on Wednesday. While markets broadly expect the Fed to hold rates steady, Powell’s official remarks and answers to press questions—especially following his sharp tone earlier in April—will be under close scrutiny.
It is widely expected that the Federal Reserve will leave its key interest rate unchanged on Wednesday, as policymakers assess how President Trump’s tariffs gradually impact various sectors of the economy. Markets are currently pricing in a potential rate cut starting in July. The Fed’s dual mandate is to maintain low inflation and high employment, and it may face a dilemma if tariffs negatively affect both indicators, as many economists now warn.
Immediately following the Fed meeting, senior policymakers including Barr, Kugler, Waller, and Cook will travel to Iceland to attend the Reykjavik Economic Conference. On Friday, they will participate in panels discussing artificial intelligence, labor market trends, and monetary research—topics that could offer insights into the Fed’s long-term policy direction.
Simultaneously, traders are also awaiting two key reports: the ISM Services Index for May, due today, and weekly jobless claims figures set for release on Thursday. Together, these reports will help complete the picture of the U.S. economy as critical monetary policy decisions approach.

Gold's Momentum ContinuesI've been waiting for price to tap 3211 to look for the buys setup.
This is a classic 1,2,3 bullish flag that has potential to see Gold to ATH once more

Consumer Goods Sector Calls on Trump for ExemptionsBy Ion Jauregui – Analyst, ActivTrades
Trade policy returns to the center of the U.S. economic stage. Donald Trump, in his new electoral program, has reignited his protectionist strategy with proposals for additional tariffs that could exceed 60% on certain products, including footwear, electronics, and manufactured goods imported from China and other regions. This measure, if implemented, will have direct consequences on the business fabric listed on Wall Street and, by extension, on the main stock indices.
Impact on major brands
Companies like Nike (NYSE: NKE), Skechers (NYSE: SKX), and Adidas (ETR: ADSGn), although the latter is listed in Europe, have already expressed their concern. Together with more than 70 other brands, they have asked the administration to exclude footwear from the new tariff package, arguing that adding an extra 145% to the current tariffs — which already range between 20% and 37.5% — would be a direct blow to their profitability and pricing structure, and would slow down their sales forecasts. This fear is not unfounded: both Adidas and Skechers have revised their U.S. sales forecasts downward, anticipating a drop in consumption due to the increased cost of their products.
Repercussions on stock indices
The effects are not limited to companies directly affected. The S&P 500, which includes the 500 largest U.S. companies, covers numerous sectors exposed to imports and international supply chains. An increase in tariffs translates into:
• Reduction of corporate margins in sectors such as discretionary consumption, retail, technology, and automotive.
• Drops in quarterly profits, which could lead to downward revisions in valuations.
• Greater market volatility, since investors usually react cautiously to aggressive protectionist policies.
The Nasdaq 100, with high exposure to tech companies such as Apple (NASDAQ: AAPL) or Tesla (NASDAQ: TSLA), is also in the spotlight. Many of these firms depend on components manufactured in Asia, so a tariff escalation implies higher costs and possible delivery delays, directly affecting their operations.
Meanwhile, the Dow Jones Industrial Average, more concentrated in industrial and consumer sectors, could be affected by pressure on companies such as 3M, Boeing, or Home Depot, especially if domestic demand is impacted by the rising cost of imported goods.
Risks for the corporate economy
The risk goes beyond consumption. Increasing the tariff burden also implies higher operating costs for importing companies, reducing margins, pressuring quarterly profits downward, and in many cases, affecting stock prices. In addition, multinationals that manufacture in Asia could be forced to restructure their supply chains, which would involve unforeseen investments during a global economic slowdown.
Skechers Analysis
The company has been trading lower continuously after a poor start to the first quarter from its highs at the end of January at $78.24, added to the bearish gap caused by Donald Trump's tariff policy. The price is currently supported around the $45.58 level and trading in a middle area around $48.50. Its current upper zone is $56.70 and its lower zone is $42.50. If the price holds during the quarter, we could see a return to the upper part of the indicated range. Otherwise, if the results are as severe as forecasted, Skechers may test the support again and seek a new lower support zone around the current lows of $31.28.
Fiscal and political context
Although employment in the U.S. has shown resilience, with 177,000 new jobs created in April and an unemployment rate of 4.2%, the economic cooling is evident. Trump's proposal includes not only tariffs but also a sharp cut in public spending: $163 billion less, with a 23% reduction in non-defense sectors such as education, healthcare, or research, while the security budget increases by 65%. This fiscal reorientation could cool internal demand and affect GDP growth in the medium term, raising the risk of recession in consumption-sensitive sectors.
Tariff policies are usually poorly received by financial markets due to their distorting effect on prices, international trade, and business confidence. In summary, the new tariff proposals could put downward pressure on U.S. stock indices, especially if the markets price in lower business profitability, increased costs, and a slowdown in consumption. An environment that, far from bringing calm, brings investors back to a more cautious mode.
*******************************************************************************************
The information provided does not constitute investment research. The material has not been prepared in accordance with the legal requirements designed to promote the independence of investment research and such should be considered a marketing communication.
All information has been prepared by ActivTrades ("AT"). The information does not contain a record of AT's prices, or an offer of or solicitation for a transaction in any financial instrument. No representation or warranty is given as to the accuracy or completeness of this information.
Any material provided does not have regard to the specific investment objective and financial situation of any person who may receive it. Past performance is not reliable indicator of future performance. AT provides an execution-only service. Consequently, any person acting on the information provided does so at their own risk.

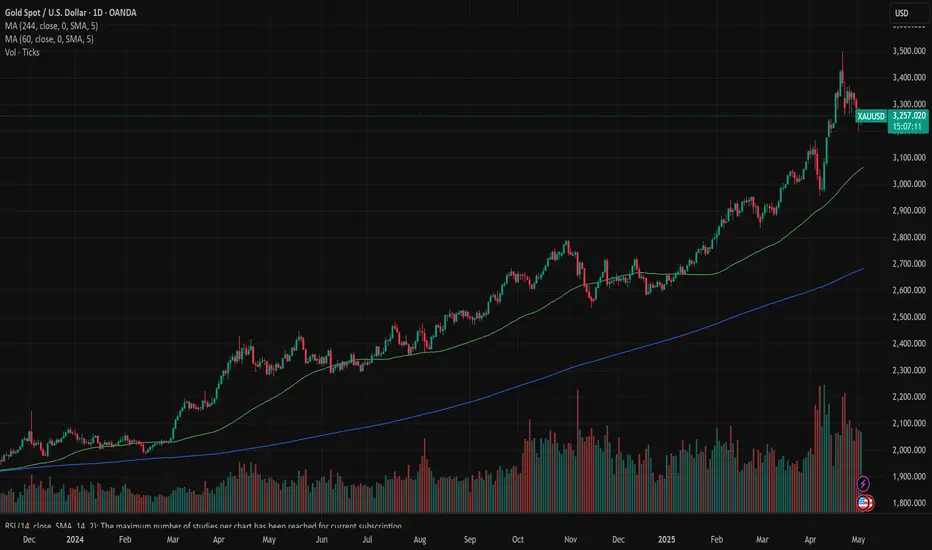
Gold: trade tariffs relaxationAs trade tariffs “war” entered into relaxation mode, so the price of gold was easing during the previous week. The major event concerning trade tariffs during the previous week was the announcement from China's government that they are considering negotiations with the US Administration regarding imposed tariffs. Additional influx came also from better than expected US jobs data, in which sense, gold was trading with a modest negative sentiment during the week. The week started by testing the $3.350 short term resistance line, however, it ended at the level of $3.240.
The RSI turned away from the overbought market side, and ended the week at the level of 53. This level still does not represent a clear sign that the market is ready to take the turn toward the oversold market side. Moving averages of 50 and 200 days, without change, continue to move as two parallel lines with an uptrend.
Fundamentals have driven the price of gold to the ATH in a previous period, so fundamentals will continue to impact the price of gold also in the future period. Trade tariffs were the main driver, so as the trade war is settling down, the price of gold might ease also in the coming period. Gold is currently testing the level from the mid-April this year. In case that it is breached, then the next potential level for gold might be around $3.150. Certainly, it should be considered that the FOMC meeting is scheduled for May 7th, which might bring some volatility back on the market, considering current market sensitivity regarding potential Fed's rate cut. At this moment on charts, the price of gold has equal probabilities for a move both toward the up, and down side.
Here is what you need to know on Tuesday, May 6:The US Dollar Index (DXY) managed to rebound from daily lows and end Monday’s session with humble losses near the key 100.00 hurdle. The final Balance of Trade data will be in the spotlight, seconded by the API’s weekly report on US crude oil inventories.
(DXY), which measures the value of the US Dollar against a basket of currencies, posted mild gains on Monday as the Taiwan Dollar surged over 5%. The move sparked a broader rally in Asian currencies amid speculation of FX conversions by exporters. Markets remained thin with multiple public holidays affecting liquidity.The DXY Index currently trades at 99.93, up 0.08% on the day, within a daily range of 99.46 to 100.05. Momentum remains neutral with a Relative Strength Index (RSI) of 40.84, while the Moving Average Convergence Divergence (MACD) flashes a buy signal. However, the 20, 100, and 200-day simple moving averages — at 100.13, 105.38, and 104.39, respectively — all point to continued bearishness. Additional downward pressure comes from both the 10-day and 30-day EMAs, which sit at 99.77 and 101.09. Key support is located at 99.60, with resistance at 99.77, 100.08, and 100.13.

S&P 500 Tests Key Zone Ahead of FOMCThe S&P 500 has reached the 5,700–5,800 zone after a nearly 18% rally in just half a month. This zone could determine whether the rally marks the end of the bearish trend or if more pain lies ahead for the stock market.
The 200-day simple moving average, several previous horizontal support levels, and the most recent top all converge in this area. The upward move has been driven by correction dynamics, optimism around potential trade deals, signs of de-escalation with China, and rising expectations for Fed rate cuts in 2025.
This week, the FOMC may either temper those optimistic rate cut expectations or hint at a more dovish tone. In either case, some profit-taking may occur ahead of the meeting, and the 5,700–5,800 zone is a strong candidate for that to happen.

Bitcoin - Bitcoin on the Road to $100,000?!Bitcoin is in its descending channel on the four-hour timeframe, between EMA50 and EMA200. If Bitcoin moves downward towards the specified demand zone, we can look for its next buying opportunities.
It should be noted that there is a possibility of heavy fluctuations and shadows due to the movement of whales in the market and compliance with capital management in the cryptocurrency market will be more important. If the downward trend continues, we can buy in the demand range.
In April, Bitcoin recorded a growth of 14.7%, successfully rebounding from a sharp early-month decline that had dragged its price down to $74,901. This level marks Bitcoin’s lowest price point in 2025 so far.
U.S. President Donald Trump, in an interview with NBC News, responded to growing concerns about a possible economic recession by saying that everything would be “fine.” He referred to the current phase as a “transitional period” and expressed confidence that the U.S. economy would perform “extraordinarily well.” When asked directly if he feared a recession, Trump replied, “No,” though he added, “Anything is possible, but I believe we are headed toward having the greatest economy in our nation’s history.”
On the other hand, Ethereum ended April with a 1.58% decline—marking its fifth consecutive month of losses. Over the past year, Ethereum has only seen gains in three months, and it is currently down 36.7% compared to the same period last year.
Strategy, formerly known as MicroStrategy, announced its intention to invest up to $84 billion in Bitcoin. The funds will be raised evenly through stock issuance ($42 billion) and debt securities ($42 billion).
In the first quarter of 2025, Strategy reported a profit of $5.8 billion from its Bitcoin investments, achieving a return of 13.7%. The company has also raised its annual targets, increasing its projected Bitcoin return from 15% to 25% and its dollar profit goal from $10 billion to $15 billion.Meanwhile, the short-term holder profit/loss ratio for Bitcoin has returned to a neutral level of 1.0, indicating balance between coins held at a profit and those at a loss. Historically, this level has often served as resistance during bearish phases. If prices remain above this point, it could signal strengthening momentum and a potential market recovery.
Elsewhere, reports indicate that Apple has violated a previous antitrust ruling by continuing to restrict users from accessing alternative payment methods outside of the App Store. The decision, issued by Judge Yvonne Gonzalez Rogers, now requires Apple to allow apps—including those related to crypto and NFTs—to operate without paying fees or seeking special approval. This ruling immediately strips Apple of its ability to collect commissions on out-of-app purchases and prohibits the company from monitoring or tracking such transactions.

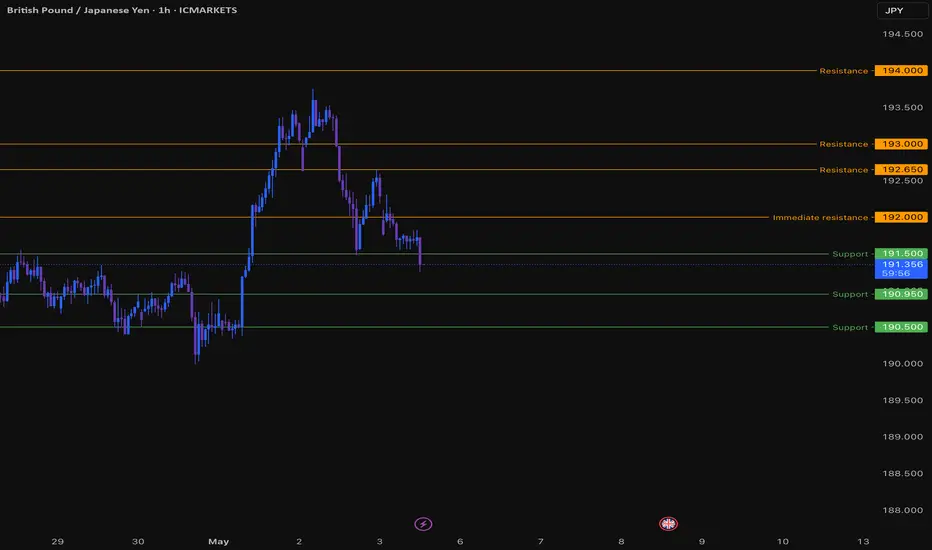
GBPJPY Trade IdeaGBP/JPY pared most of its gains as pound sterling weakens. It hits an high of 193.76 and is currently trading around 191.64 Intraday trend is bullish as long as support 190.95 holds.
The GBP/JPY pair is trading above 34 and 55 EMA (Short-term) and 200 EMA (long term on the 4-hour chart, confirms a bullish trend. Immediate resistance is at 192,a breach above this level targets of 192.65/193/ 194/195. Downside support is at 191.50/190.95/190.40/190.
Market Indicators
CCI (50)- Bullish
Directional movement index - Neutral
Trading Strategy: Buy on dips
It Is good to buy on dips around 191.67 with SL around 190.40 for a TP of 195.
Institutions Are Loading EUR/NZDIn the current market context, EURNZD is showing a highly compelling technical and fundamental structure for both short- and medium-term opportunities. After a prolonged retracement from the March highs, the price has strongly reacted from a clearly defined weekly demand zone between 1.8712 and 1.8600.
From a technical perspective, this reaction aligns with a moderate RSI divergence and a still intact macro bullish market structure, despite the corrective nature of recent weeks.
However, what truly validates this setup goes beyond price action alone. The latest Commitment of Traders (COT) data strongly supports the long thesis. On the euro side, we observe a significant increase in commercial long positions (+14,659 contracts), signaling institutional hedging activity. At the same time, non-commercials (speculators) have been cutting their short positions, suggesting growing expectations of euro strength.
On the NZD side, the picture is even more decisive: non-commercials maintain a net short position of -40,444 contracts, with a further reduction in long positions. The speculative sentiment toward the NZD is clearly bearish and shows no signs of short-term reversal.
Adding to this, retail sentiment data currently shows that 59% of retail traders are short on EURNZD. From a contrarian perspective, this is particularly bullish — the crowd is selling while smart money is buying.
Seasonality also supports the setup: historically, the months of May and June have been positive for the euro and negative for the NZD, adding an additional statistical layer of confluence to the trade idea.
🎯 Conclusion
We may be witnessing the early stages of a new bullish leg on EURNZD. The 1.89 area represents a potential re-entry zone in the event of a retest. The medium-term target is set between 1.9300 and 1.9500.
Technical structure, institutional positioning, retail sentiment, and seasonality all align in favor of a clear bullish bias in the coming weeks.

Daily Analysis- XAUUSD (Tuesday, 6th May 2024)Bias: Bullish
USD News(Red Folder):
-None
Analysis:
-Strong bullish momentum
-Looking for price to reach 0.618 fib level
-Potential BUY if there's confirmation on lower timeframe
-Pivot point: 3300
Disclaimer:
This analysis is from a personal point of view, always conduct on your own research before making any trading decisions as the analysis do not guarantee complete accuracy.

Arm - Positive outlook ahead of earnings - Value to collect?Hi guys we would be looking into our analysis for ARM Holdings before their earnings call!
ARM Holdings (ARM) – Positive Outlook Ahead of Earnings
ARM Holdings plc, a leading provider of semiconductor intellectual property, is poised to deliver a strong earnings report, driven by robust demand for its advanced chip architectures, continued growth in AI and data center markets, and deepening strategic partnerships across the tech ecosystem. As we approach the upcoming earnings announcement, several key factors support a bullish thesis on ARM's stock.
1. Strong Market Position and Licensing Growth
ARM continues to dominate the RISC-based processor architecture market, with its designs powering over 99% of smartphones and making significant inroads into the computing and server space. The company's royalty and licensing model provides a resilient revenue base, which has historically performed well even during industry slowdowns. Recent licensing agreements with leading tech companies, including NVIDIA, Apple, and Amazon, signal continued reliance on ARM's technology.
In Q1 2025, analysts expect double-digit year-over-year growth in licensing revenue, reflecting heightened demand for ARMv9 architecture, which powers next-generation AI and machine learning workloads. This growth is being further fueled by increased adoption in automotive and IoT sectors.
2. AI and Data Center Tailwinds
The surge in AI demand is transforming the semiconductor landscape. ARM's energy-efficient designs are increasingly being integrated into AI accelerators, edge devices, and cloud data centers. The company's Neoverse platform has been gaining traction, especially as hyperscalers seek alternatives to x86 architectures for power- and cost-efficiency. Amazon Web Services’ Graviton processors, based on ARM, are a prominent example of this trend.
As AI infrastructure spending accelerates globally, ARM stands to benefit significantly. Positive forward guidance around AI-related royalties and design wins would further validate this tailwind in the upcoming earnings report.
3. Financial Strength and Margin Expansion
Analysts anticipate revenue growth of 20-25% YoY in the upcoming report, accompanied by improved gross and operating margins. ARM’s high-margin royalty revenue stream contributes significantly to profitability, and recent cost controls have enhanced operational efficiency.
The IPO in 2023 provided a strong capital base, enabling increased R&D investment while maintaining financial flexibility. Shareholder sentiment has been buoyed by ARM's prudent capital allocation and expanding free cash flow profile.
4. Ecosystem Momentum and Strategic Partnerships
ARM’s ecosystem-first approach—collaborating with chipmakers, software developers, and system integrators—has become a key competitive advantage. The company's recent partnerships in the automotive and industrial sectors highlight growing non-smartphone revenue streams. Additionally, ARM is collaborating closely with AI chip startups and hyperscalers, reinforcing its central role in the evolving semiconductor landscape.
Investors should also watch for updates on ARM’s role in emerging verticals such as AR/VR, smart cities, and secure edge computing, all of which could significantly boost its long-term growth narrative.
5. Technical and Sentiment Indicators
From a technical standpoint, ARM stock has shown resilience, trading above key moving averages and gaining momentum in recent weeks. Options activity suggests bullish sentiment, with increased call buying ahead of earnings. If the company delivers a beat-and-raise quarter, it could catalyze a breakout to new highs.
📌 Trade Plan
📈 Entry: 121
✅ Target: 144 Below the strong resistance
❌ SL: 95 - Above the strong support

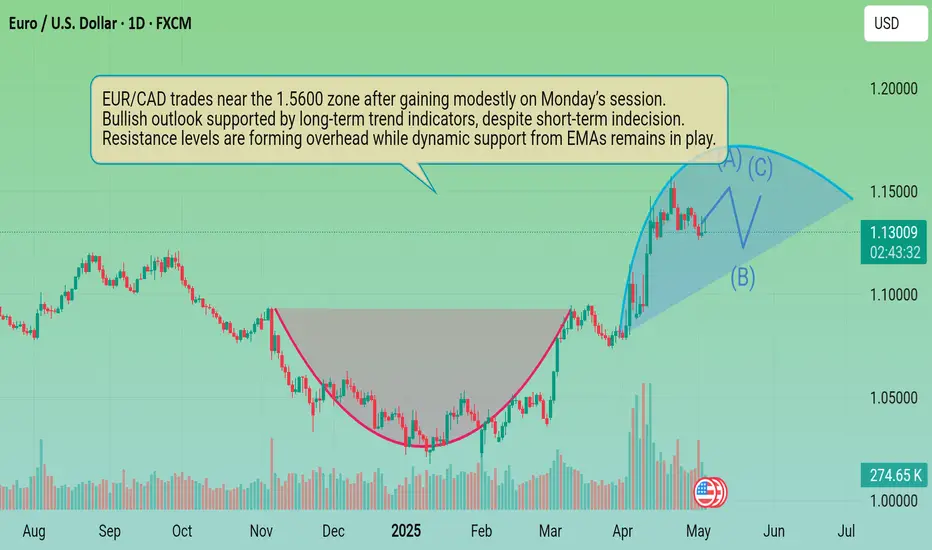
EUR/CAD Price Analysis: Euro edges higher near 1.5600 as longer-The EUR/CAD pair ticked higher on Monday, trading around the 1.5600 area after the European session. While price action remained within the middle of the daily range, the pair showed signs of underlying strength, aligning with a broader bullish structure. Momentum signals remain mixed for now, though the longer-term trend bias continues to favor the euro over the loonie.
Technically, the EUR/CAD setup holds a bullish tone despite some neutral momentum signals. The Relative Strength Index sits near 49, showing a balanced market, while the Moving Average Convergence Divergence leans bearish with a soft sell signal. The Awesome Oscillator is neutral, and the Bull Bear Power indicator suggests a slight bias toward buying pressure, offering mild confirmation of demand.