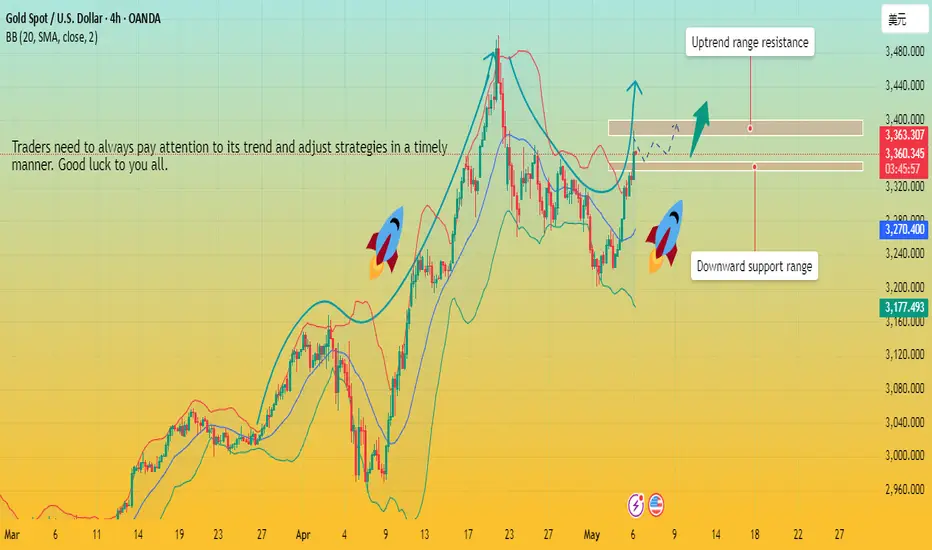
Gold (XAUUSD) 4H Chart – Key Resistance Test: Breakout or RejectSimple Analysis:
Price is currently at a resistance zone (~$3,335).
Two possible outcomes are drawn:
Bullish scenario: Break above current resistance → move toward the next resistance (~$3,500+).
Bearish scenario: Rejection from current resistance → fall back to the support zone (~$3,240).
EMAs:
50 EMA (red) is above 200 EMA (blue) = bullish bias, but price must break resistance to continue upward.
Summary:
Watch for a breakout above ~$3,335 for bullish continuation, or a rejection for a potential drop to support near ~$3,240.
Fundamental Analysis


MUR | Long Setup | Strong Dividend | (May 2025)MUR | Long Setup | Undervalued with Strong Dividend | (May 2025)
1️⃣ Short Insight Summary:
Murphy Oil (MUR) is showing a pattern very similar to its 2020 structure — with a recent consolidation from late March to early May that could lead to a bounce. Technically and fundamentally, this setup looks interesting for a long entry.
2️⃣ Trade Parameters:
Bias: Long
Entry: Around current levels ($21–$22)
Stop Loss: $15–$16
TP1: $28
TP2: $36
TP3: $44
TP4: Let the rest run
3️⃣ Key Notes:
The stock is currently trading well below its tangible book value of $35, which suggests it's significantly undervalued. Revenue stands at SEED_TVCODER77_ETHBTCDATA:9B , net income at $400M, and EPS at $2.70. The dividend yield is an impressive 6%, and beta is 0.8 — making it relatively less volatile than the broader market.
While the company has SEED_TVCODER77_ETHBTCDATA:2B in debt and $800M in free cash flow, the debt level is not alarming for a growing business — especially one with solid dividend policies. Earnings and revenue growth are slightly down on a quarterly basis, but annual forecasts still expect moderate growth. The company may be using the high dividend to attract long-term investors while working through current headwinds.
4️⃣ Optional Follow-up Note:
This isn’t a high-conviction setup, but it has a good risk-to-reward profile (roughly 1:5). If it plays out, great — and if not, the tight stop keeps risk limited. Will monitor closely for confirmation.
Please LIKE 👍, FOLLOW ✅, SHARE 🙌 and COMMENT ✍ if you enjoy this idea! Also share your ideas and charts in the comments section below! This is best way to keep it relevant, support us, keep the content here free and allow the idea to reach as many people as possible.
Disclaimer: This is not a financial advise. Always conduct your own research. This content may include enhancements made using AI.

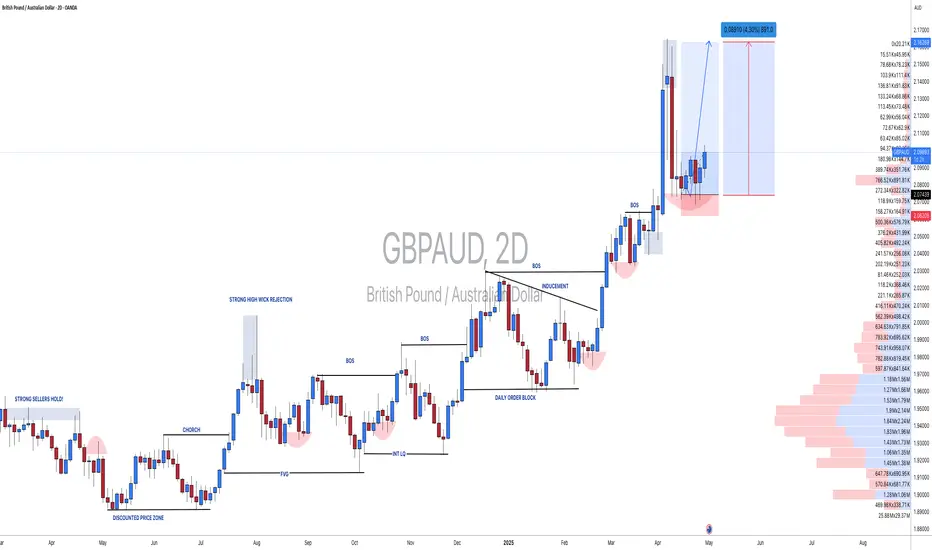
#GBPAUD: +245 From Previous Analysis, 880+ Total Pips TargetIn our previous analysis, we clearly indicated our entry point, and the price followed suit, reversing straight and currently up 245+ in positive. Going forward, we expect a straight, clean move of 800+ points. If you missed this entry, there will be a correction within the next 4 hours. Just analyse the pinpoint and enter accordingly with proper risk management.
Good luck and trade safely!
Thank you for your unwavering support! 😊
If you’d like to contribute, here are a few ways you can help us:
- Like our ideas
- Comment on our ideas
- Share our ideas
Team Setupsfx_
❤️🚀
Gold Price Analysis May 5The D candle cluster appears with the sellers still dominating. 3270 is still playing a key role in reversing the trend.
The h1 structure is creating a false break in the 70 zone and wants to continue falling in the corrective downtrend. Pay attention to the 3263 break zone in the European session, when breaking this zone, Gold will form an uptrend and the possibility of breaking the 3270 zone is very high. 3285 will be the next reaction zone when breaking 3270, then the Down wave of Gold will be broken. Gold can reach 3303 when there are retests to the support zones.
In the opposite direction, Gold does not break 3262 and continues to fall, it will be favorable for the downtrend and the possibility of forming a double top pattern and falling sharply is also quite high. The Trendline zone 3243 is considered an important support zone in the near future for the Gold price decline. Next, pay attention to the reaction zone of the daily support around 3225.

Dollar Decline Against All Major CurrenciesThe Dollar’s decline didn’t start with the recent ‘Liberation Day’ tariffs. In fact, it has been gradually weakening since the 1970s.
More recently, however, the Dollar has lost value against many currencies since January. Why is that?
Why have the USD/CHF and USD/SGD strengthened against the US Dollar over the past few decades? One reason is that both countries have managed their money supply with discipline. For example, as of end-2024, Switzerland’s net federal debt stood at 141 billion Swiss franc, their debt to GDP ratio at 17.2%.
In contrast, the United States has expanded its national debt at an alarming rate. Some might point out that Japan’s debt-to-GDP ratio is even higher—around 230%. That is why the Japanese Yen has also been in decline for decades.
Why does printing more money through QE and increasing the money supply weaken a currency?
Just imagine in a close economy with 10 people and 1 central bank. If the central bank printed $100 and distributed equally to the 10, each of them will receive $10 to buy 10 available cheesecakes.
But now the central bank decided to print $1,000 and each person will have $100 to buy 10 available cheesecakes.
The global economy is not a close, but an open system.
When the US and other major economies printed massive amounts of money, they didn’t just inflate their own economies—they exported inflation worldwide. This contributes to rising cost of living not all around the world.
In my view, Gold is also a currency pair against the US at the start of 1971. The moment dollar unpeg itself from gold, gold appreciates. With each QE, we can see how the currencies have diluted with gold and inflation appreciating over these years.
Why different currencies have started to appreciate against the USD since January this year?
We can see all the currencies have either reached its bottomed in January and started moving higher or it formed a reversal pattern like the Aussie dollar and the Dollar Yuan, in this case with this inverted hammer, it is indicating Dollar Yuan to reverse downward, meaning dollar coming off and yuan to appreciate.
January was President Trump inauguration and February was when he rolled out tariffs against Canada, Mexico and China, and the market do not like that and has been selling the USD against the rest of the currencies?
If US has printed the so much money, but why other than Swiss franc and Singapore Dollar, many other currencies have been depreciating against dollars over the past decades?
I’d like to hear your thoughts on this.
Euro FX Futures & Options
Ticker: 6E
Minimum fluctuation:
0.000050 per Euro increment = $6.25
Disclaimer:
• What presented here is not a recommendation, please consult your licensed broker.
• Our mission is to create lateral thinking skills for every investor and trader, knowing when to take a calculated risk with market uncertainty and a bolder risk when opportunity arises.
CME Real-time Market Data help identify trading set-ups in real-time and express my market views. If you have futures in your trading portfolio, you can check out on CME Group data plans available that suit your trading needs www.tradingview.com
Trading the Micro: www.cmegroup.com

Celanese Corp | CE | Long at $39.64Celanese Corp is another chemical company (like Dow Inc) crushed by tariffs and economic headwinds. It's dropped -78% in one year.... However, this is a very strong company with strong credit market interest and no immediate liquidity crisis. From a technical analysis perspective, this... like in 2008 and 2020... is the time to gather shares given it has reached the "abysmal crash" levels based on my selected simple moving averages. In the past, recovery to new highs has taken 1-2 years. History doesn't always repeat, but fear is opportunity in the stock market. If negative news continues to reign, a dip into the high $20's isn't out of the question.
If the company can squeak through 2025 and not continue to stack debt (debt/equity=2.43x), the growth opportunity into 2027-2028 looks promising.
I'm keeping my targets into 2026 low, but this could be a good buy and hold for the right investor.
Targets:
$47.00
$54.75

Trade Idea: Long (MARKET)Technical Confluence:
Daily Chart:
• Strong bullish engulfing recovery from recent support (~37,700).
• MACD starting to curl back up from deeply negative levels — possible trend reversal.
• RSI recovering above 50 (currently 52.49), suggesting bullish strength resuming.
15-Min Chart:
• Sustained uptrend with pullbacks respecting the moving average.
• MACD crossing positive territory.
• RSI at 64.77 with room to move higher before hitting overbought levels.
3-Min Chart:
• Tight consolidation after a sharp breakout to 40,766 — forming a potential bull flag.
• RSI at 58.89 — mid-level with upward momentum potential.
• MACD histogram shrinking — possible continuation breakout imminent.
⸻
Fundamental Context:
• Market Sentiment: U.S. markets are generally supported due to strong earnings reports and decreasing recession fears. Treasury yields have stabilized, and risk appetite is returning.
• Upcoming Events: FOMC rate decision is key — bullish bias if they hold or soften tone.
⸻
Trade Details:
• Entry: 40,770
• Price is consolidating just under this resistance. Enter on breakout with volume confirmation.
• Stop Loss (SL): 40,350
• Below recent support on the 15M chart and under the moving average. Conservative SL with volatility in mind.
• Take Profit (TP): 41,450
• Measured move from the flag pattern and aligns with Fibonacci extension and historical resistance.
FUSIONMARKETS:US30

"US500/SPX500" Index Market Money Heist Plan (Day / Swing Trade)🌟Hi! Hola! Ola! Bonjour! Hallo! Marhaba!🌟
Dear Money Makers & Robbers, 🤑💰✈️
Based on 🔥Thief Trading style technical and fundamental analysis🔥, here is our master plan to heist the "US500/SPX500" Index Market. Please adhere to the strategy I've outlined in the chart, which emphasizes short entry. Our aim is the high-risk Pink MA Zone. Risky level, oversold market, consolidation, trend reversal, trap at the level where traders and bullish robbers are stronger. 🏆💸"Take profit and treat yourself, traders. You deserve it!💪🏆🎉
Entry 📈 : "The vault is wide open! Swipe the Bearish loot at any price - the heist is on!
however I advise to Place sell limit orders within a 15 or 30 minute timeframe most nearest or swing, low or high level for Pullback Entries.
Stop Loss 🛑:
📌Thief SL placed at the nearest/swing High or Low level Using the 1D timeframe (5500) Day/Swing trade basis.
📌SL is based on your risk of the trade, lot size and how many multiple orders you have to take.
Target 🎯: 4750 (or) Escape Before the Target
💰💵💸"US500/SPX500" Index Market Heist Plan (Swing/Day Trade) is currently experiencing a Bearish trend.., driven by several key factors.👇👇👇
📰🗞️Get & Read the Fundamental, Macro, COT Report, Geopolitical and News Analysis, Sentimental Outlook, Intermarket Analysis, Index-Specific Analysis, Future trend targets with Overall outlook score... go ahead to check 👉👉👉🔗🔗
⚠️Trading Alert : News Releases and Position Management 📰 🗞️ 🚫🚏
As a reminder, news releases can have a significant impact on market prices and volatility. To minimize potential losses and protect your running positions,
we recommend the following:
Avoid taking new trades during news releases
Use trailing stop-loss orders to protect your running positions and lock in profits
💖Supporting our robbery plan 💥Hit the Boost Button💥 will enable us to effortlessly make and steal money 💰💵. Boost the strength of our robbery team. Every day in this market make money with ease by using the Thief Trading Style.🏆💪🤝❤️🎉🚀
I'll see you soon with another heist plan, so stay tuned 🤑🐱👤🤗🤩

The bias is for move to the upsideThe bias for the S&P 500 daily chart is for move to the upside but if we do get that follow-through I'm not looking for a dramatic move as the market gets ready to hear what the Fed has to say on Wednesday.

EURJPYMacro Economic Analysis / Fundamental Analysis
The ECB has kept the rates while also BOJ kept the rates at the moment. In the short term we expect the ECB to cut the rates whilst the BOJ to raise the rate, probably in the next meeting. So in overall, we expect the JPY to strengthen against the EURO.
Technical Analysis
We expect a liquidity sweep of the previous week candle, then a sharp fall of the EURJPY.

EURUSD Pullback – All Eyes on Interest RatesEURUSD remained calm yesterday, showing little to no change.
The main event this week is the U.S. interest rate decision – a key driver that could shape the pair’s next move.
Support levels remain unchanged at 1,1253, 1,1183, and 1,1055 – areas where price may react.
Keep a close eye on price action – a bounce from these levels could confirm a continuation of the bullish trend.

Wheat Trade ideaWheat has been in a downtrend for the past two years, but right now it’s sitting in a strong demand zone on the weekly chart for the year. Both the technicals and fundamentals are starting to look bullish, so this could be a solid setup for a long trade even if the overall trend is still down.
On Thursday, April 24, there was a nice daily rejection between the 545’00 and 539’00 levels. That would’ve been a good entry based on my strategy.
Most traders would avoid this kind of trade because of the strong downtrend, but I see everything lining up here: demand zone, fundamentals, and rejection. It doesn’t mean the market will reverse, but the risk is worth the potential reward.
I’m not expecting a huge move just taking what the market gives me. If fundamentals keep supporting the move, I’ll hold longer. If not, I’ll take profit earlier. It’s about staying realistic and disciplined.

Daily Analysis- XAUUSD (Tuesday, 6th May 2024)Bias: Bullish
USD News(Red Folder):
-None
Analysis:
-Strong bullish momentum
-Looking for price to reach 0.618 fib level
-Potential BUY if there's confirmation on lower timeframe
-Pivot point: 3300
Disclaimer:
This analysis is from a personal point of view, always conduct on your own research before making any trading decisions as the analysis do not guarantee complete accuracy.

Russell 2000: Looking Past the Short-term VolatilityCME: Micro E-Mini Russell 2000 Index Futures ( CME_MINI:M2K1! )
On Saturday, May 3rd, Warren Buffett took the center stage of the Berkshire Hathaway annual shareholder meeting. “What has happened in the last 30, 45 days … is really nothing,” declared the “Oracle of Omaha”.
Buffett brushed off recent stock market volatility that has rattled investors over the past weeks. “This has not been a dramatic bear market or anything of the sort,” he said.
In April, U.S. stock market took a deep dive after the start of Reciprocal Tariff against all U.S. trading partners. A few days later, we witnessed spectacular rally with a record daily gain, as a 90-day tariff pause was announced. On May 2nd, the S&P 500 completed a 9-day winning streak, the longest in 20 years.
After a month-long rollercoaster ride, the U.S. stock market is back to where it started. If an investor bought stocks in the beginning of April and then slept for the whole month, he wakes up today and may not even notice any changes in his portfolio.
Sunny Days ahead after the Storm
I concur with Buffet’s assessment that the U.S. economy is fundamentally strong. The supply chain disruptions are painful and will lead to product shortage, higher prices and layoffs in affected industries. However, trade conflicts will be resolved in a few months. The U.S. will be in a strengthening position, making its economy more sustainable.
The U.S. economy contracted 0.3% in Q1 2025, the first negative reading since 2022, according to the Commerce Department. However, the underlying data is much better if you look past the headline.
The formula: GDP = C + I + G + (X - M), where:
• C is consumer spending; I is investment by private business
• G is government spending; (X-M) is the net of exports minus imports
The key driver of the negative GDP is Imports. US buyers front-run the tariffs with massive orders, resulting in a 41.3% increase in imports. We also see a 21.9% gain in investment, primarily the result of US businesses building up inventory with imported goods.
• Imports and Investment contribute -4.83% and +3.6% to Q1 GDP, respectively. Both are one-time events and should not be taken as a long-term trend.
• Consumer spending grew 1.8% in Q1, contributing to 1.21% of GDP. Government spending contracted 1.4% in Q1, contributing to -0.25% of GDP.
Real Story: Q1 constant dollar GDP is +3.5%. By using a price deflator of 3.7%, the government reports a -0.3% “Real GDP at seasonally adjusted annual rates.”
Separately, the Bureau of Labor Statistics (“BLS”) reported that total nonfarm payroll employment increased by 177,000 in April, beating market expectations. The April unemployment rate was 4.2%, in line with expectations.
The above data supports my assessment of a solid U.S. economy. Once we walk past the tariff fear, the stock market will likely resume its growth.
Small Firms May Benefit More from New Trade Policies
A global supply chain helps corporate giants source from the most efficient and lowest cost suppliers. Small businesses may not be so lucky. Take the US textile industry as an example, the BLS data shows that 80% of domestic jobs have been lost since 2000.
The "de minimis" exemption is an import loophole that allows overseas packages under $800 to come into the U.S. duty-free. According to BLS data, e-commerce giants like Amazon, Shein and Temu source 80-90% of their products from overseas.
Closing the "de minimis" loophole and enacting fairer trade deals will help domestic manufacturers. By shielding from low-cost import dumping, a revitalized US manufacturing industry may not be far fetching.
Of the four major US market index, Russell 2000 performed the worst, flat in the last twelve months. Based on my analysis above, the Small Cap Russell index may have a better growth outlook compared to blue-chip indices.
Trade Setup with CME Micro E-Mini Russell 2000 Index Futures
Traders who take a bullish view in Small Cap could buy the Micro Russell Futures (M2K).
M2K contracts have a notional value of $5 times the index value. With Friday settlement price of $2042.70, each September contract (M2KU5) has a notional value of $10,213.5. Buying or selling one contract requires an initial margin of $932 at the time of writing.
The reason for selecting the September contract rather than the more liquid June contract is the time it takes to negotiate trade deals. While some trading partners may reach agreement within the 90-day window, others may not.
Micro Russell futures (M2K, $5) contracts tap into the deep liquidity of E-Mini Russell futures contracts (RTY, $50). As of last Friday, RTY has an open interest (OI) of 457,283 contracts, while the OI for M2K is 41,563, according to data from CME Group.
The risk of long Russell futures is a decline in the index. To hedge against the downside risk, a trader could set up a stop-loss in his buy order.
Hypothetically, a trader enters a buy order of M2KU5 at $2050 with a stoploss at $1950.
• If the Russell goes up 10% to 2,255, the trade will gain $1,025 (= (2255-2050) * 5). The theoretical return is 110% (= 1025/932). This is 10 times bigger than the gain in the underlying index, thanks to the leverage built into the futures contracts
• If the Russell falls 10% to 1,845, the maximum loss with be $500 (= (2050-1950) * 5). This is less than the initial margin of $932 and the trader will not face a margin call. The loss is limited even if your view is incorrect, thanks to the stoploss feature
Happy Trading.
Disclaimers
*Trade ideas cited above are for illustration only, as an integral part of a case study to demonstrate the fundamental concepts in risk management under the market scenarios being discussed. They shall not be construed as investment recommendations or advice. Nor are they used to promote any specific products, or services.
CME Real-time Market Data help identify trading set-ups and express my market views. If you have futures in your trading portfolio, you can check out on CME Group data plans available that suit your trading needs www.tradingview.com

Arm - Positive outlook ahead of earnings - Value to collect?Hi guys we would be looking into our analysis for ARM Holdings before their earnings call!
ARM Holdings (ARM) – Positive Outlook Ahead of Earnings
ARM Holdings plc, a leading provider of semiconductor intellectual property, is poised to deliver a strong earnings report, driven by robust demand for its advanced chip architectures, continued growth in AI and data center markets, and deepening strategic partnerships across the tech ecosystem. As we approach the upcoming earnings announcement, several key factors support a bullish thesis on ARM's stock.
1. Strong Market Position and Licensing Growth
ARM continues to dominate the RISC-based processor architecture market, with its designs powering over 99% of smartphones and making significant inroads into the computing and server space. The company's royalty and licensing model provides a resilient revenue base, which has historically performed well even during industry slowdowns. Recent licensing agreements with leading tech companies, including NVIDIA, Apple, and Amazon, signal continued reliance on ARM's technology.
In Q1 2025, analysts expect double-digit year-over-year growth in licensing revenue, reflecting heightened demand for ARMv9 architecture, which powers next-generation AI and machine learning workloads. This growth is being further fueled by increased adoption in automotive and IoT sectors.
2. AI and Data Center Tailwinds
The surge in AI demand is transforming the semiconductor landscape. ARM's energy-efficient designs are increasingly being integrated into AI accelerators, edge devices, and cloud data centers. The company's Neoverse platform has been gaining traction, especially as hyperscalers seek alternatives to x86 architectures for power- and cost-efficiency. Amazon Web Services’ Graviton processors, based on ARM, are a prominent example of this trend.
As AI infrastructure spending accelerates globally, ARM stands to benefit significantly. Positive forward guidance around AI-related royalties and design wins would further validate this tailwind in the upcoming earnings report.
3. Financial Strength and Margin Expansion
Analysts anticipate revenue growth of 20-25% YoY in the upcoming report, accompanied by improved gross and operating margins. ARM’s high-margin royalty revenue stream contributes significantly to profitability, and recent cost controls have enhanced operational efficiency.
The IPO in 2023 provided a strong capital base, enabling increased R&D investment while maintaining financial flexibility. Shareholder sentiment has been buoyed by ARM's prudent capital allocation and expanding free cash flow profile.
4. Ecosystem Momentum and Strategic Partnerships
ARM’s ecosystem-first approach—collaborating with chipmakers, software developers, and system integrators—has become a key competitive advantage. The company's recent partnerships in the automotive and industrial sectors highlight growing non-smartphone revenue streams. Additionally, ARM is collaborating closely with AI chip startups and hyperscalers, reinforcing its central role in the evolving semiconductor landscape.
Investors should also watch for updates on ARM’s role in emerging verticals such as AR/VR, smart cities, and secure edge computing, all of which could significantly boost its long-term growth narrative.
5. Technical and Sentiment Indicators
From a technical standpoint, ARM stock has shown resilience, trading above key moving averages and gaining momentum in recent weeks. Options activity suggests bullish sentiment, with increased call buying ahead of earnings. If the company delivers a beat-and-raise quarter, it could catalyze a breakout to new highs.
📌 Trade Plan
📈 Entry: 121
✅ Target: 144 Below the strong resistance
❌ SL: 95 - Above the strong support

Altseason coming very soon...Alt seasone is coming very quickly. Never know when it hits.... Just wait and do Nothing :)

Gold Market Retests After Weekly Supply SweepGold market mitigated the 3300 level, clearing weekly supplies at 3316. A reaccumulation is expected as price may retest the 3270 zone before the next directional sentiment sets in. follow for more insight , comment and boost idea

USDJPY, Bullish TrendFundamentally JPY is on bearish side
COT data shows highest long positions opened in JPY
dovish remarks by central bank positions JPY on bearish side
Expected stable rate of USD in coming FOMC rise bulls in USD
seasonality shoes USD bullish in MAY while JPY sideways
Current scenario of trump being lenient on tarrifs also bring momentum
in risk off scenarios i.e lower participant interest in JPY
On technical, USDJPY hit its strong weekly support level
Look for buy setups
68% fib retracement completed
Trendline support intact
currently sideways
buy in parts
buy 1. CMP at small risk
buy 2. upon closing above 144.296
Stoploss below 143.5

Silver – Bearish Move Toward Support🧠 Market Overview:
Instrument: Likely Silver (based on file name).
Chart Context: The price is currently trading below both the 50 EMA (red) and 200 EMA (blue), indicating bearish momentum and a possible shift in market structure.
📊 Key Technical Components:
🔹 Exponential Moving Averages (EMA):
50 EMA (32.614) is above the 200 EMA (32.526) but both are above the current price.
This crossover is recent and could indicate the beginning of a larger downtrend if confirmed by continued price action below both EMAs.
🔹 Market Structure:
POI (Point of Interest) marks a previous swing high where selling pressure emerged.
The chart shows internal liquidity (INT.LQ) sweeps both above and below consolidation areas, hinting at smart money manipulation to grab liquidity before making a move.
🔹 Resistance Zone:
Clearly defined between approx. 33.4–34.0, where price was rejected after a failed attempt to break higher.
Multiple rejections from this zone show strong selling pressure.
🔹 Support Zone:
Sitting between approx. 30.8–31.2.
Price previously consolidated here before a bullish move, making it a likely target for a return test or a potential bounce.
📉 Bearish Scenario & Projection:
The price broke below a short-term structure and failed to hold above EMAs.
The current price action shows a bearish pullback likely to form a Lower High (LH).
The projected path shows a pullback to previous support-turned-resistance, followed by a breakdown targeting the support zone.
✅ Bias:
Short-term bias: Bearish
Medium-term bias: Bearish, unless price reclaims the 200 EMA and consolidates above the resistance zone.
🔍 Confluences Supporting Bearish Outlook:
Price below EMAs (dynamic resistance).
Failed higher highs with liquidity sweeps (indicating smart money selling).
Clear market structure shift to the downside.
Anticipated retest of support zone around 30.8–31.2.

AUDNZD (4H) Symmetrical Triangle Breakout+Falling Wedge ReversalOn the 4-hour chart of AUDNZD, the market has completed a compression phase inside a symmetrical triangle, nested within a larger falling wedge structure. Both patterns suggest a potential bullish reversal after an extended downward trend.
The breakout occurred to the upside, with price moving above the triangle and breaking through short-term resistance around 1.0713. Volume increased on the breakout, confirming genuine buyer interest. If the price holds above this level and breaks 1.0766, it opens the path to the next major target at 1.0844, aligned with the previous key swing level.
Technical picture:
– Symmetrical triangle breakout confirmed
– Price also broke out of the falling wedge
– Volume expansion on the move
– Bullish realignment of EMAs is starting
– Holding above 1.0713 + breaking 1.0766 will activate the next phase
Fundamental backdrop:
The Australian dollar is benefiting from resilience in the commodity and export sectors, while the New Zealand dollar faces pressure from weakening inflation and growing expectations of monetary easing by the RBNZ. This economic divergence creates short-term advantage for AUD over NZD.
This double-pattern setup confirms the transition from consolidation to bullish impulse. Holding above 1.0713 and a confirmed break above 1.0766 would unlock a move toward 1.0844. These patterns offer clean early entries into trend reversals.

Australian dollar hits five-month high after Australian electionThe Australian dollar continues to impress and has posted strong gains on Monday. European session, AUD/USD is trading at 0.6491, up 0.72% on the day and its highest level since early December 2025.
Prime Minister Anthony Albanese cruised to a resounding victory in Saturday's national election. Albanese' centre-left Labor Party increased its majority and thumped the Liberal Party opposition. The coalition's defeat was marked by its leader, Peter Dutton losing his own seat.
The long shadow of US President Donald Trump was a factor in the election. Dutton adopted right-wing policies such as promising tougher immigration laws and establishing a platform to reduce the waste of public funds. The similarities between Dutton and Trump hurt the Liberal leader as many voters were upset with Trump's 10% tariffs on Australia.
At the start of the year, Albanese was trailing badly in the opinion polls. However, he struck a receptive chord among voters on domestic issues such as health care and housing, and benefited from the anti-Trump sentiment, which proved to be a winning recipe.
US nonfarm payrolls, a key gauge of the US labor market, dipped slightly to 177 thousand in April, down from a revised 185 thousand in March. This easily beat the market estimate of 130 thousand. The positive unemployment report points to a resilient labor market which remains strong despite the US economy declining in the first quarter.
The markets have responded by lowering the odds of a rate hike in June to 33%, down sharply from 60% a week ago, according to the CME's FedWatch. The Federal Reserve meets on Wednesday and is virtually certain to maintain the benchmark rate of 4.25%-4.5%.

Gold is rising strongly. What is the reason?Analysis of today's market in Asian session:
Last week, the price of gold rebounded to above 3240, the lows were constantly rising, and the highs were broken; such a rebound is tempting traders to short.
In the morning of Asian session, the price of gold rose rapidly from 3320 to 3385 US dollars. In just two days, the price of gold recovered the decline during the Asian holiday. In the current market situation, it is not far away to rush back to the high point. The key to the price increase in the morning of Asian session may also support the European session and the US session. You can use a long strategy during this period.
However, you must pay attention to the continuity of the gold price. If there is an attack in the market transaction, there must be a defense; the downward or upward resistance level must be clear after the breakthrough position, how to operate to maximize the benefits and minimize the losses.
Quaid believes that if gold pulls back, its support point needs to focus on the 3340-3350 range, and the defense position is 3320; the position of the Asian morning rise should be paid attention to. If it falls below this position, you need to adjust the strategy in time.
Quaid believes that the upward trend is currently focused on $3380-3400.