Fundamental Analysis

XAUusd Scenario 05/05/2025 This week, Gold presents two potential scenarios based on current price action and key technical levels. While both a bullish and bearish outcome are possible, I’m leaning toward the bearish scenario and awaiting confirmation to capitalize on a potential downside move.

NASDAQ SCENARIO 27/04/2025English : According to our analysis, we anticipate a BULLISHscenario.
Morocan Darija : kanchofo d'apres l'analyse dyalna antsanaw TLOO3
ATENTION : I only share my ideas, not signals

EURUSD Bulls Reloading — Big Week Ahead? FOMCEURUSD has been riding the uptrend for a while now, but we’ve finally hit a bit of a pause. Recently, the pair posted one of its biggest up-days since 2009 — a huge bullish signal — and momentum carried it even higher! 🔥
Now, price has pulled back slightly from the highs, with last week showing a modest dip as the dollar regained some strength. I do expect we could see a little more pullback in the short term… but overall, my bias remains bullish. I believe the uptrend is still intact, and we could see EURUSD push higher again this week! 📈
What’s your view? Are you buying the dip or expecting a deeper correction?
Drop your thoughts below — and if you found this analysis useful, a boost or follow is always appreciated! 🙌

DEFENSE EU vs USEU defense massively outperforming the US up 50% from the lows.
Lockheed Martin is forced to console American allies, convincing them not to abandon the US Defense industry as Trump completely destroys it with his pro-Russia behavior.
I don't see any way back to NATO normal. Trump has weaponized the US defense industry against our (former allies?) allies and that is unacceptable. The US defense industry mostly sells $107 billion annually to NATO, EU nations.
This win-win EU-US relationship between our allies has made it possible for the US to develope and sustain military technology we would otherwise not have been able to afford alone.
So America first? Not really. More like America last!
At any rate, should a downturn occur and need to be long. #EUAD is a good place to be.

EUR/CAD: BULL HOLD LONG TERM From the view, the currency pair break of resistance, continue with the long term trend line with follow the gdp news of CAD currency pair.

Cold shower for bitcoinAs I mentioned earlier — when gold cools down, Bitcoin tends to rise. And when gold climbs, Bitcoin usually takes a breather. Don’t forget this dynamic.

Bitcoin Hype vs. Reality: A Breakdown of Bitcoin DelusionBitcoin enthusiasts often dream of mass adoption, corporate treasuries, and state-backed investments driving its price to astronomical levels. But let’s examine the actual numbers behind these claims.
🔹 The $1M Bitcoin Fantasy
Many believe Bitcoin will reach $300K, $500K, or even $1M. But what does that actually require?
💰 Bitcoin’s current circulating supply is approximately 19.5 million coins.
💰 At $830K per coin, the total market cap would be $16 trillion—which is:
✅ More than China’s entire GDP ($6T)
✅ 5x the market cap of Apple, Microsoft, Amazon, Google & Tesla combined
To put this into perspective, the entire global crypto market cap is currently around $2.99 trillion. Expecting Bitcoin alone to hit $16 trillion is beyond unrealistic.
🔹 Why Government & Corporate Adoption Won’t Skyrocket Price
Bitcoin believers often cite governments and corporations buying Bitcoin as proof it will moon. But here’s the reality:
⚠️ State & corporate purchases are OTC (Over-The-Counter) deals—they do not impact market prices like retail speculation.
⚠️ Governments negotiate strategically, they don’t impulsively buy at public prices to pump the asset.
⚠️ Treasury holdings do not guarantee higher prices—they only serve as reserves, not market drivers.
State adoption might increase legitimacy, but it won’t magically push Bitcoin past gold or global GDP levels.
🔹 Bitcoin’s Volatility vs. Gold’s Stability
Bitcoin is often compared to gold as a store of value, but its history tells a different story:
📉 Bitcoin has crashed over 80% multiple times—far from a stable asset.
📉 Extreme volatility makes it unreliable for wealth preservation.
📉 Liquidity issues create uncertainty, making it impractical for widespread adoption as money.
Gold, by contrast, has proven stability for centuries, with intrinsic value, industrial use, and universal acceptance.
🔹 Bitcoin Will NOT Absorb the Global Economy
Some claim Bitcoin will replace fiat, surpass gold, and absorb trillions in wealth. But the economic reality is:
❌ Bitcoin remains speculative, driven by market sentiment, not intrinsic value.
❌ No nation will abandon fiat for Bitcoin—they will regulate, integrate, but never replace sovereign currency.
❌ Bitcoin lacks industrial utility—gold has actual use in electronics, medicine, and aerospace.
🔹 The Crypto Dream vs. Financial Reality
Crypto thrives on believers, feeding them narratives that sound appealing but don’t match real-world economic fundamentals.
Bitcoin is not overtaking gold.
Bitcoin is not absorbing global wealth.
Bitcoin is not making every holder a millionaire.
Numbers don’t lie, but ignoring them won’t change reality. When the hype fades, speculative investors will face the harsh truth: Bitcoin is not a guaranteed path to riches—it’s a high-risk, volatile asset that operates in an unpredictable market.

Why Palladium Is the Smart Play Right NowGold is hitting record highs, and silver is riding the wave—but smart investors know that diversification is key. While everyone is chasing gold, Palladium and Platinum are quietly setting up for a massive opportunity.
🔹 Palladium’s Market Position
✅ Palladium is rarer than gold—annual production is significantly lower.
✅ Industrial demand is surging, especially in automotive catalytic converters.
✅ Supply constraints due to geopolitical factors and mining limitations.
🔹 Palladium’s Role in the Green Revolution
🌍 Palladium is critical for reducing vehicle emissions—used in catalytic converters to meet stricter environmental regulations.
⚡ Hydrogen fuel cells and clean energy tech are increasing demand for Palladium.
🔋 Electronics & semiconductor industries rely on Palladium for conductivity and durability.
🔹 Gold Is at the Top—Time to Rotate?
📈 Gold is at all-time highs, making it expensive for new investors.
📉 Palladium has corrected from its highs, creating a buying opportunity.
💡 Diversifying into Palladium & Platinum now could be a strategic hedge against gold’s potential pullback.
🔹 Palladium’s Supply Crunch
⛏️ Russia & South Africa control most of the world’s Palladium supply—geopolitical risks could tighten availability.
📉 Mining output is declining, while demand remains strong.
💰 Lower supply + rising demand = price surge potential.
🔹 Platinum: The Underrated Hedge
💎 Platinum is historically undervalued compared to gold & Palladium.
🚗 EV & hydrogen fuel cell adoption could drive Platinum demand higher.
📊 Platinum-to-Gold ratio suggests Platinum is deeply discounted.
🔹 Final Thoughts
Gold is great, but smart investors look ahead. Palladium and Platinum are positioned for growth, with strong industrial demand, supply constraints, and undervaluation compared to gold.
📢 Now is the time to accumulate Palladium & Platinum before the market catches on.
TVC:PALLADIUM TVC:PLATINUM TVC:GOLD TVC:SILVER

Ratio Charts in TradingView and IAAbove you can see the Bitcoin to Ethereum ratio chart. Ratio analysis between two or more symbols is a critical method for comparing the strength and weakness of assets relative to each other. TradingView offers basic capabilities for this task, but with the help of artificial intelligence (AI) and custom scripts, much more advanced and creative analyses can be conducted.
Here are some practical ideas:
1. Creating Conditional Ratio Scripts
2. Comparing Relative Averages and Issuing Smart Signals
3. Calculating Composite Ratios of Multiple Assets
4. Smart Alerts Based on Price Pattern Breakouts
For more information, search Google for "How to Use Ratio Charts in TradingView: A Hidden Gem for Traders."

EUR/USD Outlook: Sweep, FVG, and Breakdown — 1.0800 Next?EUR/USD Weekly Forecast
After a major and minor sweep near 1.1150, EUR/USD closed two consecutive bearish weeks, signaling a clear shift in momentum. Last week also confirmed a change of character, creating liquidity around 1.1270 and forming a daily Fair Value Gap at 1.1370, which has now been filled.
We expect the week to open bearish, targeting:
• 1.0900 (first liquidity zone)
• 1.0800 (main demand/discount area)
• Possibly even 1.0600 (extreme swing level) if momentum continues
Bias: Bearish
Key Zones:
• Resistance / FVG: 1.1370
• Target 1: 1.0900
• Target 2: 1.0800
• Extreme: 1.0600
Momentum is with the dollar, and EUR/USD still has room to drop toward the deeper demand areas.
—
Weekly forecast by Sphinx Trading
What’s your bias this week?
#EURUSD #ForexForecast #SmartMoney #LiquiditySweep #FVG #TechnicalAnalysis #SphinxWeekly #PriceAction

US100 / NASDAQ#US100 BEST PLACE TO SELL FROM|SHORT🔴
📉US100 SIGNAL
✔️Trade Direction: short
✔️Entry Level: 20,101.6
✔️Target Level: 18,779.9
✔️Stop Loss: 20,975.6
📊RISK PROFILE
⭐️Risk level: medium
⭐️Suggested risk: 1%
⭐️Timeframe: 1D
——————


What's next for XAUUSD?Will gold keep pushing Lower? It Seems to be respecting the higher timeframe(1w) CRT bias.... Only one way to find out...

[LONG] BTCUSDT | BTC Going Up n Up?Welcome,
- Status: 📈 Long
- TP & SL On Chart
Keep wait..
Lets see..

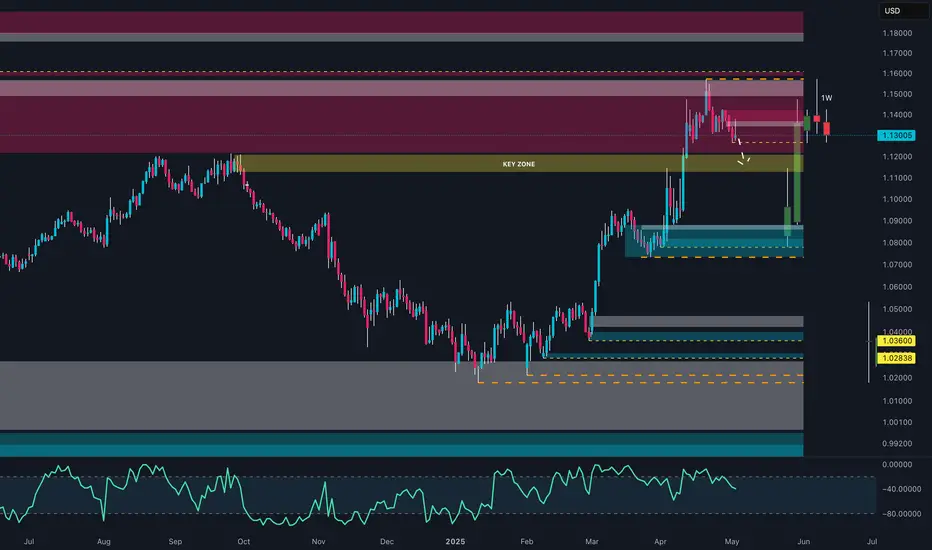
Did They Buy the Bottom? EUR/USD Set for Another Reversal!After an explosive bounce from the 1.0800–1.0850 demand zone, EUR/USD is now in a key structural retest around 1.1300. The COT data shows a net increase in long positions by Non-Commercials, but with the Dollar still holding structural strength in its own COT report and an RSI showing bearish divergence, this area may act as a key zone for price discovery.
📊 WHAT THE DATA SAYS:
📉 Price Action: Clear rejection from the 1.1450–1.1550 supply zone. Retest at key structure near 1.1300.
📑 COT (EURO): Net long positions up by +183 (196,388 long vs 120,591 short) = bullish tone.
📑 COT (USD): Still balanced, but Non-Commercials are reducing net longs → potential weakening.
📊 Retail Sentiment (MyFXBook): 70% retail traders are short = contrarian long bias remains.
🌱 Seasonality (May): Historically negative for EUR/USD (–0.0088) = potential downside pressure ahead.
📌 Key Levels:
Resistance: 1.1450 / 1.1550 (Supply Zone)
Support: 1.1300 (Structural retest) — 1.0850 (Strong demand)
📉 BASE SCENARIO: Pullback toward 1.1100–1.1050 before renewed long accumulation.
📈 ALTERNATIVE SCENARIO: Break above 1.1450 could target 1.1600–1.1720 zone.
🔍 Watch out for May's seasonal inversion and extreme speculative positioning — fakeouts may precede real directional moves.
Bitcoin Price Forecast: Potential Rebound to $97K After breakoutThis 30-minute chart of BTC/USDT (Binance) by Lauren_Trading_Queen suggests a bullish breakout from a descending channel. After a period of consistent decline, Bitcoin appears to be forming a base around the $95,200–$95,400 support zone. The forecast indicates a potential reversal targeting the $97,000 level, highlighting a possible upward momentum shift. Traders should watch for confirmation of this breakout and volume support before entry.
Bitcoin Quick Analysis: BTC/USDT is showing signs of a reversal after breaking out of a descending channel. Strong support around $95,200 holds, with a bullish target set at $97,000. If momentum continues, a short-term uptrend could followfollow
Trade with oven risk

GBPAUDIt is gonna Sell from marked level. I have analyzed my idea by doing Supply and Demand Methodology.

Idea For BTCUSD @@ 4 MAR 2025 - 11 MAR 2025 BTCUSD @@ 4 MAR 2025 - 11 MAR 2025
This Idea for 1 Week Only !! Fibo Weekly !!

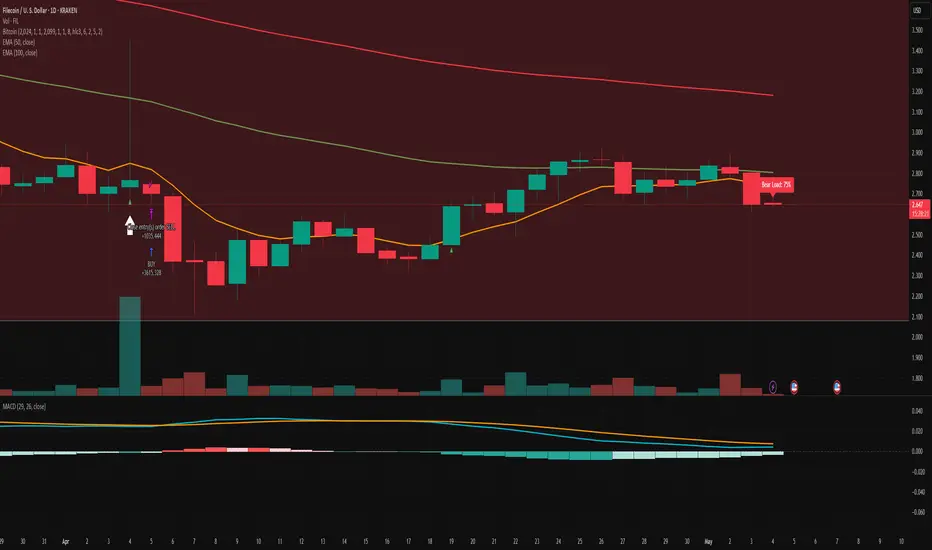
Filecoin Slips Below EMA 50 – Testing the BullsFilecoin just closed under the EMA 50 – a key short-term dynamic support.
EMA 50 broken = short-term weakness
EMA 100 overhead = trend pressure still heavy
Volumes fading — conviction drop?
This is a zone where weak bulls are forced out, and strong hands prepare.
The trend doesn’t care about hope. Stay mechanical.
Still watching $2.60 – $2.65 as the final defense line.
#FIL #QuantTrading #AlgoSignals #EMASetup #Filecoin #CryptoTrading

Gold Price Action Analysis – Breakout Potential Above ResistanceThis 1-hour chart for CFDs on Gold (XAU/USD) highlights key levels and potential scenarios based on recent price action. The current price is at $3,364.26, with an upward momentum of +0.85%. The chart marks a critical resistance zone (shaded red) around the $3,364 level. A breakout above this resistance may push price targets to $3,399 and potentially $3,410. Conversely, if price fails to break above, it may retrace to support zones near $3,340 or $3,320. Traders are watching closely for a breakout confirmation or a pullback.
Gold (XAU/USD) is currently testing a key resistance zone around $3,364. If it breaks above this level, price may target $3,399 and $3,410. If it fails, a pullback toward $3,340 or $3,320 is likely. Traders are watching for a breakout confirmation or rejection.

WTI rises above $57.50, continues recovery despite concerns overWest Texas Intermediate (WTI) crude Oil price continues to recover during Asian trading on Tuesday, hovering around $57.60 per barrel after a nearly 2% decline on Monday. However, gains were capped by concerns over rising global supply following an OPEC+ decision to accelerate output increases.
Last week, OPEC+, the Organization of the Petroleum Exporting Countries and its allies, agreed to ramp up production for a second straight month, announcing an additional 411,000 barrels per day (bpd) increase for June. This increase, contributed by eight members including Russia, brings the combined rise for April, May, and June to 960,000 bpd—effectively reversing 44% of the 2.2 million bpd in cuts implemented since 2022, according to Reuters estimates.
Sources within the group told Reuters that OPEC+ could fully reverse its voluntary cuts by the end of October if compliance with output quotas does not improve. Saudi Arabia is reportedly pressuring the group to accelerate the rollback of cuts to penalize Iraq and Kazakhstan for their repeated failure to meet agreed production targets.
