ON | Long Setup | Bullish Recovery Flow | (May 2025)ON | Long Setup | Breakout from Downtrend Channel + Bullish Recovery Flow | (May 2025)
1️⃣ Short Insight Summary:
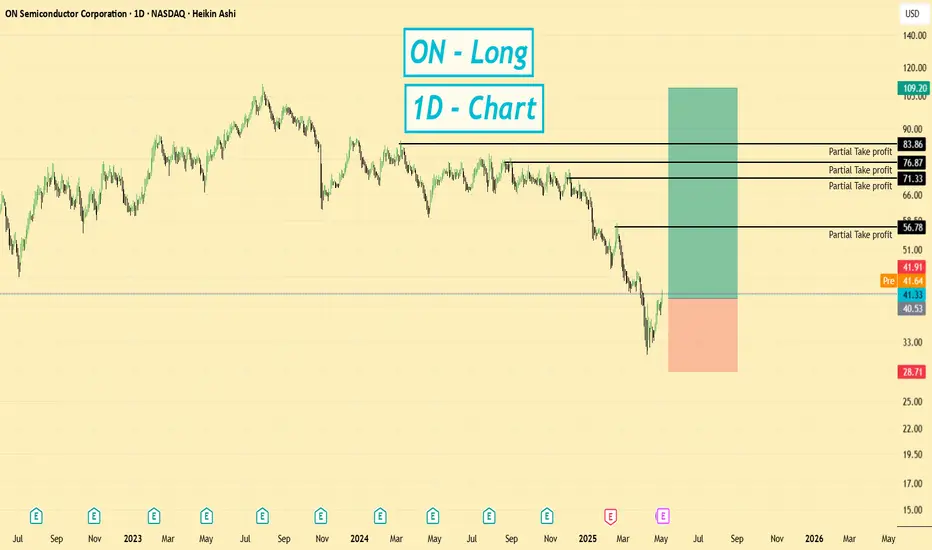
ON Semiconductor (ON) is breaking out of its long-term downtrend channel, showing strong price action and renewed momentum. A recovery seems to be gaining speed, and May could be a key turning point.
2️⃣ Trade Parameters:
Bias: Long
Entry: Around current levels (post-breakout zone)
Stop Loss: $28 (providing extra room for potential liquidation wicks)
TP1: $56
TP2: $71
TP3: $76
TP4: $83
3️⃣ Key Notes:
The stock just broke out of its declining channel and is now testing the 50-day moving average — a common resistance, but price strength and flow suggest we might push through. We’re also sitting on a major support zone that mirrors the May 2021 level, which historically provided a strong bounce.
Here are the fundamentals:
Revenue: SEED_TVCODER77_ETHBTCDATA:7B
Net Income: $1.5B
Tangible Book Value: ~$16.50
EPS: $3.67
Free Cash Flow: $1.2B
Cash on Hand: $2.6B
Debt: $3.6B
Beta: 1.7 (fairly volatile)
The dividend yield is currently unknown, but earnings are projected to grow steadily, with strong acceleration expected heading into 2028. This setup offers a mix of technical breakout and long-term growth expectations.
4️⃣ Optional Follow-up Note:
This idea will be monitored closely throughout May. If the bullish structure holds, we could see multiple levels get hit. I’ll provide updates if price action confirms further strength.
Please LIKE 👍, FOLLOW ✅, SHARE 🙌 and COMMENT ✍ if you enjoy this idea! Also share your ideas and charts in the comments section below! This is best way to keep it relevant, support us, keep the content here free and allow the idea to reach as many people as possible.
Disclaimer: This is not a financial advise. Always conduct your own research. This content may include enhancements made using AI.
Fundamental Analysis
GOLD ANALYSIS HIT +600 PIPS — PRECISION BEFORE NFP!GOLD ANALYSIS HIT +600 PIPS — PRECISION BEFORE NFP!
Caption (الوصف):
Our bullish forecast on Gold played out perfectly — over 600 pips secured before the NFP data dropped!
The breakout confirms bullish momentum, and price action is still showing signs of continuation.
We’re now watching key support zones around 3,240 and 3,168 — as long as those hold, the upside potential toward 3,360–3,480 remains valid.
Stay tuned for more precision setups like this one!
#XAUUSD #GoldAnalysis #ForexSignals #TechnicalAnalysis #NFP #PriceAction #ForexProfits #GoldTrading

EMN | Long Setup | Weak Fundamentals | (May 2025)EMN | Long Setup | Technical Breakout Watch Despite Weak Fundamentals | (May 2025)
1️⃣ Short Insight Summary:
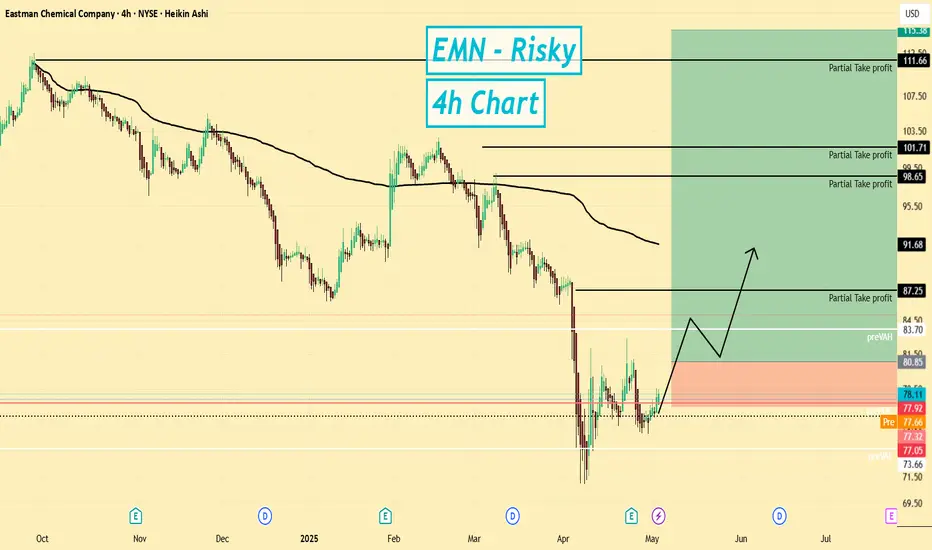
Eastman Chemical (EMN) has been in a downtrend for a while, and while the fundamentals look weak, the chart is showing a potential breakout setup. This idea is more technical than fundamental, and caution is advised.
2️⃣ Trade Parameters:
Bias: Long (only on breakout)
Entry: Watching for confirmation above current resistance
Stop Loss: Tight stop, near entry depending on breakout level
TP1: $87
TP2: $98
TP3: $101
TP4: $111
3️⃣ Key Notes:
Eastman's revenue is $9.4B, with net income at $900M and EPS around $7.90. The dividend yield is high at 4%, which signals that the company is trying to attract investors with yield rather than growth. However, this comes with red flags: high debt of $5.5B, negative cash flow, and weak fundamental momentum. This raises concerns of long-term sustainability. On a fair value basis (tangible assets), the stock could be worth closer to $10.47 — quite a gap from its current price.
Despite this, technicals show that if the price breaks the current resistance level, a short-term bounce could follow. This would be a small, speculative trade with quick exits at each take-profit level. Earnings are expected to show mild growth annually, but quarter-to-quarter it's still uncertain.
4️⃣ Optional Follow-up Note:
This is a low-conviction idea and not one I'd prioritize. I’m considering a small position if the breakout happens, but many other stronger setups are on my watchlist.
Please LIKE 👍, FOLLOW ✅, SHARE 🙌 and COMMENT ✍ if you enjoy this idea! Also share your ideas and charts in the comments section below! This is best way to keep it relevant, support us, keep the content here free and allow the idea to reach as many people as possible.
Disclaimer: This is not a financial advise. Always conduct your own research. This content may include enhancements made using AI.
Gold prices rose rapidly after falling. What happened?Gold prices rose in late Asian trading hours.
In the morning, gold prices stabilized above $3,250 as investors returned to defensive assets due to continued uncertainty in the US trade agreement with China and Japan, and increased geopolitical tensions in the Middle East and Ukraine.
The weak dollar before the Fed meeting and the decline in expectations for rate cuts also supported gold demand. The market focus remains on US trade news and the hawkish stance that the Fed may take this week.
Quaid's analysis of market views:
1. Despite the short-term adjustment in the market, the bullish logic of gold still exists, and bullish investors are more willing to buy when the price is low. The continued volatility of US government policies and the slowdown in US economic growth constitute strong support for gold.
2. During the previous Asian holiday, the gold market fell to the key support of $3,200. After the opening, Yanzhou buyers quickly bought at a low price, causing gold to rise rapidly in the short term.
Quaid believes that from a technical point of view, the gold price has reached the bottom resistance level of the range. If the price of gold does not react to the false breakout and continues to hit 3315-3320, then a breakout and consolidation above this level will strengthen it to 3320-3350.
Upward resistance: 3315, 3320, 3350
Downward support: 3265, 3250, 3220
Since the opening, the price of gold has retested 3269 twice. Buyers are testing the resistance level in the hope of a breakout. If the bulls break through 3315-3320 and consolidate above 3310, the possibility of an upside move will be high. However, the possibility of another test of the liquidity area of 3250 before the upside move cannot be ruled out.
If the price of gold breaks through the upward resistance, traders can try to go long in the short term and conduct scalping.
On the contrary, if the price of gold fluctuates sideways in the 3310-3315 range, Quaid recommends shorting in this range.

DOV | Long Setup | Strong Fundamentals | (May 2025)DOV | Long Setup | Technical Reversal + Strong Fundamentals | (May 2025)
1️⃣ Short Insight Summary:
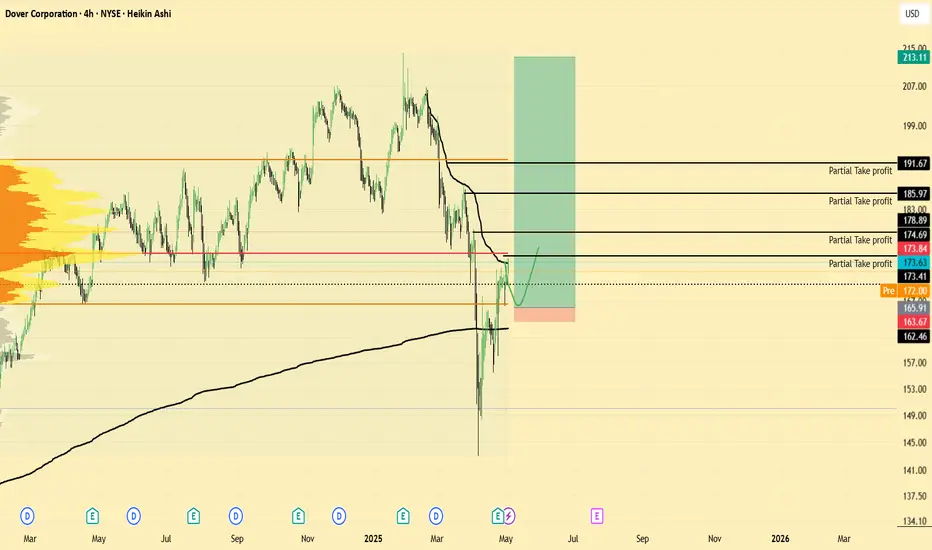
Today we're diving into Dover Corporation (DOV) — a well-diversified industrial name showing signs of a potential reversal. While the macro outlook stays positive, price action is sitting right at resistance, so we're watching for a pullback entry.
2️⃣ Trade Parameters:
Bias: Long
Entry: Around $165 (watch for reaction near value area low)
Stop Loss: $163 (tight, as structure remains bullish)
TP1: $173
TP2: $174
TP3: $185
TP4: $195
3️⃣ Key Notes:
Dover is a solid industrial manufacturer offering a mix of hardware, digital solutions, aftermarket services, and consumables. Revenue sits at $7.75B, with net income at $2.7B, EPS around $17, and dividend yield at 1.18%. The company has a market cap of $23B.
Earnings forecasts are solid on an annual basis, though short-term quarterly estimates hint at a possible dip in Q4 2025. Technically, we’ve been in a corrective downtrend since February, but momentum is returning. Price is currently testing resistance, so a small pullback toward the value area low could offer a great entry if we see a bullish reaction.
4️⃣ Optional Follow-up Note:
I'll update this idea if we get the correction and confirmation bounce. Stay tuned for updates based on price action around the entry zone.
Please LIKE 👍, FOLLOW ✅, SHARE 🙌 and COMMENT ✍ if you enjoy this idea! Also share your ideas and charts in the comments section below! This is best way to keep it relevant, support us, keep the content here free and allow the idea to reach as many people as possible.
Disclaimer: This is not a financial advise. Always conduct your own research. This content may include enhancements made using AI.
Why I'm not holding Tesla Tesla was dropping! I got in at around 220. However, within three weeks, I sold for a small profit.
BUT, why did I sell? This is why I'm not holding NASDAQ:TSLA
It's time to buy!
From a technical and historical point of view, buying Tesla right now makes perfect sense. The stock has a history of making significant price gains, is currently oversold, and is testing key support areas, such as the monthly 50 SMA.
A trader or investor who is 100% technical-based, this stock looks like a dream.
However, all the hype hits the floor when the fundamentals are considered...
Meh...
✔ The company has been increasing sales and cash year-on-year until recently
✔ Tesla has plenty of cash and assets. A simple acid test ratio shows liabilities vs. assets around 1:2.
❌ The issue is profit. Both gross and net profit margins have been falling year-on-year. The net profit margin is down from 15% two years ago to 7% last year.
❌ Worse, the current forecasts predict decreased sales and other key financials.
Poor and worsening financials are a clear red flag when buying stocks. Stay away. No matter how appealing the price looks.
Don't get me wrong, I don't think Tesla is doomed, and it may still yield returns. However, I would not be surprised if the stock consolidates or moves lower from here. For me, Tesla is not the significant buy it once was.

Gold Market Update:NFP data pushes price to hold strong at 3200 (demand zone) after recent high at 3500. Weekly outlook eyes 3298–3330 for mitigation and potential bearish continuation. follow for more insights , comment and boost idea

Oil is Doomed: Time to SELL (Part 2/3)Drill, Baby, Drill & Trump’s Oil Pressure
🇺🇸 Trump’s Oil Agenda
Trump wants cheap oil to bring down inflation and interest rates. His rallying cry? *“Drill, baby, drill.”*
That means: more drilling, more refining, more pipelines → more US oil flooding the global market.
💼 MAGA & Low Oil Prices
Trump believes cheap oil = strong economy . He also wants to pressure OPEC and Saudi Arabia to cut prices as a way to end the Russia-Ukraine war.
Flashback: In 2020, oil went negative ($-40!) when Saudi and Russia ramped production. History may rhyme again.
⚠️ Demand Problems
OPEC, IEA, EIA, Rystad — all lowering demand forecasts for 2025.
Even the most optimistic see demand growth at 1.2 million bpd , down from 1.85.
And that’s before green energy kicks in harder:
🔋 Solar & wind are now cheaper in 96% of the world.
🌍 Renewables are eating into fossil fuel demand.

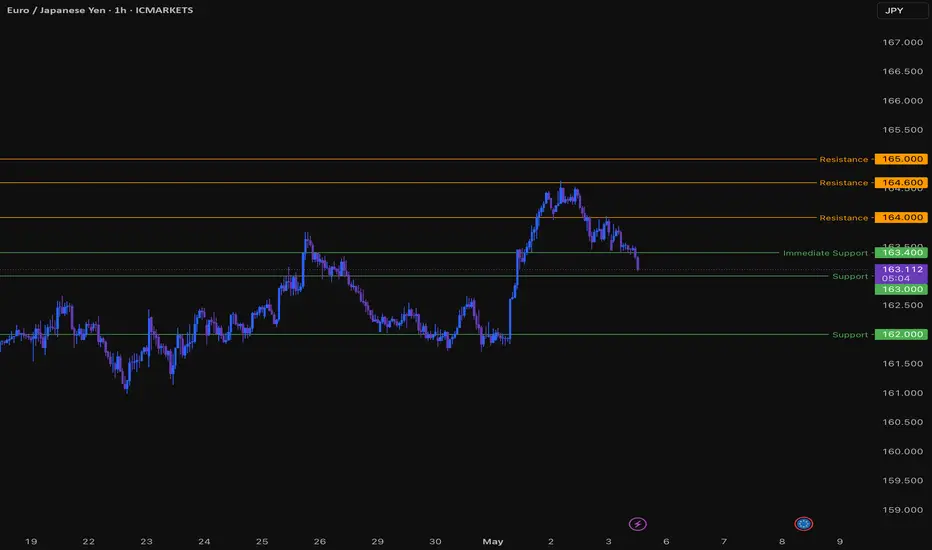
EURJPY Trade IdeaEUR/JPY showed a minor sell-off as yen gains due to tariff uncertainty. It hits an high of 164.60 and is currently trading around 163.41. Intraday outlook is bullish as long as the support 163 holds.
Technical Analysis:
The EUR/JPY pair is trading above 34, below 55 EMA and above 200-4H EMA on the 4- hour chart.
Near-Term Resistance: Around 164 a breakout here could lead to targets at 164.60/ 165/166.65/167.
Immediate Support: At 163.40 if breached, the pair could fall to 163/162/ 161.49/160.50/160/ 159.25/158.85/158.25.
Indicator Analysis 4-hour chart):
CCI (50): Bullish
Average Directional Movement Index: Neutral
Overall, the indicators suggest a mixed trend
Trading Recommendation:
It is good to buy on dips around 163 with a stop loss at 162 for a TP of 165/166.65.
USDCHF Trade IdeaUSDCHF trades flat despite upbeat US jobs data.It hits an intraday low of 0.82189 and is currently trading around 0.82590. Intraday bias appears to be bullish as long as the support 0.8180 holds.
The U.S. April 2025 Non-Farm Payrolls (NFP), released on May 2, 2025, reported decelerating employment expansion with a rise of 177,000 jobs, lower than a revised 185,000 in the prior month, while the unemployment rate held steady at 4.2%. Significant job gains were seen in health care, transport and warehousing, financial activities, and social assistance, but federal government jobs fell. Median hourly earnings increased 0.3% from last month and 3.8% over the year, and the average workweek continued at 34.3 hours.
Technical Analysis Points to Further Upside
The pair is trading below the 34-EMA and 55-EMA on the 4-hour chart indicates a minor down trend. The immediate resistance is at 0.8280 any break above targets 0.8300/0.8350/0.8380/0.8500.
Support Levels and Potential Declines
On the downside, near-term support is around 0.8180, any violation below will drag the pair to 0.8135/0.8090/0.8000.
Indicators
CCI (50) - Bearish
Directional movement Index - Neutral
Trading Strategy Recommendation
It is good to buy on dips around 0.8230 with a stop-loss at 0.8180 for a TP of 0.8500.

Bullfinder's Breakout Commodities - Natural GasWelcome to Bullfinder's Breakout Commodities - Commodities with breakout potential.
In this edition, we'll be looking at PEPPERSTONE:NATGAS ...
Our Team has identified that this code is at a point of particular interest & potential volatility.
After re-rating Natural Gas's momentum to Bullish on the 26th of Nov 2024, our Team has again set eyes on the commodity, noting the following important reference point...
If price can hold above $2.950 ... Significant Bullish potential may be unlocked.
If however price falls below $2.950 ... Significant Bearish risk may come into play.
We're inspired to bring you the latest developments across worldwide markets, helping you look in the right place, at the right time.
Thank you for reading! Stay tuned for further updates, and we look forward to being of service along your trading & investing journey...
Disclaimer: Please note all information contained within this post and all other Bullfinder-official Tradingview content is strictly for informational purposes only and is not intended to be investment advice. Please DYOR & Consult your licensed financial advisors before acting on any information contained within this post, or any other Bullfinder-official TV content.

Recession indicator #2 Just realized that measuring the spread between TVC:US02Y and FRED:FEDFUNDS gives you a pretty accurate heads up of looming recessions. We might be in one from a few months now.

AUDUSD Short PotentialTechnical Analysis
The AUDUSD pair is currently trending upwards due to USD weakness. The pair seems overbought based on stochastics > 80%
Fundamental Analysis
The RBA is widely expected to cut interest rates at its upcoming 20th May meeting. Inflation has fallen substantially based on previous RBA meeting minutes which warrants a current 25 basis points rate cut with more expected in the future.
Trade Setup
Short positions are preferred based on the current AUDUSD strength with a potential entry around .6547 which is near the 61.8% Fib level with a S/L at .6562 and T/P at the 50% Fib level around .6437.

BTC on high time frame
"Hello, focusing on BTC on high time frames, the price has pulled back to a significant zone around $75,000 and is currently showing bullish momentum. The next target appears to be the 4-hour order block located at $98,000."
If you need further assistance or have any specific questions, feel free to ask!

Is Uber a good buy at the current price? Here is whyHello,
Here is our outlook on Uber Technologies.
Uber Technologies, Inc provides a platform that allows users to access transportation and food ordering services. The Company operates through two segments: Core Platform and Other Bets.
The Core Platform segment consists of Ridesharing and Uber Eats. The Other bets segment consists of Uber Freight and New Mobility platforms. Ridesharing refers to products that connects consumers with drivers who provide rides in a variety of vehicles, such as cars, auto rickshaws, motorbikes, minibuses and taxis. Its Uber Eats platform allows consumers to search for and discover local restaurants and order meals through online.
TECHNICAL ANALYSIS- Checklist
Structure drawing (Trend line drawing on past price chart data)
Patterns identification (Naming patterns on past price chart data for future wave)- A correction forming. Price is at the bottom of the corrective wave.
Future indication (Reading indicator for future wave)- Await zero crossover on MACD
Future wave (Drawing on future price chart using future indication from indicator)- As shown in chart
Future reversal point (Identifying trend reversal point on price chart using structure)- Target at $100 per share
Uber Technologies, Inc. financial performance for Q3 2024 and the nine months ended September 30, 2024.
Total Revenue: $11,188 million for Q3 2024, $32,019 million for the nine months ended September 30, 2024.
Income from Operations: $1,061 million for Q3 2024, $2,029 million for the nine months ended September 30, 2024.
Net Income including Non-Controlling Interests: $2,599 million for Q3 2024, $2,944 million for the nine months ended September 30, 2024.
Net Income Attributable to Uber Technologies, Inc.: $2,612 million for Q3 2024, $2,973 million for the nine months ended September 30, 2024.
Basic Net Income per Share Attributable to Uber Technologies, Inc. Common Stockholders: $1.24 for Q3 2024, $1.42 for the nine months ended September 30, 2024.
Diluted Net Income per Share Attributable to Uber Technologies, Inc. Common Stockholders: $1.20 for Q3 2024, $1.36 for the nine months ended September 30, 2024.
Revenue from the United States and Canada was $17,304 million, Latin America was $2,068 million, Europe, Middle East, and Africa was $8,939 million, and Asia Pacific was $3,708 million for the nine months ended September 30, 2024.
Uber announced the pending acquisition of Foodpanda Taiwan from Delivery Hero SE for approximately $950 million in cash, expected to close in the first half of 2025.
Beginning in early 2025, Waymo and Uber will bring autonomous ride-hailing to Austin and Atlanta, only on the Uber app. In these cities, Uber will manage and dispatch a fleet of Waymo’s fully autonomous, all-electric Jaguar I-PACE vehicles that will grow to hundreds over time.
You can find a summary of financial statements here:
Our recommendation
Since February 2024, Uber's stock (UBER) has been undergoing a correction, largely driven by concerns over the rise of robotaxi services potentially eroding the market share of traditional ride-hailing giants like Uber and Lyft. Notably, Waymo—Alphabet's autonomous vehicle division—recently expanded to Miami and now completes over 150,000 self-driving rides per week. Tesla is also set to enter the space with a planned robo-taxi launch in late 2025.
However, Uber is not sitting idle. The company, in collaboration with WeRide, has launched an autonomous mobility service in Abu Dhabi and is targeting fully driverless commercial services by late 2025 in the same region. This demonstrates Uber's proactive strategy to stay competitive in the evolving ride-hailing landscape. Beginning in early 2025, Waymo and Uber will bring autonomous ride-hailing to Austin and Atlanta, only on the Uber app.
The sharp decline in Uber's stock price—down 34% in recent weeks. The MACD indicator is showing that we shall be having a zero crossover soon hence suggesting that selling pressure may be nearing exhaustion, potentially signalling a trend reversal. The stock appears poised to recover and return to a more balanced supply-and-demand dynamic.
Despite current challenges, we expect Uber to remain resilient and successfully navigate market headwinds. The current price level presents a compelling buying opportunity, with a target price of $100.00 offering significant upside potential for investors who act now.
Current price: $60.80
Good luck and best regards.

Fundamental Market Analysis for May 6, 2025 GBPUSDGBPUSD:
The GBP/USD pair started the new week on a subdued note and is fluctuating in a narrow trading range around 1.3260-1.3265, near the one-week low reached during the Asian session.
The US Dollar (USD) remains on the defensive below multi-week highs amid heightened economic uncertainty amid US President Donald Trump's tariff plans and is a key supportive factor for the GBP/USD pair. Furthermore, the prospect of more aggressive policy easing by the Federal Reserve (Fed) is further undermining the US Dollar.
Despite a better than expected US non-farm payrolls report on Friday, investors seem convinced that the US central bank will resume its rate-cutting cycle in June and reduce borrowing costs by 100 basis points by the end of this year. This, along with optimism about a potential de-escalation of the trade war between the US and China, is reducing demand for the safe-haven dollar.
However, traders seem reluctant to make new bullish bets on GBP/USD and prefer to wait for this week's key event - the Bank of England's (BoE) monetary policy meeting on Thursday. The UK central bank is expected to cut interest rates by 25bps and take a somewhat soft stance amid downside risks to growth from the trade war.
In addition, this week traders will face the publication of the FOMC meeting minutes, which will affect the USD price dynamics and give a meaningful impetus to the GBP/USD pair.
Trading recomendation: SELL 1.3280, SL 1.3290, TP 1.3180

Gold fluctuates widely; short-term trading analysis.In the morning of the Asian market, spot gold fluctuated slightly and is currently trading around $3,270/ounce, an increase of about 0.9%.
As Mr. Trump's latest statement hit the market's risk appetite, the price of gold rose rapidly in the short term. The current London gold price has reached $3,270/ounce, climbing nearly $30.
In addition, the market focus has turned to the Federal Reserve's May FOMC meeting on May 7. Although the market has priced in a standstill, Powell's latest remarks and press questions after his radical statement in April will attract high attention.
Asian market morning analysis:
Gold prices rebounded again in the morning of the Asian market. Quaid believes that if gold does not break through strongly, it will still fluctuate within the range, and the current bullish situation has not reversed. If gold continues to maintain its strength, it can resume the bullish trend. But it has not broken through for the time being, so the possibility of shorting is still very large.
Gold's 1-hour moving average continues to be in a downward short position, and there is still room for gold shorting; gold was under pressure at 3270 in the early stage and fell back, and the early rebound was under pressure at 3270 and continued to fall. Gold is still fluctuating within the range in 1 hour, and Quide believes that the short-selling trading strategy is still the main one.
Operation strategy:
Short-term operation: short at 3265, stop loss at 3280, and profit at 3250-3240.
I hope Quide's analysis can help all traders make profits in the gold market in time and harvest the first gold of the day.

Week ahead analysis May 4th to 11th**Week Ahead Analysis (May 5 – May 11, 2025)**
### **Baseline: Market Expectations**
- **Tariffs & Fed Policy:** Trump's tariff announcement has heightened concerns about economic slowing, prompting bond markets to price in up to four Federal Reserve rate cuts this year.
- **Trade Talks & Sentiment Shift:** Reports suggest China may restart trade negotiations, boosting risk sentiment. However, China insists the U.S. must first remove all unilateral tariffs, adding uncertainty to the discussions.
- **Market Reaction:** Risk assets—equities and high-beta currencies like AUD, NZD, and CAD—are climbing as volatility cools. Meanwhile, safe havens such as JPY, CHF, and gold are facing selling pressure, though overall risk sentiment remains cautious.
### **Potential Surprise Scenarios**
- **Trade Deal Secured:** A deal would likely send equities higher, strengthen risk-sensitive currencies, and drive safe havens lower.
- **No Deal Reached:** In contrast, safe havens could gain while risk assets retreat.
### **Big Picture Outlook**
Regardless of the immediate outcome, the market's medium-term trajectory hinges on the broader effects of trade policy. If tariffs persist, economic uncertainty may sustain the Fed’s dovish stance. A successful trade deal, however, could restore confidence, shifting expectations back toward growth stabili

Daily Analysis- XAUUSD (Monday, 5th May 2024)Bias: No Bias
USD News(Red Folder):
-ISM Services PMI
Analysis:
-Strong bullish momentum on market open
-Looking for retest 0.5 fib level
-Potential BUY/SELL if there's confirmation on lower timeframe
-Pivot point: 3200,3300
Disclaimer:
This analysis is from a personal point of view, always conduct on your own research before making any trading decisions as the analysis do not guarantee complete accuracy.

HKMA's Bold Move: HK$46.5 Billion Purchase Fuels HKD SurgeA spokesman for the HKMA announced that the Hong Kong dollar activated the linked exchange rate mechanism at HK$7.75 to US$1 during New York trading on Friday, 2 May 2025. The HKMA purchased US dollars and sold HK dollars, amounting to HK$46.539 billion. By Wednesday, 7 May 2025, the total balance of the banking system will rise to HK$91.309 billion.
The spokesperson noted that the recent strength of the Hong Kong dollar stems from increased demand related to stock investments, which bolsters the exchange rate. Additionally, the appreciation of several regional currencies against the US dollar has contributed to the Hong Kong dollar's strength. The last activation of the strong side redemption guarantee occurred on 28 October 2020.
Reuters reported that European equity funds attracted their largest weekly inflow in over a year, totalling $14.64 billion for the week ending 30 April. In contrast, U.S. funds experienced outflows for the third consecutive week due to ongoing uncertainty regarding tariffs and their impact on global economic growth. Investments in Asian funds reached $6.68 billion.(source Reuters).
Although comparing the report time, they are reporting different fund flow; the inflow of money into Hong Kong is currently modest, at HK$46.539 billion (approximately $5.99 billion), it is comparable to the figures reported by Reuters for Asian funds.
In the Hong Kong property market, Sun Hung Kai Properties’ Sierra Sea project has sold all 318 flats in its first sales round last week and the second batch of 288 flats. In total, 606 flats were purchased over two weekends. Property agents report that 20 to 40 per cent of prospective buyers are from mainland China. Prices for these units range from HK$3.27 million to HK$8.99 million (US$422,000 to US$1.16 million), with a price per square foot between HK$9,992 and HK$13,533.(source: SCMP)
These cases indicate that money is flowing into Hong Kong, with the HKD strengthening to the strong side of 7.75. This influx will increase bank balances, suggesting that the Hang Seng Index (HSI) is unlikely to weaken in the coming weeks, despite the negative impact of US tariffs on business sentiment.
Technically, the HSI has potential for further gains, with targets set between 26,700 and 27,600. It remains within an upward channel, and cycle analysis indicates that this upward trend could continue until June.
Why is money flowing into Hong Kong? Is it due to the attractive price-to-earnings ratio, Chinese investors relocating funds from the US, or rumours about the government? These factors need to be validated in the future.

NZDCAD continue upward trendWith the news announced on 30/04/2025, GDP of CAD currency showed that it had a negative result compare to forecast. Market react according to the result.
We have to wait of pullback from the chart only enter into the market to maximise the return from the market.

USDCAD Potential Long PlayRetailers are short + bullish structure + Strong Demand zone. Potential Play? only problem, the zone does seem kinda at equillibrium

NQ: Upcoming Weekly Analysis!FA Analysis:
1- Macro economic Indicators: Most data came red and few were inline confirming the slowing down of the economy.
2- Inflation data came better than expected.
3- Trump Tariffs: Strong rumors about deals underway from this week. The 90-day pause will become an indeterminate pause.
4- We have the FED this week. Nothing in terms of immediate rate cut, but the conference is very important for the looking forward.
5-ISM Services data is important.
From FA perspective, market is focusing on Tariffs deals. If it materializes, the ST outlook will change from Sell to Buy. MT and LT Outlook will stay Sell.
TA Analysis:
Weekly TF:
The weekly close was bullish and price retraced more than 61.8. This could be the end of this wave.
The FED and/or the tariff deals will give the signal for either the start of wave 3 or a continuation up. Until then, a consolidation is expected.
Daily TF:
Same as weekly... a bullish daily close. A consolidation is expected until the FED.
Happy and green week to Everyone!
