Fundamental Analysis

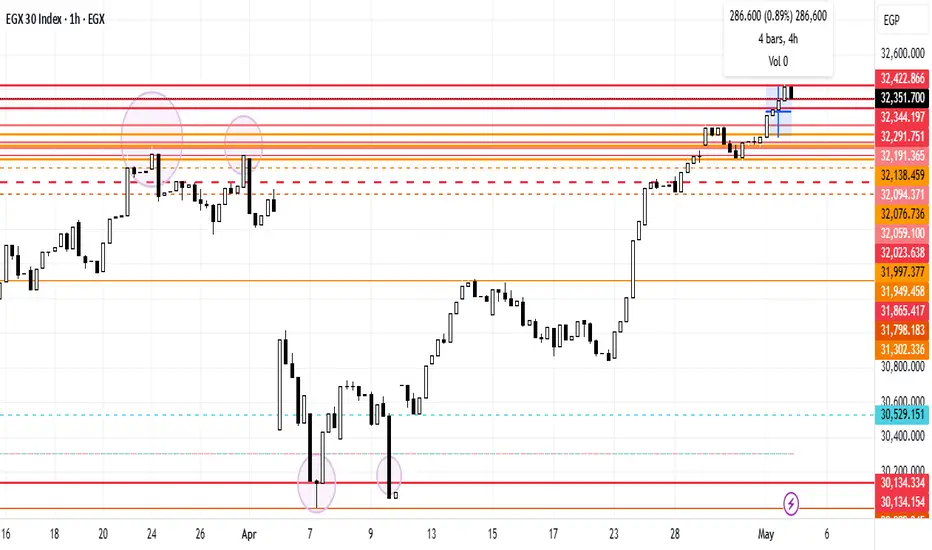
EGX30 Chart AnalysisEGX30 stock has shifted gradually to a higher zone, reaching the 32,291.751 resistance line, the 32,344.197 resistance line, and the 32,422.866 resistance line, showing the buyers' dominance over the sellers. Additionally, the upward trend is because Egypt's blue-chip index EGX30 closed 0.7% higher, which led to a 1.6% increase in TMGH, which strengthened the fundamental analysis about the CBE's decision about cutting the interest rate and the advanced massive ads and negotiations initiated by TMGH with different aspects.
GBP/JPY Break or Bounce?🔍 Market Overview (H1 Timeframe)
The GBP/JPY pair is trading within a tight consolidation range, following a recent bullish breakout on higher timeframes. However, on the H1 chart, momentum is beginning to show signs of exhaustion, with price action forming short-term resistance around the ¥193.50–¥193.80 zone.
📊 Technical Analysis (H1 Chart)
🔹 Trend Direction:
Short-Term: Sideways to Slightly Bullish
🔹 Key Levels
Resistance:
¥193.50 – Strong horizontal level
¥193.80 – Intraday swing high
🎯 Trading Plan (H1 Timeframe)
🔸 Scenario 1: Breakout Trade (Bullish Continuation)
Entry: Buy on breakout and close above ¥193.80
Stop Loss: Below ¥193.30
Take Profit:
TP1: ¥194.50
TP2: ¥195.20
🔸 Scenario 2: Range Rejection / Short-Term Pullback
Entry: Sell on rejection at ¥193.50–¥193.80 zone
Stop Loss: Above ¥194.00
Take Profit:
TP1: ¥192.80
TP2: ¥192.20
📅 Weekly Outlook Summary
GBP/JPY on the H1 timeframe is poised for a key directional breakout. Bulls must clear ¥193.80 to reassert control, while bears may look for signs of exhaustion to play the short-term reversal. Traders should remain flexible and focus on price action near key levels, supported by momentum confirmation.

Utilities against the S&PNot a great chart for Utilities against the S&P. Below 200 week, might go down to historic support or even breach it. Frankly I view Utilities as bullish with the expected data center needs + electricity demand growth however a stagflationary environment can be negative for utilities and a higher rate environment as well.
A higher term premium with stable economic growth may be the worst environment for utilities on a relative basis. When it is put like that, utilities may continue underperforming.
Will revisit if trend picks up and the sector can break above the moving average and resistance.

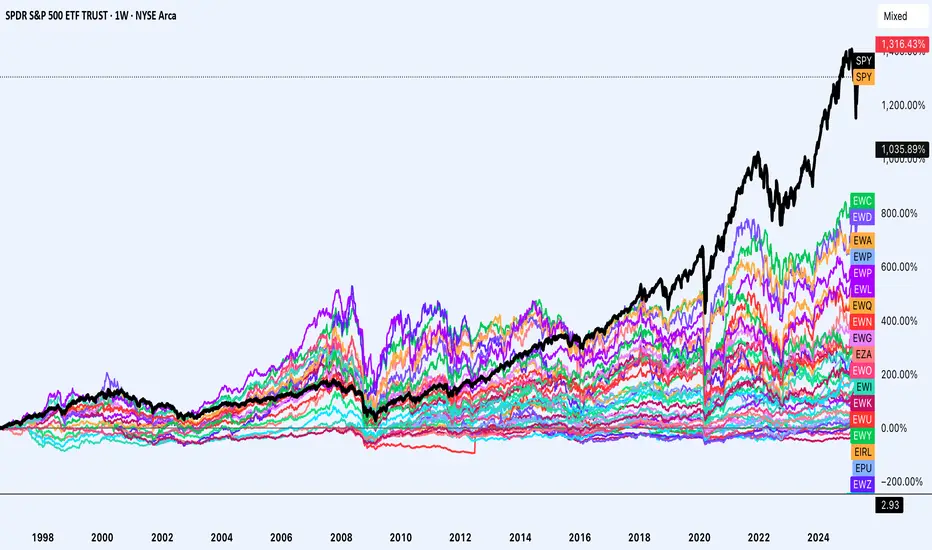
US Outperformance, when will it end?The US market has consistently outperformed global markets since the global financial crisis, it has also outperformed since the tech bubble. A portion of this can be attributed to a strong dollar (many markets outperformed in local currency). However this strong dollar performance may be coming to an end.
In addition there are structural reasons why the US has and may continue to outperform:
1. A larger weighting to higher growth sectors such as technology, communication services and a lower weight to lower growth sectors such as energy and materials.
2. Better rule of law, better focus on shareholder returns, less crowding from the government and state owned enterprises lowering the return of markets. (EM SOEs as an example)
3. US attracting global talent and fostering innovation. "The smartest person in any subject will likely go to the US'
So how can the US consistently underperform given these things?
1. Well for one the dollar may start to be a worse performing currency, it seems the current administration wants that. This not only lowers the performance of the US compared to global markets it also lowers the foreign inflows to US assets and also benefits EMs with dollar denominated debts.
2. The idea that the US attracts the best talent and fosters innovation may be declining with the current cultural attacks on immigration and the federal government spending cuts impacting research projects.
3. Global markets currently have a lower weighting to high growth sectors however this may not continue and instead we may start to see the marginal weight of sectors going to higher growth sectors instead of lower growth sectors.
4. The darling companies in most countries may list in their local markets instead of in the US. (Seeing the UK ease regulations of share classes, Chinese companies not welcomed in the US, European companies redomiciling back to Europe)
5. Valuations, Valuations, Valuations. Gun to your head: Next ten years would the multiple become a headwind or tailwind for the US market? What about for global markets? US trades at roughly 21x forward earnings whereas the UK trades at 12x, Eurozone at 14x, Japan at 13.5x, EM at 12x and China at 11x.
If after 10 years the US trades at an 18x multiple and the UK as an example trades at a 15x valuation that would be an annualized headwind of 1.5% for the US and an annualized tailwind of 2.3% for the UK. Add to that the effect of low starting valuations on yield (US net shareholder yield is close to 2% whereas the UK yields 4%).
Just rough numbers on performance for US vs UK next 10 years.
US: -1.5% multiple change, 2% yield, 10% earnings growth = 10.5%
UK: 2.3% multiple change, 4% yield, 6% earnings growth, 1% currency = 13.3%
Everyone is over allocated to the US and is under allocated outside the US. Currently the US represents around 20% of global GDP however it represents 70% of global market cap. 70 cents of every dollar in the equity market is in and goes to the US. Will this likely increase or decrease as a share? The next question becomes who will take that share if it falls?
Investing outside the US does not mean:
Investing in markets with bad shareholder friendliness
Investing in markets with a history of fraud
Investing in markets with notorious related party transactions
Investing in markets with high starting valuations.
Some markets such as China can have the first 3 issues applied to it, some markets such as India may frankly have all of these issues. Some markets in Europe may have the first and last aspect. And some markets likely have none of these issues. I propose Japan, UK and Northern Europe.
History is only a guide however the history of returns involved one of the single best economic performances of any country coming from the US which resulted in an amazing stock market with great returns, this is not guaranteed.
Historically stocks return nominally 10% and on a real basis 7% which can be decomposed to 3% yield and 7% earnings growth with virtually no multiple change (on long enough time horizons) when you start at a high valuation the yield component is lower and you need higher earnings growth to compensate. And on a much longer time horizon earnings growth is what really matters.
Earnings growth does not exist out of no where, it usually tracks nominal gdp growth + a margin increase from operations and or sector compositions.
Nothing is guaranteed, your next maximum drawdown is in the future, expect the unexpected and keep invested as the global debt bubble will likely be inflated away.
WTI TRADE IDEAhello everyone
From the previous oil movement, the entry at 58.52 moved up by 80 pips before hitting breakeven. For the upcoming open market, if the trendline and support or resistance break out as shown on the M30 chart, it could signal an opportunity to enter the market.
Ensure strong confirmation before acting, and keep an eye on shifts in market structure.
Thanks a lot for your support & best of luck
**My trading strategy is not intended to be a signal. It's a process of learning about market structure and sharpening my trading my skills also for my trade journal**

USD/CHF SHORT OUTLOOK. 5/4/25📉 USD/CHF – SHORT SETUP
• Current Price: ~0.8263
• Trend: Bearish, with potential for further downside
• Technical Outlook: USD/CHF remains in a long-term downtrend, with potential to retest the 0.8038 level. A break below this could target the 0.7382 level. 
Trade Plan:
• Entry Zone: 0.8295–0.8318
• Confirmation: Bearish engulfing pattern on M15/H1, RSI ≤ 40, SAR above price, and volume spike
• Stop Loss: 30 pips above entry
• Take Profit:
• TP1: 0.8215
• TP2: 0.8180
•
• Confidence: High ✅

AI BTC Prediction Next 24–48 Hours !May 3, 2025, 11:13 pm. BTC/USD. BTC/USD Trading Plan
Timeframe: Next 24–48 Hours
Long Scenario
- Entry: 96,550 (confirmed close above 96,500 with rising volume + RSI > 50).
- SL: 95,700 (below immediate support 95,800).
- TP: 96,800 (below resistance 97,000).
- Trailing Stop: 1.5x ATR (~162 pips) after surpassing 96,800.
- Confirmation: MACD histogram reversal + Bollinger Band breakout above midline.
Short Scenario
- Entry: 95,750 (confirmed close below 95,800 with rising volume + RSI < 40).
- SL: 96,600 (above resistance 96,500).
- TP: 95,200 (above support 95,000).
- Trailing Stop: 1x ATR (~108 pips) after breaking 95,500.
- Confirmation: Supertrend remains bearish + EMA crossover downward.

EURUSD High‑Probability Trade Setup1️⃣ EUR/USD 🇪🇺/🇺🇸
Price: 1.1303
Yahoo Finance
HTF Trend: Bearish (Weekly↓, Daily↓) ✅ Trend‑Aligned
Fundamental Context: ECB Governing Council informal retreat in Porto on May 6–7 could spark volatility if hawkish tweaks are signaled
Reuters
. US NFP printed 177K on May 2, beating forecasts and bolstering USD into the weekend
Investing.com
.
Key Zones (H4):
Supply/Resistance: 1.1340 (weekly supply + order block)
Demand/Support: 1.1260 (daily demand zone)
Entry Trigger:
Break & retest of 1.1340 on H4
Confirmation: M15 bearish engulfing + volume ↑ ≥ 25%
FXStreet
Stop Loss: 1.1360 (≈ 1.3×ATR 20 pips)
Take Profits:
TP1: 1.1260 (2 R ≈ 40 pips)
TP2: 1.1220 (3 R ≈ 60 pips)
Timing & News Filter:
Avoid new entries around ECB retreat sessions May 6 08:00–18:00 UTC
Reuters
Ideal entry: London Open 3:00–7:00 EST
Confluence Score: 5/5 → Confidence: 9/10

XAU/USD Breakdown: Bears in Command
Current Bias: Bearish
Market Structure: Lower highs and lower lows forming post recent peak near $3268.05.
Price Action: Gold recently broke below a key support zone around $3268.05,
Trade Setups
📉 Bearish Setup (Primary Bias)
Entry: On rejection at $3256.24 or a break/retest of $3268.05
Stop Loss: $3272.67
Take Profit:
TP1: $3193.97
TP2: $3102.09
TP3: $3047.62
capital: $50
risk: $46(-96%)
reward: $380(+250%)

Fibonacci retracement tool, moving averages, support and resis..My favorite timeframes: Weekly, Daily, 4hr, 1hr and some minutes.
You are currently seeing my analysis on a 1hr chart.
As told, focus should only be only the following:
-Fibonacci Retracement tool (38.2 and 61.8 ratios).
-Moving Averages (simple moving average and exponential moving average)
-Support and Resistance levels (connect @least 2 or more points).
-Supply and Demand Zones.
-Candlestick Patterns.
-Trendline Strategy (connect @ least 2 or more points).
*also watch out for chart patterns.

Cracking Support: Bearish Momentum Accelerates to the DownsideBased on the H4 (4-hour) timeframe analysis for XAU/USD (Gold), here’s a concise prediction:
Trend Direction: Bearish
Recent Price Action: A clean break below a consolidation zone or horizontal support (e.g., $3267.937) confirms downside pressure.
Forecast: As long as gold remains below the 3267-937 resistance area, the bearish pressure is likely to continue, targeting $2,270 and potentially $2,245 in the short term.

XAGUSD Double Top Pattern – Bearish Reversal Targeting $22 Zone"
🔎 Key Zones and Annotations Explained
🟥 Resistance Level (Supply Zone):
Marked in red, this level represents a historical supply area where sellers consistently outweigh buyers.
Multiple rejections from this zone confirm its strength.
🔄 RS Interchange (Support-Turned-Resistance):
This area around 26.00 – 27.50 has previously acted as support and could now act as resistance if price attempts to retrace upward after breaking down.
📉 Bearish Projection Path:
A potential price trajectory is illustrated with a zigzagging downward pattern, reflecting corrective moves and retests.
If the neckline is breached convincingly, this projection suggests continued bearish follow-through toward the 22.00 region.
🎯 Trade Setup and Risk Plan
Entry Trigger:
Short position considered after confirmation of neckline break (~29.50), ideally on a weekly candle close below this level or a successful bearish retest of broken support.
Stop Loss Placement:
Above the resistance highs at 35.57, which would invalidate the double top and signal possible trend continuation.
Profit Target:
Based on the measured move of the double top (height from resistance to neckline), we target the 22.42 – 22.46 region.
This aligns with previous support and a psychological round level, making it a strong candidate for price reaction.
⚠️ Risk Management Considerations
Always use defined position sizing and risk-reward ratios. A minimum of 1:2 RR is recommended.
Confirm breakdowns with volume spikes, momentum divergence, or break of trendlines for added confluence.
Keep an eye on macroeconomic data (like inflation rates, Fed interest rate decisions, and USD index strength) which can heavily impact the value of precious metals like Silver.
📘 Educational Insight: Why Double Tops Work
The double top is a psychological failure pattern. The first top attracts buyers expecting a breakout, but when price returns to that level and fails again, it often triggers mass liquidation and new short entries, especially when the neckline support fails. This builds downward momentum, making it a favorite pattern among swing and position traders.
🏁 Conclusion
This weekly chart of XAGUSD paints a clear picture: Silver may have topped out in the short-to-mid term. If the double top confirms and neckline breaks, expect a sizable correction back into the lower $20s. The risk is clearly defined, and the reward potential is high. Patience and confirmation are key.
💬 What Do You Think?
Do you agree with this bearish outlook on Silver? Are you waiting for confirmation before entering? Drop your thoughts or analysis below!
📌 T ags/Hashtags
#XAGUSD #Silver #DoubleTop #TechnicalAnalysis #ChartPatterns #SwingTrading #Commodities #PriceAction #Forex #BearishSetup #Metals #TradingView #GoldAndSilver #ShortTradeSetup

EURJPY - 05.05.2025 - 09.05.2025EURJPY - 05.05.2025 - 09.05.2025
I am looking for short in EURJPY this week.

Could this be DXY's fate amidst the dovish tentions? #FEDS📈 Most Likely Probability: Neutral-to-Slightly Bullish Bias
🔍 Supporting Fundamentals:
Stronger-than-expected NFP: Suggests economic resilience → supports dollar strength.
Fed holding rates steady (but no dovish pivot): Keeps real yields relatively attractive → supports demand for USD.
Tariff/trade calm: Reduces tail risk, but also reduces safe-haven flow → slightly neutral.
📉 Limiting Fundamentals:
Calmer global risk sentiment and improved outlook in emerging markets may reduce dollar inflows.
No fresh hawkish push from the Fed = limited fuel for strong breakout.
📊 Technical Outlook (DXY near 100.00):
Key Support: ~99.70–100.00 (9-day EMA + psychological support)
Key Resistance: ~100.50–101.00 zone
Momentum: Slight recovery attempts with weakening bearish momentum
If the DXY holds above 99.70 and breaks above 100.50, a move toward 101.00 is likely next week. Failing to hold 99.70 could open a pullback toward 99.00.

Tao BiasBearish Sentiment
across the 2-hour, 1-hour, and 30-minute timeframes indicates a bearish trend. A significant observation is the price action within a confluence zone, identified as an Optimal Trade Entry (OTE) on the 30-minute chart, which also aligns with an area of imbalance (Fair Value Gap) on the 1-hour timeframe.
favoring short positions may be considered. Potential entry points could be sought on minor retracements, with prudent stop-loss placement above the identified OTE zone or recent swing highs. The primary objective would be to target the identified sell-side liquidity.

[LONG] ETHUSDT | ETG Going Up Follow BTC?Welcome,
- Status: 📈 Long
- TP & SL On Chart
Keep wait..
Lets see..


BTC Outlook May 2025CRYPTO:BTCUSD
Bitcoin Nears Major Resistance – What Comes Next?
As of this writing, Bitcoin is trading around $96,000, climbing steadily as it approaches what I believe is a critical resistance zone between $98,000 and $102,000. This area has the potential to act as a major turning point.
If Bitcoin can break through and hold above the $102,000 level, I believe there's a strong chance we see continued momentum pushing the price toward $120,000 or even higher. However, if Bitcoin is rejected at this resistance zone, it could mark the beginning of a retracement, with the next major support area appearing around the $71,000 level.
This zone of resistance is, in my view, one of the most important to watch in the current cycle. Whether Bitcoin can establish new support above it—or get turned away—could shape the trajectory for the rest of the year.
Previous Bitcoin Outlook
Disclaimer: The views expressed in this article are my personal opinions and should not be considered financial or investment advice. Trading cryptocurrencies involves significant risk, and you should always do your own research and consult with a financial advisor before making investment decisions.

GBPUSD Analysis Today: Technical and Order Flow !In this video I will be sharing my GBPUSD analysis today, by providing my complete technical and order flow analysis, so you can watch it to possibly improve your forex trading skillset. The video is structured in 3 parts, first I will be performing my complete technical analysis, then I will be moving to the COT data analysis, so how the big payers in market are moving their orders, and to do this I will be using my customized proprietary software and then I will be putting together these two different types of analysis.

WHY WILL IT GO HIGH?Reasons indicating strong potential:
- Large and active community on social media
- High scammer activity
- Trap for inexperienced users: selling on DEX at 3x lower price than on CEX due to low DEX liquidity
Let me know if you'd like it even more formal or formatted for a report.

BUY EURUSDFollowing the market structure of EU, it keeps pushing above.
.
Now, as it is seen, the price is pulling back to untested zone in a daily TF.
..
We can risk by pushing down the price? , because the trend is bullish, so it is better we wait to complete correction and if it will enter the fresh zone, we will drop to lower time frame to find the confirmation for buy.
.
Trend is your friend

Eth looking promising for a bull runHi guys, I do these charts often as I'm interested and it's a nice challenge to read.
If you like my content please give it a boost it helps so much.
Eth is looking very bullish, its an important change of direction with a double upward take as you can see, its jumped 10% in the past month. That's significant.
If you are wondering if it's too late, it's not, its still 50% than beginning of year. Ethereum is becoming more and more popular with gaming, and viable transanctions. Much more than bitcoin. You have to be in the industry to understand it. It's the best P2P ever built. It's not gonig anywhere, it's here to stay. In my opinion its a solid investment.
