GOLD continues to correct down, good news from trade situationOANDA:XAUUSD has fallen sharply again, currently trading around $3,360/oz, reflecting the easing of global trade tensions, affecting demand for safe-haven assets. The US Dollar and US Treasury yields have also increased, affecting gold prices.
The US Dollar Index ( TVC:DXY ), which tracks the greenback against six other currencies, rose to 97.56.
The yield on the 10-year US Treasury note US10Y rose to 4.386%. The US real yield, calculated by subtracting inflation expectations from nominal interest rates, rose nearly 3.5 basis points to 2.046%.
Markets are increasingly optimistic about such deals after the United States and Japan reached a trade deal, and the European Union could be next. In addition, rising stock markets and low volatility have kept gold's gains in check.
The United States and the European Union are moving toward a potential trade deal that would include a 15% tariff on EU goods and zero tariffs on some items.
The European Commission said Thursday that a negotiated trade solution with the United States is within reach.
“Our focus is on reaching a negotiated outcome with the United States,” a European Commission spokesperson told reporters about the EU-U.S. tariff talks. “We believe that such an outcome is achievable.” The European Commission has repeatedly said that its current priority is to reach a deal with the United States to avoid the 30% tariffs that U.S. President Trump has proposed to impose on EU products starting August 1.
On the economic data front, initial jobless claims in the United States unexpectedly fell last week, suggesting the job market remains solid.
The U.S. Bureau of Labor Statistics reported on Thursday that initial jobless claims fell to 217,000 in the week ended July 19, below expectations of 227,000 and down from 221,000 the previous week.
Technical Outlook Analysis OANDA:XAUUSD
Gold is heading for its third consecutive day of decline since hitting the bullish target level sent to readers in the weekly edition on Sunday at $3,430.
Despite the sharp decline, gold still has enough technical conditions for an uptrend given its current position and structure.
Specifically, gold is still above the EMA21, which is considered the nearest support at the moment. Along with that, the uptrend price channel is the short-term trend. However, for gold to qualify for a short-term bullish cycle, it needs to be confirmed by price action above the 0.236% Fibonacci retracement level, then the target is $3,400 in the short term, more than $3,430.
On the other hand, RSI is still holding above 50, and 50 in this case acts as momentum support. Therefore, gold still has room to rise.
In case gold is sold below EMA21, it may suffer a further decline with the next target around $3,310 in the short term, more than $3,300 and the 0.382% Fibonacci retracement level. And if gold loses the support at the 0.382% Fibonacci level, it will qualify for a bearish cycle.
Intraday, the current position of gold price is still tilted towards the upside, and the notable price points will be listed as follows.
Support: $3,350 – $3,310 – $3,300
Resistance: $3,371 – $3,400 – $3,430
SELL XAUUSD PRICE 3406 - 3404⚡️
↠↠ Stop Loss 3410
→Take Profit 1 3398
↨
→Take Profit 2 3392
BUY XAUUSD PRICE 3329 - 3331⚡️
↠↠ Stop Loss 3326
→Take Profit 1 3337
↨
→Take Profit 2 3343
Futures

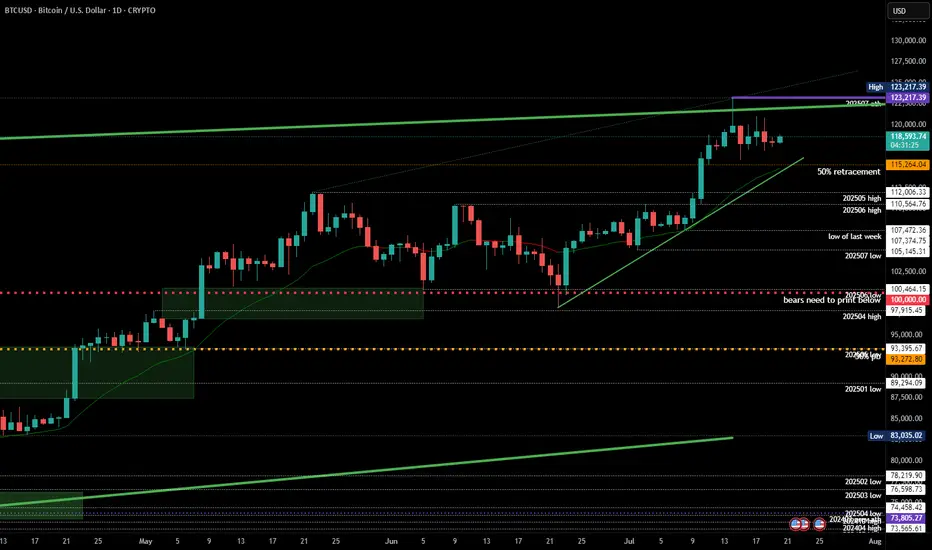
BTCUSD 4HOUR TIME FRAME ANALYSISCurrently bearish on the 4-hour chart with lower highs and lower lows forming consistently.
Price Action: BTCUSD recently broke below a key support zone around 116,000, turning it into a fresh resistance. The market shows bearish momentum as price fails to reclaim above that zone.
Candlestick Patterns: Multiple bearish engulfing candles confirm selling pressure near the 115,500–116,000 area.

From 3,430 USD GOLD falls below 3,400 USD on optimistic newsOANDA:XAUUSD has suffered a sharp sell-off after rising sharply earlier in the week. Media reports said the United States and the European Union were getting closer to reaching a tariff deal, and the news weighed on safe-haven demand.
OANDA:XAUUSD fell below $3,400 an ounce on Wednesday, down more than 1.2%, following news that the United States and the European Union were close to signing a deal similar to the one Washington and Tokyo signed on Tuesday. It is now trading below that key base point.
The European Union and the United States are moving toward a trade deal that could see more EU goods hit with a 15 percent U.S. import tariff, two diplomats said. Earlier, U.S. President Donald Trump reached a trade deal with Japan that would cut auto tariffs to 15 percent.
Optimism about an imminent U.S.-EU trade deal overshadowed a decline in the U.S. dollar. The U.S. dollar index (DXY), which measures the greenback against a basket of six currencies, fell 0.05 percent on the day to 97.160.
U.S. Treasury yields rose, with the 10-year Treasury yield rising to 4.396%. U.S. real yields, calculated by subtracting inflation expectations from nominal yields, rose nearly 4 basis points to 1.994%.
Gold tends to gain in value during times of uncertainty and low-interest-rate environments because gold itself does not generate interest, and in low-interest-rate environments, the opportunity cost of holding gold is relatively low.
U.S., EU near trade deal
The Financial Times reported on Wednesday that the European Union and the United States are close to reaching a trade deal that would impose a 15% tariff on imports from Europe, similar to the one reached between US President Donald Trump and Japan this week.
The Financial Times reported that Brussels is likely to agree to so-called “reciprocal tariffs” to avoid tariffs that Trump has threatened to impose on EU goods of up to 30% from August 1.
“The agreement reached with Japan is clearly extortionate in terms. Most member states are swallowing their anger and are likely to accept the deal,” an EU diplomat said.
The two sides will exempt some products, including aircraft, spirits and medical equipment, from tariffs.
The agreement between the US and Japan has also left Brussels reluctant to accept higher reciprocal tariffs to avoid a damaging trade war, according to the Financial Times.
Technical Outlook Analysis OANDA:XAUUSD
On the daily chart, after gold reached its target at $3,430, it failed to break above this important resistance level and fell slightly. The decline brought gold back to test the support confluence area, which is the location of the 0.236% Fibonacci retracement with the lower edge of the price channel. And with the current position, gold still technically has enough conditions for a possible increase in price.
Specifically, gold is still in/above the supports from the short-term price channel, the long-term rising price channel and the support from the EMA21, as long as gold is still trading above the EMA21, it still has a bullish outlook in the short term. On the other hand, the short-term target is still at 3,430 USD, while once the 3,430 USD level is broken, it will provide the possibility of further upside with the next target at around 3,450 USD in the short term, more than the all-time high.
RSI remains above 50, far from the 80 – 100 area (overbought area). Showing that there is still a lot of room for upside ahead.
During the day, the technical outlook for gold prices continues to favor upside and notable positions will be listed as follows.
Support: 3,371 – 3,350 USD
Resistance: 3,400 – 3,430 – 3,450 USD
SELL XAUUSD PRICE 3421 - 3419⚡️
↠↠ Stop Loss 3425
→Take Profit 1 3413
↨
→Take Profit 2 3407
BUY XAUUSD PRICE 3354 - 3356⚡️
↠↠ Stop Loss 3350
→Take Profit 1 3362
↨
→Take Profit 2 3368
Cocoa futures near a key technical resistance areaMARKETSCOM:COCOA futures have been trending lower, while trading within a falling channel pattern since around mid-May of this year. But we are near the upper bound of that channel. Let's see if it holds.
Let us know what you think in the comments below.
Thank you.
75.2% of retail investor accounts lose money when trading CFDs with this provider. You should consider whether you understand how CFDs work and whether you can afford to take the high risk of losing your money. Past performance is not necessarily indicative of future results. The value of investments may fall as well as rise and the investor may not get back the amount initially invested. This content is not intended for nor applicable to residents of the UK. Cryptocurrency CFDs and spread bets are restricted in the UK for all retail clients.

2025-07-23 - priceactiontds - daily update - nasdaqGood Evening and I hope you are well.
comment: Very tight channel up from 23142 but only 1 bear bar since then and in the absence of bear bars, we can only assume sideways to up movement.
current market cycle: bull trend
key levels: 23000 - 24000
bull case: Bulls want to print more higher highs. We are in this bull channel for the whole July now without breaking it and bulls now confirmed the breakout above 23100ish - 3 times. That is the 50% retracement of the last big leg up and very important. A measured move for this leg gives us 24000. Bears have tried with two decent legs to get down to 23000 and failed. I think many will give up on this after hours buying and we can have more meltup into the weekend. Anything bearish would be a big surprise.
Invalidation is below 23250ish.
bear case: Bears tried and failed again. Everything is bought. 1h close below 23250 would certainly stop the max bullishness but bears are really not doing much. We are almost printing daily new ath. Focus on longing pullbacks until the bull channel is broken.
Invalidation is above 24000.
short term: Bullish on any pullback until it stops working.
medium-long term - Update from 2024-06-29: No change in plans. I expect 20000 to get hit over the next 3 months and maybe 19000 again.
trade of the day: Long 23200 has been profitable since Friday.
Euro Futures (6E) – Bearish Drift Below ResistanceEuro Futures (6E) appears to be grinding lower showing clear signs of fading bullish momentum.
After a bounce off 1.16160 support on July 17, Euro Futures (6E) made a failed push into 1.17995 resistance on Tuesday, July 22, a level that’s acted as a firm ceiling since June 26.
Since then, price action has been in a descending broadening channel, often a precursor to further downside with expanding volatility as sellers control the tempo.
As of 5:20 AM GMT, the structure points to continued weakness. I expect 6E to settle around 1.17170 – 1.16990 by close of Wednesday, July 23, 2025.
📉 Bias: Bearish
🔍 Pattern: Broadening Descending Channel
🕒 Date: July 23, 2025

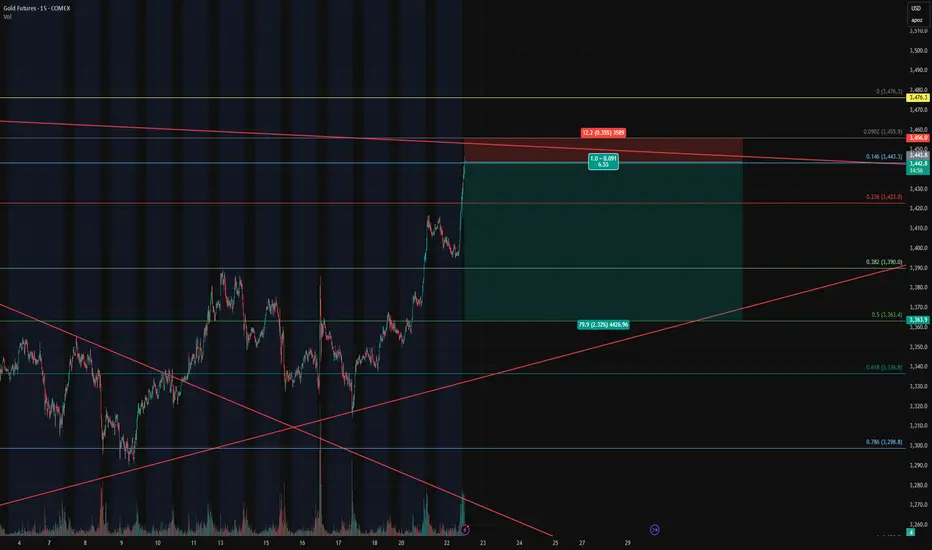
Gold Futures – Closing Longs and Flipping Short at Key Fib🔴 Gold Futures – Closing Longs and Flipping Short at Key Fib Confluence
Instrument : Gold Futures – COMEX ( COMEX:GC1! )
Timeframe : 15-Minute
New Position : Short
Entry Zone : ~3442
Target : ~3362
Stop Loss : ~3458
Risk/Reward : Approx. 6.5+
Setup Type : Reversal from Overextension / Fib Resistance
💡 Trade Recap & Strategy Shift
We’ve officially closed both our recent long entry and our larger swing long position, locking in substantial profit on this move off the 0.618 retracement.
Now, we’re flipping short based on the following:
Price reached the 0.146 Fib extension from the previous retracement leg, a level often overlooked but powerful when confluence lines up.
Trendline resistance from the upper channel has been tagged.
Momentum is showing early signs of stalling after a strong vertical push — textbook overextension.
The rally into this level lacked divergence or structural buildup, increasing the chance of a snapback.
🛠️ Short Setup Details
Entry: 3442 (after signs of exhaustion near Fib confluence)
Target: 3362 (prior structure + 0.382 retracement)
Stop Loss: 3458 (just above high / resistance zone)
Risk/Reward: 6.5:1 — excellent profile for a countertrend play.
📌 Watch For
A break below 3390 will be key confirmation of momentum shifting back down.
Failure to hold 3442 on a retest will invalidate the short and re-open the door for a squeeze higher to 3476/3480.
With trend exhaustion in sight and high confluence resistance overhead, we’re taking the opportunity to pivot short — fully aware of the volatility this region can bring.
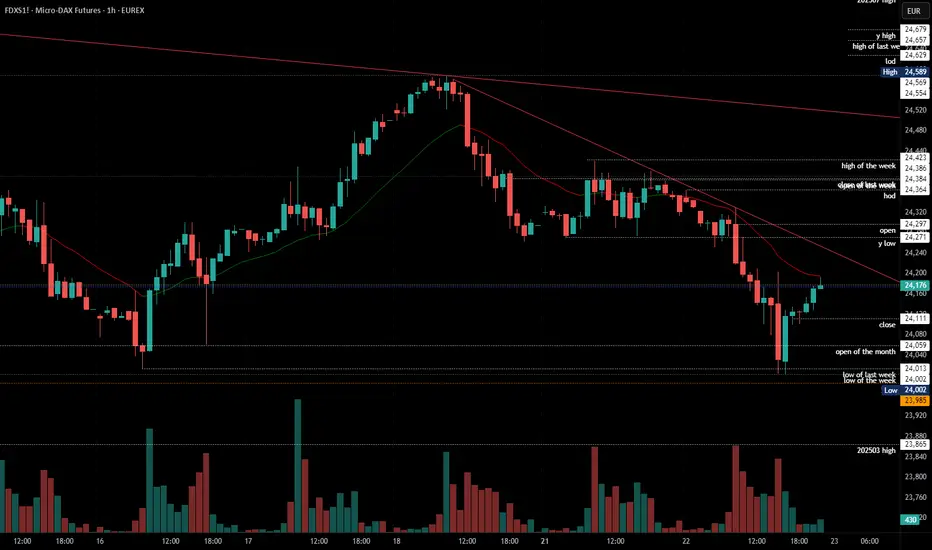
2025-07-22 - priceactiontds - daily update - daxGood Evening and I hope you are well.
comment: Bears had two legs down and the reversal from 24000 was strong enough to doubt this can go below 24000. I do expect some form of re-test of 24000 but the buying since then was insane again. Not a single 1h bar dropped below the prior one.
current market cycle: trading range
key levels: 24000 - 24600
bull case: Bulls next target is the breakout re-test of 24271 and if they can break above, the next target is today’s high at 24364. Above is likely no more resistance until 24450 or 24500. A print above 24271 would confirm the trading range and conclude the selling for now. This looks more like a two-legged move in a bigger trading range than stronger selling.
Invalidation is below 24350.
bear case: Bears need to keep it below the breakout price and re-test 24000. If they can leave an open gap, that would be great. Best would be to go sideways and stay below 24100 then but for now I have no trust in the bears.
Invalidation is above 24271.
short term: Neutral. No trust in bears but it would be great if we would stay below 23271 and test 24000 again. Daily close below 24000 would be a dream for bears. Above 24271 I would probably look for longs and higher prices again.
medium-long term from 2025-06-29: Bull surprise last week but my targets for the second half of 2025 remain the same. I still expect at least 21000 to get hit again this year. As of now, bulls are favored until we drop below 23000
trade of the day: Selling EU open, no bigger resistance and only red bars on the 1h chart.
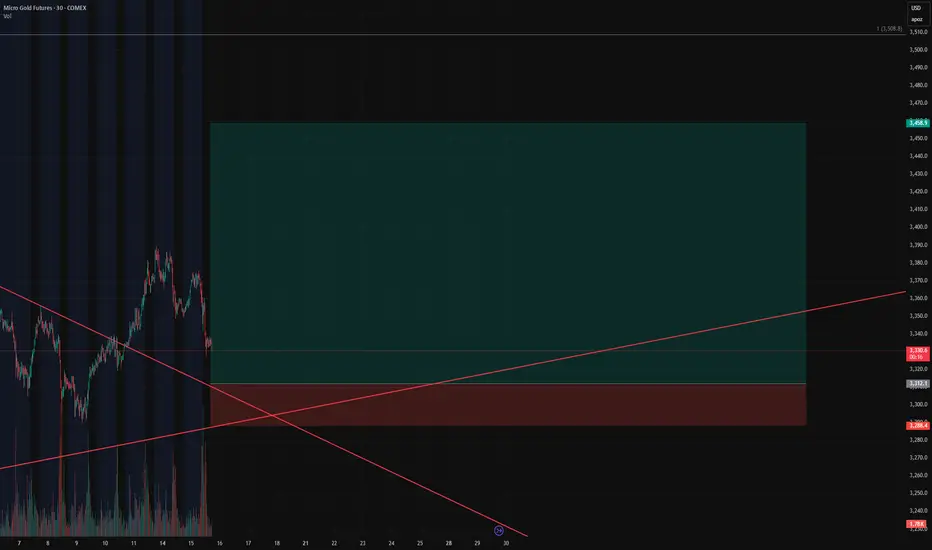
Gold Bulls Loading Up – Our Short Squeeze Trigger is Set!🚨 Gold Bulls Loading Up – Our Short Squeeze Trigger is Set!
We’re flipping the script on COMEX_MINI:MGC1! After a prolonged downtrend and textbook wedge compression, our breakout long is LIVE – but not without trapping the late shorts first.
💥 Entry: $3,312.1
🛑 Stop: $3,288.4
🎯 Target: $3,458.9
🧮 Risk/Reward: 6.19
Price just bounced at the retest of the wedge apex, and volume is confirming the move. If this holds, we’re riding momentum all the way up – and letting short pressure fuel the breakout.
📈 Trendline breached.
⏳ Time compression converging.
⚠️ If you’re still short, watch your stops!
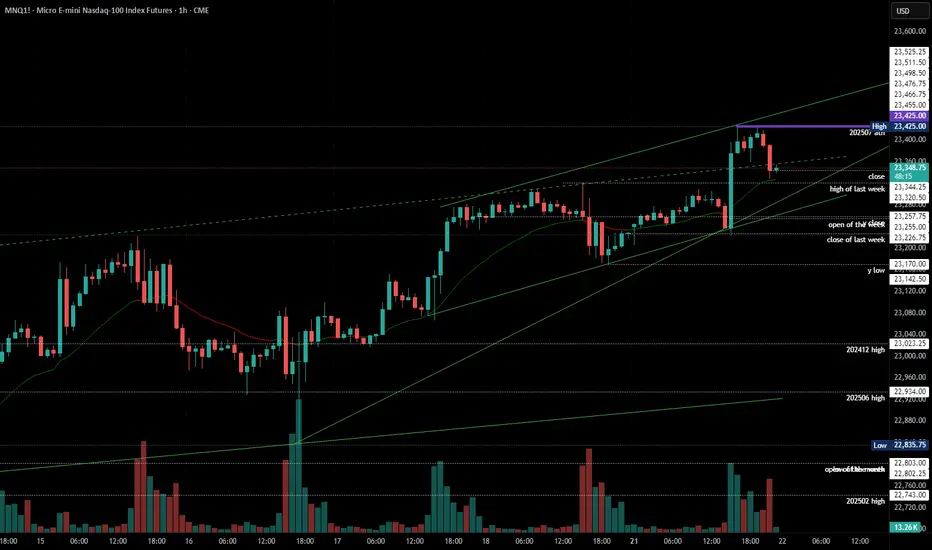
2025-07-21 - priceactiontds - daily update - nasdaqGood Evening and I hope you are well.
comment: Melt-up and bears failed to close below last weeks high, which means we are still max bullish. Until bears print below 23200, longs just make more sense than trying to look for shorts.
current market cycle: bull trend
key levels: 23000 - 23500
bull case: Bulls remain in full control until we get a daily close below 22700. First target for the bears is a lower low, which means getting below today’s spike 23225. That would be a start but likely means sideways rather than more selling. If we stay above 23200, we can continue to print many more new highs.
Invalidation is below 22700.
bear case: Bears obviously are not doing enough. They need to print 23200 and that would only be the first small start. It would open the possibility for a test of 23000 but since we are barely printing any red bars and have not broken any bull trend line so far, it’s stupid to look for shorts. Wait for much bigger selling pressure.
Invalidation is above 23500.
short term: Neutral but if anything I am looking for long scalps against support like the 1h 20ema.
medium-long term - Update from 2024-06-29: No change in plans. I expect 20000 to get hit over the next 3 months and maybe 19000 again.
trade of the day: Long US open. Just a quick melt-up but I missed it.
How to Trade Doji Candles on TradingViewLearn to identify and trade doji candlestick patterns using TradingView's charting tools in this comprehensive tutorial from Optimus Futures. Doji candles are among the most significant candlestick formations because they signal market indecision and can help you spot potential trend reversal opportunities.
What You'll Learn:
• Understanding doji candlestick patterns and their significance in market analysis
• How to identify valid doji formations
• The psychology behind doji candles: when buyers and sellers fight to a draw
• Using volume analysis to confirm doji pattern validity
• Finding meaningful doji patterns at trend highs and lows for reversal setups
• Timeframe considerations for doji analysis on any chart period
• Step-by-step trading strategy for doji reversal setups
• How to set stop losses and profit targets
• Real example using E-Mini S&P 500 futures on 60-minute charts
This tutorial may help futures traders and technical analysts who want to use candlestick patterns to identify potential trend reversals. The strategies covered could assist you in creating straightforward reversal setups when market indecision appears at key price levels.
Learn more about futures trading with Tradingview: optimusfutures.com
Disclaimer:
There is a substantial risk of loss in futures trading. Past performance is not indicative of future results. Please trade only with risk capital. We are not responsible for any third-party links, comments, or content shared on TradingView. Any opinions, links, or messages posted by users on TradingView do not represent our views or recommendations. Please exercise your own judgment and due diligence when engaging with any external content or user commentary.
This video represents the opinion of Optimus Futures and is intended for educational purposes only. Chart interpretations are presented solely to illustrate objective technical concepts and should not be viewed as predictive of future market behavior. In our opinion, charts are analytical tools—not forecasting instruments. Market conditions are constantly evolving, and all trading decisions should be made independently, with careful consideration of individual risk tolerance and financial objectives.

GOLD: Pre-market PrepSo for gold today, I see a lot of confluence around the prior week's high, prior day's high, and the prior value area high. We also had a poor high last Friday that we've clearly broken through.
Right now, we're in balance up above these key levels. My immediate plan is to continue going long up to the prior month's value area high. If we get a pullback to the confluence area, I want to take it up from there.
If the market opens and we accept back into the previous area, I'll be looking to go short from that area and take it down. That's my main analysis for gold today. Let’s trade smart, peace!

NQ Weekly Outlook & Game Plan 20/07/2025NQ Weekly Outlook & Game Plan
🧠 Fundamentals & Sentiment
Market Context:
NQ continues its bullish momentum, driven by institutional demand and a supportive U.S. policy environment.
📊 Technical Analysis:
Price is currently in price discovery, and the weekly structure remains strongly bullish — so I prefer to follow the strength.
We might see a minor retracement before pushing further above the all-time high (ATH).
🎯 Game Plan:
I'm expecting a potential retracement to the 0.5 Fibonacci level, which is the discount zone in a bullish environment.
Interestingly, the 4H liquidity zone aligns perfectly with the 0.5 Fib level — this confluence suggests price may gather enough energy from there to make new highs.
✅ Follow for weekly recaps & actionable game plans.
#202529 - priceactiontds - weekly update - daxGood Day and I hope you are well.
comment: Prior weeks close was 24332 and this was it was 24386. Bulls need to continue with higher lows and bears need to break below 24000 for lower prices. Not more magic to.
current market cycle: bull wedge
key levels for next week: 24000 - 25000
bull case: Bulls are still in control until we print lower lows again. We have 2 potential bull trend lines close to the daily ema and that’s around 24200 and will be my line in the sand for bulls next week. Below, chances of 24000 go up big time. If we stay above 24300, there is no reason we can not test back up to 24500 and above that we will likely try 24700+ again.
Invalidation is below 24000
bear case: Bears need a lower low below 24000. That’s really all there is to it. As of now the selling on Friday was decent but it’s not enough to expect follow-through selling. Below 24000 I think we can test the 50% retracement at 23900 but I’d be surprised if we go lower. Only an event could trigger that. Lower targets would be as marked on the chart.
Invalidation is above 24749
short term: Neutral. I want follow-through selling but will likely won’t get it. It’s still a bull wedge until we have a daily close below 24000.
medium-long term from 2025-06-29: Bull surprise last week but my targets for the second half of 2025 remain the same. I still expect at least 21000 to get hit again this year. As of now, bulls are favored until we drop below 23000.
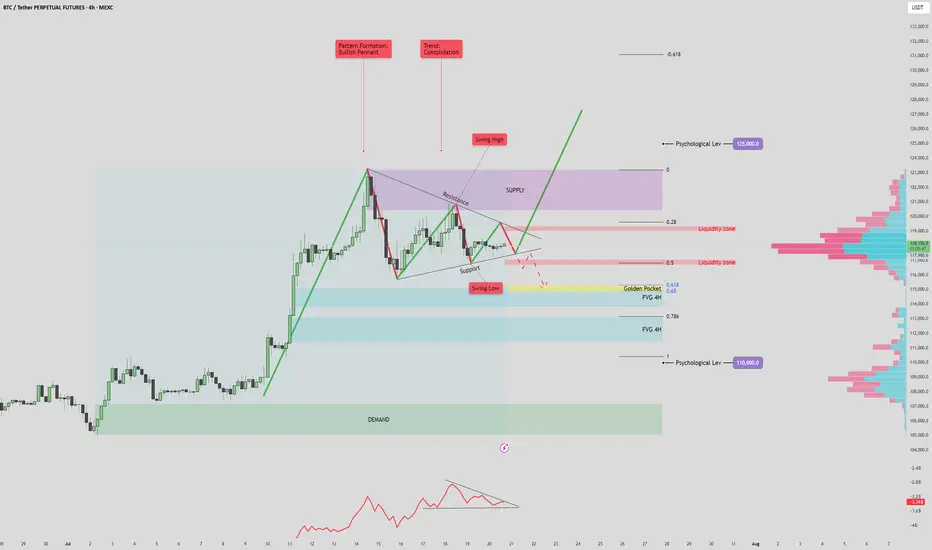
BTC/USDT 125k? or 110k fall again?BTC/USDT 4H Analysis – July 20, 2025
The current market structure shows a bullish pennant forming after a strong impulsive move upward, with price consolidating between key support and resistance levels. This pattern, combined with volume signals and key price zones, suggests a potential for a high-volatility breakout.
🔷 Volume Profile & OBV Insights
The On-Balance Volume (OBV) indicator is forming a symmetrical triangle, indicating a volume squeeze. This suggests a potential sudden spike in volume that could confirm the next major move.
Anchored Volume Profile (VPVR) on the right shows a notable low-volume area between 112K–115K. If price breaks below this zone, it could lead to a rapid selloff toward deeper fair value areas due to reduced liquidity support.
📈 Bullish Scenario
If price breaks above the pennant resistance and 119.5K liquidity zone, it may signal bullish continuation.
A successful retest of the breakout level as support would confirm strength, opening the door to:
Short-term target: 123K (supply zone and previous swing high)
Mid-term target: 125K (key psychological level and potential ATH)
Watch for confirmation via OBV breakout and strong bullish volume. Failure to sustain above the 118K–119K area could signal a bull trap.
📉 Bearish Scenario
A breakdown below pennant support and the 115K level would likely trigger a move into the low-volume range.
First key downside target: 114.7K–115.7K, which aligns with the Golden Pocket (Fib 0.618 zone) and a 4H Fair Value Gap (FVG).
This zone may act as a support or a liquidity grab reversal area.
If this zone fails to hold, deeper downside targets become likely:
FVG 2 (~112K)
Psychological support at 110K, which aligns with strong historical demand and a major VPVR node.
This bearish move may either confirm further downside momentum or present a fakeout opportunity if price sharply reverses from one of these deeper levels.
✅ Summary
BTC is coiled within a bullish pennant, with both bullish continuation and bearish breakdown scenarios in play. Volume confirmation and breakout direction will be key. Traders should monitor how price reacts around the 115K–118K zone for directional clarity. A move beyond this range, especially with volume support, will likely define the next trend leg.
Gold. 14.07.2025. The plan for the next few days.The nearest resistance zones are where it's interesting to look for sales. It's not certain that there will be a big reversal, but I think we'll see a correction. We're waiting for a reaction and looking for an entry point.
The post will be adjusted based on any changes.
Don't forget to click on the Rocket! =)

Pre-Market Prep 7.18.2025What it do, everyone! Here’s my pre-market prep for Friday, July 18th. Just to give you a quick overview, I'm using my prior value areas, the prior day's high and low, and the CVA levels from my market profile. I use all this history to help me plan my trades for the day.
So, starting with the S&P, as of now we’re green across the board. We’re in balance up from the prior day’s range, value area, and the CVA. My main plan is to look for acceptance and a pullback to a confluence area for longs. If we get rotational and break out of that area, I’m ready to go short.
For the NASDAQ, it's a similar story. We’re rotational in the prior value area and range, but we’re balanced up from the recent CVA. Right now, I’m waiting to see if we can confirm acceptance and then I’ll look for a short from that rotational area down to the prior value area low.
In the Russell, I’m seeing clear acceptance above all levels, so a pullback to the confluence area for a long would be ideal.
For Gold, I’m also seeing it in balance up on all fronts. My first move would be a long from the prior day’s high. If we drop a bit lower, I’ll be looking at that CVA and PVA area for another long.
The Euro is a bit more mixed. We’re rotational in the prior day’s range but balanced up in the value area and CVA. I want to clear the prior day’s high before taking any big moves.
The Yen is also rotational, so I’m looking to trade the extremes, maybe some scalps while we’re balanced in the prior value area.
For the Aussie Dollar, we’re in balance up from the PVA, but rotational in the prior day’s range and CVA. I’m looking for shorts near the top area and longs at the bottom, staying out of the middle for now.
And finally, Crude Oil is rotational on all fronts. My first plan is to look for shorts from the confluence area down to the prior day’s range.
That’s my pre-market prep for today. Let’s trade smart. Happy Friday, peace!

GOLD tests $3,310 then recovers, continues sidewaysInternational OANDA:XAUUSD fell to the support level of 3,310 USD, then recovered and continued to stabilize sideways due to the stronger US Dollar and market tensions eased after US President Trump said it was "extremely unlikely" to fire Federal Reserve Chairman Powell.
As of the time of writing, spot OANDA:XAUUSD was trading at 3,339 USD/oz.
Reuters reported on Wednesday that Trump is still open to the possibility of firing Powell. However, Trump said on Wednesday that he has no intention of firing Powell at this time, but did not completely rule out the possibility and reiterated his criticism of the Fed chairman for not lowering interest rates.
Data showed US producer prices unexpectedly held steady in June, as the impact of higher import tariffs on goods was offset by weakness in the services sector.
The unchanged US PPI in June showed wholesale prices were stabilising, suggesting the economic impact of tariffs may be smaller than initially feared.
The lower-than-expected core CPI and core PPI data did not provide the boost that was expected, which could mean that the market is focusing on other aspects. More broadly, as the Fed gradually eases policy, real yields could continue to fall, and gold will maintain its upward trend. However, if the market continues to reprice expectations for a hawkish rate cut, this could trigger a short-term correction.
SPDR Gold Trust, the world's largest gold-backed exchange-traded fund (ETF), said its holdings rose 0.33% to 950.79 tonnes on Wednesday from 947.64 tonnes in the previous session.
Technical Outlook Analysis OANDA:XAUUSD
On the daily chart, gold rebounded after falling and tested the support level noted by readers in yesterday's edition at 3,310 USD. The recovery brought gold prices back to work around the EMA21, continuing the sideways accumulation trend.
Structurally there is no change, as for gold to qualify for an upside move it needs to break resistance at the 0.236% Fibonacci retracement level then the short term target is the raw price point of $3,400. Meanwhile for gold to complete its bearish cycle it needs to sell below the 0.382% Fibonacci retracement level then the short term target would be around $3,246, more than the 0.50% Fibonacci retracement level.
The relative strength index (RSI) is also unchanged with the RSI activity around 50, indicating a hesitant market sentiment without leaning towards any particular trend.
Intraday, the technical outlook for gold prices continues to be a sideways accumulation trend, and the notable positions will be listed as follows.
Support: 3,310 – 3,300 – 3,292 USD
Resistance: 3,350 – 3,371 USD
SELL XAUUSD PRICE 3386 - 3384⚡️
↠↠ Stop Loss 3390
→Take Profit 1 3378
↨
→Take Profit 2 3372
BUY XAUUSD PRICE 3276 - 3278⚡️
↠↠ Stop Loss 3272
→Take Profit 1 3284
↨
→Take Profit 2 3290

2025-07-17 - priceactiontds - daily update - daxGood Evening and I hope you are well.
comment: Selling down from 24400 to 24300 on high volume and the bears just gave up and market showed where it really wants to go. Almost without resistance we just grinded higher for 24500. No more obvious resistance until ath.
current market cycle: bull trend
key levels: 24000 - 25000
bull case: Bulls want to leave the big gap open down to 24350 and go higher from here. 24750 is the obvious target but if bulls want it, there is no reason we can not print 25000. Any pullback should stay above 24350 or this rally is over again. Will be looking for longs against 1h 20ema tomorrow, unless bears clearly took over.
Invalidation is below 24350.
bear case: Bears tried down to 24275 but failed at the 1h 20ema and I doubt many will try to keep this a lower high below 24750. Bears have absolutely nothing once again. Nothing bearish about this on any time frame.
Invalidation is above 25100.
short term: Bullish. What could stop this? Only If they fire Jpow tomorrow but I doubt they will do it before markets close. Can only expect higher prices but I would not hold anything over the weekend. Make no mistake, if orange face fires Jpow, bonds will go apefeces and stonkz as well.
medium-long term from 2025-06-29: Bull surprise last week but my targets for the second half of 2025 remain the same. I still expect at least 21000 to get hit again this year. As of now, bulls are favored until we drop below 23000
trade of the day: Long 24300 because Globex low was 24242 and market clearly found no acceptance below the 1h 20ema.
GOLD's narrowing range, tariffs, Trump's political dramaOANDA:XAUUSD is still trading in a narrowing range, affected by the tariff game and the political drama that Trump is building. Currently, the price of gold is trading around 3,339 USD/oz, equivalent to a small decrease of about 7 dollars on the day.
Tariff Game
On July 16, US President Donald Trump announced that he would send letters to more than 150 countries, with tariffs expected to be 10% or 15%, to promote trade. He said these countries are not major US partners and will be treated equally, but left open the possibility of negotiating exemptions. The tariffs are similar to those proposed in April but were postponed due to concerns about market volatility. The resumption of the tariffs continues to destabilize financial markets and surprised partners such as the European Union, as they hoped to reach an early agreement with the US.
Political Play
Also on July 16, global financial markets were shaken by rumors that President Trump intended to fire Federal Reserve Chairman Jerome Powell. Many major news agencies such as the New York Times, Bloomberg and Reuters reported that Trump had prepared a letter of dismissal and consulted with Republican lawmakers, receiving positive feedback. Removing Powell before his term was believed to undermine confidence in the US financial system and the safe haven status of the USD. Trump later denied the plan, saying it was unlikely to happen unless there was serious wrongdoing. Markets reacted strongly: the USD fell and then recovered after Trump's statement, while gold lost most of its previous gains by the end of the session.
The gold market in particular, and the financial economy in general, are being affected by the activities of Trump, the creator of the global trade war, and the plays of Trump and the FED leading the market. Therefore, the basic formula in the current market context is best to follow Trump, and make sure not to miss any of Trump's status lines.
Technical outlook analysis of OANDA:XAUUSD
On the daily chart, the technical structure has not changed with the trend not yet clear and the price action clinging to the EMA21.
The technical conditions do not favor an uptrend or a downtrend, typically the RSI moves around the 50 level, indicating a hesitant market sentiment.
On the upside, gold needs to achieve the condition of breaking above the 0.236% Fibonacci retracement level of the price point of 3,371 USD then the target level will be around 3,400 USD in the short term, more than 3,430 USD.
Meanwhile, on the downside, gold needs to break below the 0.382% Fibonacci retracement, which would confirm a loss of the $3,300 level, then target around $3,246 in the short term, more than the 0.50% Fibonacci retracement.
Intraday, the sideways trend of gold price accumulation will be noticed by the following technical positions.
Support: $3,310 – $3,300 – $3,292
Resistance: $3,350 – $3,371 – $3,400
SELL XAUUSD PRICE 3381 - 3379⚡️
↠↠ Stop Loss 3385
→Take Profit 1 3373
↨
→Take Profit 2 3387
BUY XAUUSD PRICE 3309 - 3311⚡️
↠↠ Stop Loss 3305
→Take Profit 1 3317
↨
→Take Profit 2 3323
Pre-Market Prep
Today, I'm narrowing down to six key markets. For the S&P, it's all about waiting for a pullback from the prior day's high or a breakout above the CVA. If it dips back inside the range, I'm ready to go short with some scalps.
For the NASDAQ, it's looking strong. I'm thinking about a long position if it pulls back to the prior day's high.
Gold is in a downtrend across all areas, and I'm already in a short position from the CVA low. I'm thinking about adding to that if it pulls back to the prior day's low.
Crude Oil is pretty balanced. I'm looking at the high of the CVA for a short opportunity if it gets there.
For the Yen and Euro, both are rotational. I'm eyeing long opportunities if they show some acceptance and pullbacks from key levels.
That's the vibe for today. Let's trade smart, avoid the chop, and keep it moving. Peace!

SP500 ES Weekly Recap | ATH Deviation → Pullback or Powell Pump?Overview:
ES made a new all-time high last week, sweeping the previous high with strong momentum.
However, the move ended up being a deviation, and the price quickly reversed — suggesting short-term exhaustion.
Bearish Scenario (Baseline):
🔻 Rejection from ATH
🔻 Possible retracement targets:
12H Swing Low (turquoise line)
Weekly Fair Value Gap (purple zone)
I believe a pullback into those levels could provide bullish continuation setups for new highs. I’ll look for LTF confirmation once price reaches those zones.
Bullish Scenario (Catalyst-Driven):
🚨 If Fed Chair Powell resigns this week (a circulating macro rumor), the market may not wait for retracement.
This could lead to an aggressive breakout, driving ES and risk assets straight into new ATHs again.
Plan:
✅ Watch for LTF confirmation after pullback
✅ Stay open to both scenarios
✅ Focus on HTF bullish structure as long as key levels hold

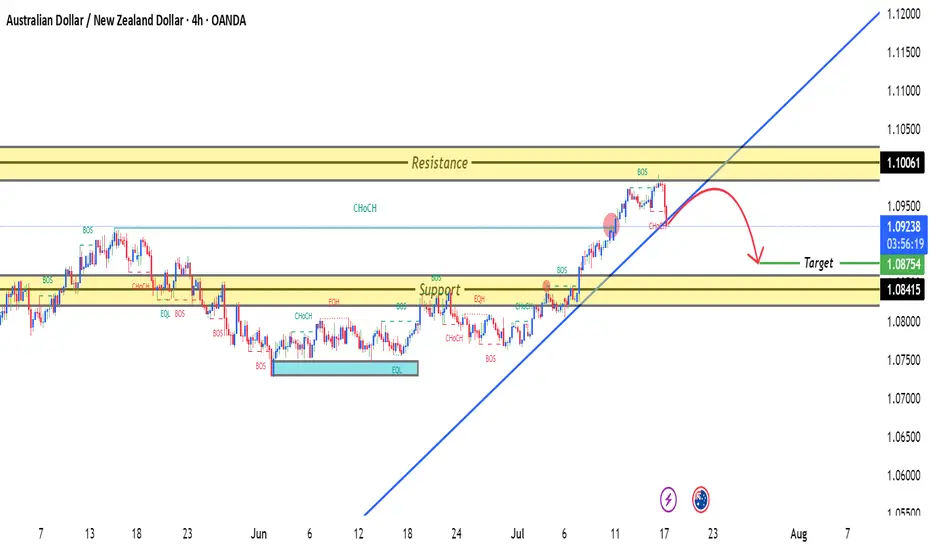
AUDNZD 4H TIME FRAME ANALYSISAUDNZD is currently in a short-term downtrend on the 4-hour chart. Price has been forming lower highs and lower lows, confirming bearish pressure. Recent candles show rejection at higher levels, supporting downside continuation.
1.09400 – 1.09550: Strong resistance zone where price was previously rejected multiple times.
1.09380 (your entry) aligns with a minor lower high, reinforcing this level as a valid sell area.