GOLD MARKET ANALYSIS AND COMMENTARY - [Sep 22 - Sep 26]Last week, OANDA:XAUUSD prices fluctuated strongly: opening at 3,645 USD/oz, falling to 3,626 USD/oz, rebounding to 3,707 USD/oz after the FED cut interest rates by 0.25%, but being under profit-taking pressure and cautious statements from Chairman Powell, the price fell to 3,627 USD/oz before recovering and closing at 3,685 USD/oz.
The Dot Plot shows that the FED may only cut 2 more times in 2025 and 1 time in 2026, while Powell's speech is no longer highly appreciated by the market due to the end of his term and the influence of President Trump.
In the short term, gold may adjust and accumulate, waiting for US economic data, US-China trade and geopolitical tensions. This week, the focus will be on the August PCE index: if it exceeds 3% YoY, the FED may postpone the interest rate cut, creating downward pressure on gold; if it is around 2.9% or lower, gold will be supported.
📌According to technical analysis, the gold price continues to be in the overbought zone. If the gold price does not surpass 3,708 USD/oz this week, it will quickly be pushed down to 3,626 USD/oz. If this level cannot be maintained, the gold price is at risk of falling to the 3,550 USD/oz area, or lower. On the contrary, if it surpasses 3,708 USD/oz, the gold price next week may reach 3,750 USD/oz.
Notable technical levels are listed below.
Support: 3,673 – 3,614 – 3,600 USD
Resistance: 3,700 – 3,707 USD
SELL XAUUSD PRICE 3751 - 3749⚡️
↠↠ Stop Loss 3755
BUY XAUUSD PRICE 3549 - 3551⚡️
↠↠ Stop Loss 3545
Futures

GOLD "lost steam" after the peak because the US Dollar increasedThe world OANDA:XAUUSD fell in the session on Thursday (September 18) after hitting a record high of 3,707.40 USD/ounce the day before. The main reason came from profit-taking activities of investors and the strengthening of the US dollar and treasury bond yields. As of the time of writing on Friday (September 19), spot gold was trading at 3,648 USD/oz, equivalent to an increase of 0.12% on the day.
New economic data from the US weighed on the market: initial jobless claims fell to 231,000, lower than expected, while the Philadelphia Federal Reserve manufacturing index unexpectedly jumped to 23.2, a sharp improvement from the previous month. This pushed the greenback higher and made gold more expensive. The 10-year Treasury yield rose to 4.102%, while the real yield was close to 1.722%, adding to the pressure on the precious metal. This was largely a technical correction after gold hit a series of new highs.
However, the long-term outlook for gold remains positive. The precious metal typically benefits when the Fed enters a policy easing cycle. In fact, the Fed just cut interest rates by 25 basis points, although there was no absolute consensus. Chairman Jerome Powell called it a “risk-control” measure for the labor market, but also affirmed that the Fed is in no hurry.
In addition, data shows that gold exports from Switzerland to China increased 254% in August, reflecting strong demand from Asia. The trend of diversifying foreign exchange reserves of the BRICS bloc continues to be a major support for gold prices.
Since the beginning of the year, gold has increased by nearly 39%, and investors still believe that the target of $ 4,000 / ounce can be challenged in the near future.
Technical Outlook Analysis OANDA:XAUUSD
Gold has had two sessions of technical corrections, but it still has all the bullish conditions in place, while the initial conditions for a deep correction have not yet appeared. Currently, gold is trying to recover and is still above the 0.236% Fibonacci retracement level, which can be said to be the closest support at the moment. On the other hand, gold is still in an uptrend channel and is receiving major support from the EMA21.
As long as gold remains above the $3,600 base point, the declines should be viewed as a short-term correction or a fresh buying opportunity.
The relative strength index (RSI) is also moving sideways after testing the 80 level, and a steep RSI break below 80 would be considered a signal for a possible deeper correction.
For the day, the overall technical outlook for gold is bullish, and the key points to watch are listed below.
Support: $3,614 – $3,600
Resistance: $3,673 – $3,700 – $3,707
SELL XAUUSD PRICE 3678 - 3676⚡️
↠↠ Stop Loss 3682
→Take Profit 1 3670
↨
→Take Profit 2 3664
BUY XAUUSD PRICE 3606 - 3608⚡️
↠↠ Stop Loss 3602
→Take Profit 1 3614
↨
→Take Profit 2 3620

The Future of Global Trading1. Introduction: What is Global Trading?
Global trading is the interconnected web of buying and selling goods, services, and financial instruments across borders. It is the lifeline of the world economy, where financial markets, commodities, currencies, and technologies all play a role.
In the future, global trading will not just be about moving oil, gold, or stocks — it will include digital assets, carbon credits, data, intellectual property, and even tokenized real estate. The traditional definition of trade is expanding, and the pace of change is unprecedented.
2. Historical Evolution of Global Trade & Markets
To understand the future, we need to look back:
Silk Road Era – Trade was physical, slow, and limited to goods like silk, spices, and metals.
Colonial & Industrial Age – Maritime trade routes and industrialization globalized markets.
20th Century – Rise of currencies, stock exchanges, and commodity markets.
Late 20th Century – Introduction of derivatives, futures, and global index trading.
21st Century – Digital revolution: algorithmic trading, blockchain, cryptocurrencies, tokenized assets.
The shift from physical goods to financial instruments and digital assets sets the stage for the next century of global trading.
3. Current Landscape: Financial Markets, Commodities, Currencies
Today, global trading is driven by three main pillars:
Financial Instruments – Equities, bonds, derivatives, and ETFs are traded across exchanges from New York to Tokyo.
Commodities – Hard (oil, metals, gold) and soft (agriculture, coffee, cotton) commodities drive global supply chains.
Currencies & Forex – The $7+ trillion per day forex market is the most liquid in the world.
But we’re at an inflection point. The future will see integration of financial and physical trading with technology like AI, blockchain, and tokenized assets.
4. Technological Disruption in Trading
Technology is reshaping every aspect of global trade:
Algorithmic Trading: 70%+ of trades in developed markets are now automated.
High-Frequency Trading (HFT): Millisecond execution reshapes liquidity.
Artificial Intelligence: Predictive models replacing traditional analysis.
Blockchain & Smart Contracts: Transparent, decentralized, and faster settlement.
Digital Platforms: Retail traders can trade global indices and commodities from their smartphones.
Future global trading will be platform-driven, borderless, and increasingly digital.
5. Future of Financial Instruments in Global Trade
Derivatives Expansion: More futures & options for niche sectors (like EV batteries, rare earth metals, data storage).
Index Trading Growth: Global indices like MSCI, FTSE, S&P, Nikkei, and Nifty will expand as investment products.
Tokenization of Assets: Real estate, bonds, commodities will be digitized and traded 24/7.
Synthetic Assets: Platforms will allow retail traders to invest in synthetic versions of stocks, bonds, and commodities globally.
The future is “democratized global trading” — anyone, anywhere can trade anything, anytime.
6. Impact of Geopolitics & Economic Policies
Global trade is not just economic, it’s political:
US-China Trade Rivalry – Will shape global supply chains.
Sanctions & Restrictions – Affects oil, defense, and technology trading.
Regional Alliances (BRICS+, ASEAN, EU) – Compete to control commodities and currencies.
Currency Wars & De-dollarization – Rising role of Yuan, Rupee, and digital currencies in trade settlement.
The future global market will be multipolar, not dominated by a single currency or nation.
7. Role of Artificial Intelligence & Automation
AI is the new backbone of global trading:
Trade Execution – AI-driven bots will dominate execution.
Market Predictions – Machine learning models will outperform humans in detecting patterns.
Risk Management – AI will calculate probabilities of market shocks instantly.
Fraud Detection & Compliance – Real-time monitoring across borders.
The trader of the future will be less of a chart reader and more of a data strategist.
8. Digital Assets, Blockchain & Tokenization
Digitalization is redefining global trading:
Cryptocurrencies – Bitcoin, Ethereum, and central bank digital currencies (CBDCs).
Blockchain-based Trade Settlement – Faster, cheaper, and borderless.
Tokenized Commodities – Gold, oil, and real estate will be traded as digital tokens.
DeFi (Decentralized Finance) – Will compete with traditional exchanges for capital and liquidity.
This creates a 24/7 global trading environment, unlike the traditional 9-to-5 market hours.
9. Risks & Challenges in Future Global Trading
Cybersecurity Risks – Hackers targeting global exchanges.
Regulatory Fragmentation – Different rules across regions.
Volatility from AI & Algorithms – Flash crashes, liquidity gaps.
Geopolitical Conflicts – Trade wars, sanctions, currency rivalries.
Climate Risks – Extreme weather disrupting supply chains.
Future trading will be more interconnected, but fragile.
10. Opportunities for Traders, Investors & Nations
Retail Traders – Borderless access to global markets.
Institutional Investors – Ability to diversify into tokenized assets.
Nations – Can attract global capital by becoming digital trading hubs.
Entrepreneurs – New platforms, exchanges, and trading tools will emerge.
The future belongs to those who can adapt, innovate, and trade across borders seamlessly.
Conclusion: The Road Ahead
Global trading is moving toward a fully digital, decentralized, and democratized system.
Technology (AI, Blockchain, Tokenization) will be the driver.
Geopolitics will shape supply chains and currency dominance.
Sustainability will guide investment flows.
New Hubs in Asia, Africa, and the Middle East will challenge traditional powers.
The future of global trading is not just about financial profits — it is about reshaping economies, redistributing power, and reimagining how the world connects.
We are entering an era where anyone can trade anything, anywhere, anytime — the true definition of a borderless global marketplace.

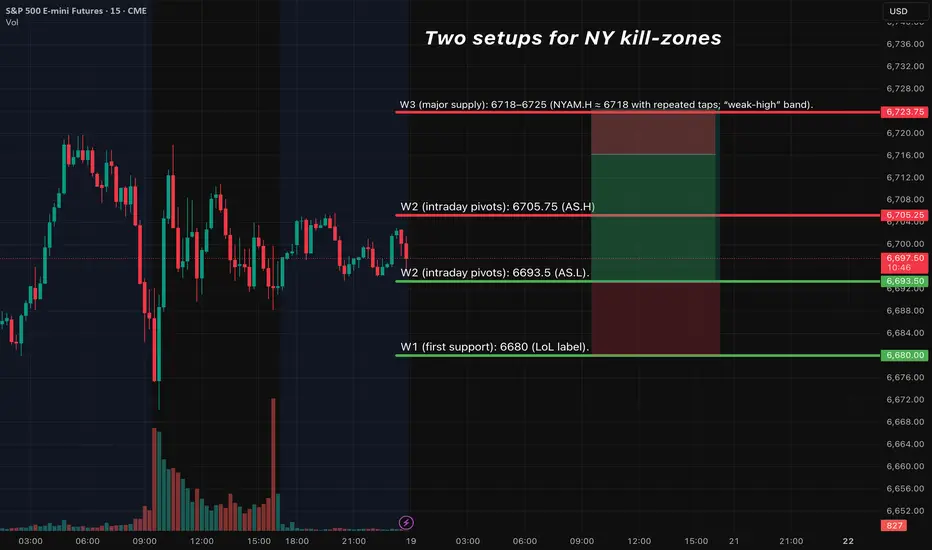
ES (SPX) Analyses - Key Levels - Setups - Fri, Sep 19Bias:
After the recent FOMC meeting, where they cut rates by 25 basis points on September 18, the E-mini S&P 500 futures are looking a bit bullish. There’s decent support holding up, but expect some bumpy trading around those all-time highs. We might see the market bouncing between the usual value areas, with traders likely to fade the extremes unless there’s a strong breakout.
Momentum could slow down as we get close to overbought levels, which might lead to some profit-taking on any rallies. On the flip side, expect strong buying when prices dip. For now, the trading range looks to be between 6660 and 6710, with swings of about 20 to 30 points likely in quieter trading conditions.
Friday has no major U.S. data on the weekly calendar wrap; Thursday’s LEI fell −0.5% m/m in Aug (already out), so macro tape-bombs are limited.
Quadruple-witching: 09/19/2025 is the quarterly expiration (third Friday of Sep). Also note ESU25 last trade = Sep 19, even though most trading has rolled to ESZ25. Expect flowy opens/closes and possible “pin” behavior. 
Options positioning (ES):
• Report totals: 5.83M total OI; put/call = 3.51. 
• Friday weeklies: 2.676M OI; P/C = 5.09 (put-heavy into expiry). 
• Sep contract (ESU5, 2 DTE): ~1.07M total OI; P/C = 3.01; ~185k volume in the latest report. 
• Vol: 30-day ATM IV ≈ 12.33% (down slightly d/d). 
• 0DTE share in SPX options has been >60% of volume recently — expect same-day gamma flows to matter on a quad-witch Friday. 
Bottom line: This is a put-heavy, expiry-dense tape with subdued vol. Expect pinning/reversion around big strikes and flowy opens/closes rather than a trend day—unless price cleanly accepts outside the range.
Next known catalysts (not tomorrow but near-term): Flash PMIs Mon 9/22; U. Michigan final sentiment Fri 9/26.
Setup 1 — Tier-2 (A+ Bounce) LONG @ 6680–6695
Trigger: sweep 6680–6690 → 15m close back above 6693.5 (AS.L) → 5m re-close + HL → 1m pullback hold.
Entry: 6694–6697.
SL: below the 15m sweep low −0.5 pt (hard).
TP1: 6705–6707 (AS.H). TP2: 6718–6725 (W3).
Management: at TP1 close 70%, move runner to BE; aim TP2; time-stop 45–60m if neither TP1/SL hits; max 2 attempts/level.
Setup 2 — Tier-1 (A++ Rejection-Fade) SHORT @ 6718–6725
Trigger: quick sweep above 6718–25 → 15m body back inside 6710 → 5m LH + re-close → 1m failure retest.
Entry: 6714–6718 on the re-close.
SL: above sweep high +0.5 pt.
TP1: 6705–6707; TP2: 6693–6695; stretch 6685–6680 only if momentum continues.
Management: same as above.
SPY options overlay (execution notes)
Given quarterly expiration and heavy 0DTE participation, prefer same-day SPY (AM window) with Δ≈0.60–0.70 on entries; consider 1-DTE for PM window to temper decay. (0DTE share data from Cboe.)
CRUDE OIL (WTI): Strong Bullish Confirmation?!
Update for my yesterday's idea for WTI Crude Oil.
The price retested a recently broken structure and we see a
strong bullish reaction to that today.
A bullish violation of a resistance line of a falling wedge pattern
indicates a strong buying pressure.
I think that the market will continue growing and reach 64.65 resistance soon.
❤️Please, support my work with like, thank you!❤️
I am part of Trade Nation's Influencer program and receive a monthly fee for using their TradingView charts in my analysis.

GOLD was clearly supported, but Powell stopped shortIn the trading session on September 17 in New York, the US financial market "spinned like a pinwheel" after the Federal Reserve's decision to lower interest rates and Chairman Jerome Powell's speech. The Dollar recovered after Mr. Powell's speech, causing gold to be sold off strongly. As of the time the article was completed (Thursday, September 18), the gold price was trading at 3,662 USD/oz.
The Fed officially cut interest rates by 25 basis points, bringing the federal funds rate band down to 4.00% - 4.25%, as expected. This is the first time the Fed has cut interest rates since December last year. This decision immediately caused the USD to plummet to a 4-year low against the euro, while spot gold prices jumped to a new record. However, after Powell's speech, the USD quickly recovered strongly, while gold fell from the peak due to profit-taking pressure.
The US stock market also fluctuated violently: all three major indexes rose sharply for a moment and then quickly reversed. Powell emphasized that the Fed was in no hurry to ease further and this move was considered a “risk management cut”.
In the statement after the meeting, the FOMC acknowledged that the US economy was “slowing”, employment was weakening, inflation was rising and the downside risks to the labor market were growing. However, the Fed still forecast two more 0.25% rate cuts this year, according to the “dotplot chart” tool showing the expectations of each official. New member Milan was the only one who opposed, wanting a sharp 0.5% cut.
Powell said future decisions would be considered “on a meeting-by-meeting basis,” suggesting the Fed is moving cautiously rather than aggressively easing. Officials are also increasingly converging on the idea that the Trump administration’s trade and tariff policies will only have a temporary impact on inflation.
Technical Outlook Analysis OANDA:XAUUSD
On the daily chart, gold has not been able to surpass the 3,700 USD price mark, the profit-taking momentum has caused the gold price to drop sharply and very quickly, but with the current position, it still has all the conditions to increase in price. Specifically, the main trend is still stable with the price channel as the medium-term trend, and the support from EMA21 as the main support, followed by the 0.50% Fibonacci extension level as the current nearest support.
On the other hand, in terms of momentum, the RSI has not yet signaled the possibility of a more significant downside correction, as the RSI is still operating in the overbought area and is mostly moving sideways, indicating that profit-taking in the market is limited, leading to limited downside momentum. A downward sloping RSI through the 80 level is the best signal for a more significant downside correction. During the day, if gold breaks above the 0.618% Fibonacci extension level again, it will be in a position to retest the $3,700 level, more so the $3,722 level once the original $3,700 level is broken.
Finally, the general trend of gold price on the daily chart is bullish and the notable points will be listed as follows.
Support: 3,645USD
Resistance: 3,677 – 3,700USD
SELL XAUUSD PRICE 3696 - 3694⚡️
↠↠ Stop Loss 3700
→Take Profit 1 3688
↨
→Take Profit 2 3682
BUY XAUUSD PRICE 3616 - 3618⚡️
↠↠ Stop Loss 3612
→Take Profit 1 3624
↨
→Take Profit 2 3630

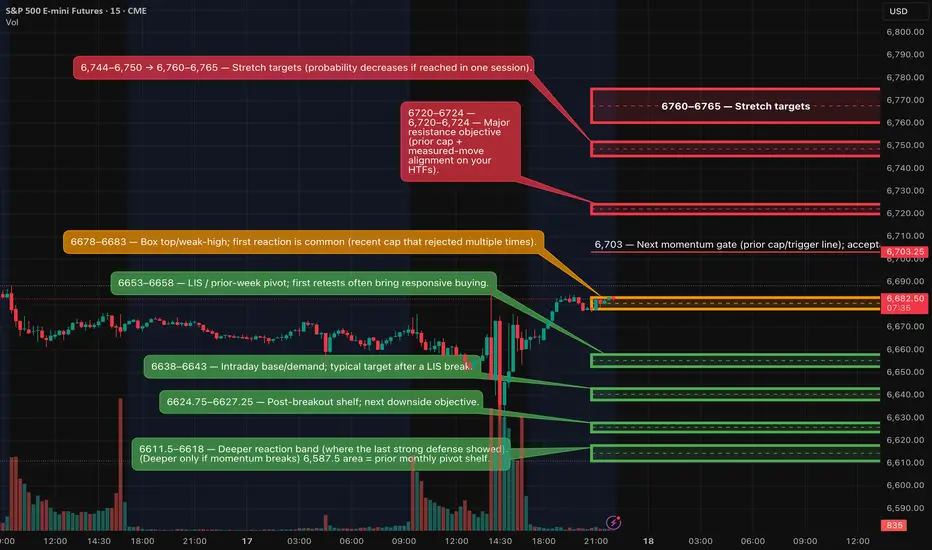
ES (SPX) Futures Analyses - Key Zones, Setups (Thur, Sep 17)Same map as last night.
Bias & structure
Price is pressing the box top 6,678–6,683 (1h AS.H 6,683.25) with a dense extension liquidity pocket above (D: 1.272 ≈ 6,763, 1.618 ≈ 6,856, 2.0 ≈ 6,959). We trade edge-only: fade a rejection at the top, or buy a sweep-and-reclaim at the control level.
Kill-zones (ET): London 02:00–05:00 (½–¾ size); NY AM 09:30–11:00; NY PM 13:30–16:00.
London (2 setups)
SHORT — Rejection Fade @ 6,678–6,683
15m tag → 15m close back ≤ 6,675 → 5m LH/re-close 6,672–6,674 → 1m LH entry 6,679–6,682.
Hard SL: above 15m rejection high +0.25–0.50.
TPs: 6,666–6,668 → 6,653–6,658 → 6,638–6,643.
Cancel if two 15m body-closes ≥ 6,685. Gate: TP1 ≥ 2.0R.
LONG — Sweep & Reclaim @ 6,653–6,658 (bias pivot)
Wick below LIS → 15m close back ≥ 6,658 → 5m re-close up 6,664–6,666 + HL → 1m HL entry 6,659–6,662.
Hard SL: below sweep low −0.25–0.50.
TPs: 6,678–6,683 → 6,703 → 6,720–6,724 (runner eyes 6,744–6,750).
U.S. (NY) (2 setups)
LONG — Acceptance Continuation > 6,683
Two 5m closes ≥ 6,685 (or one decisive 15m) → PB hold 6,679–6,683 flips to support → enter on 1m HL.
SL: under acceptance pivot −0.50–1.00.
TPs: 6,703 → 6,720–6,724 → 6,744–6,750 (→ 6,760–6,765).
Fail back below 6,679 on 5m = stand down.
SHORT — Breakdown & Failed Reclaim < 6,653
15m body close < 6,653 → retest fails (6,653–6,658 caps) → sell 6,651–6,654 on the fail.
SL: above fail-wick +0.50–1.00.
TPs: 6,638–6,643 → 6,624.75–6,627.25 → 6,611.5–6,618.
Back above 6,658 on 5m = invalidate.
Management (all plays)
First-touch priority; TP1 ≥ 2.0R gate using the 15m-anchored hard SL; no partials before TP1; at TP1 close 70% and set runner to BE; time-stop 45–60m if neither TP1 nor SL hits; max 2 attempts per level per session.
Fundamentals to respect (London → U.S. a.m.)
Bank of England MPC decision & minutes — Thu 12:00 BST (07:00 ET). High-impact for indices/GBP; often injects vol into London PM/NY open.
UK ONS releases — Thu 09:30 BST (04:30 ET) (e.g., housing affordability & Business Insights this week). Moderate.
U.S. Weekly Jobless Claims — Thu 08:30 ET (every Thursday; schedule page).
• Philly Fed Manufacturing Survey — Thu 08:30 ET.
• EIA Natural Gas Storage — Thu 10:30 ET.
Gold — Fed Cut Fade: Overextended, Eyeing a ThrowbackGold — Fed Cut Fade: Overextended, Eyeing a Throwback 🎯
Gold ripped higher into the FOMC, but the 25 bp cut was fully priced in. Post-decision, we saw the classic whipsaw — down → up → slow fade into the close. With the dollar and real yields catching a bid, the metal looks due for digestion before the next leg.
Technicals (4h)
Overextended run: Vertical leg higher with no real basing.
Supply zone: Sellers showed up around 3.71–3.75k.
Volume magnet: Confluence of the broken trendline + HVN sits down at ~3.41k.
Thin profile: Gap between 3.52 → 3.41k leaves room for a fast move lower if momentum flips.
Trade Idea
Short bias: Fading the 3.71–3.74k zone or on breakdown acceptance below 3.69k.
Stop: Above 3.76k (invalidation).
Target: 3.41k (major HVN + retest zone).
Macro Context
The Fed’s move matches expectations. With positioning stretched and “buy the rumor / sell the news” in play, near-term risk is for a pullback. Medium term, the trend stays bullish if easing continues and real yields drift lower.
Not financial advice — just sharing the setup I’m watching.
#Gold #GC1 #Futures #ShortSetup #VolumeProfile #FOMC

Orange Juice Futures (ICE) – Long Trade SetupDirection: Long Bias
Contract: Frozen Concentrated Orange Juice (OJ / ICE US)
Current Price: ~268.95
🔍 Technical Setup
Price has found strong support around the 240–260 zone, aligning with long-term trendline support.
EMA20 is stabilizing, hinting at a potential shift in momentum after a sharp correction.
Structure suggests a rebound move with upside toward the 350–400 zone (previous support-turned-resistance).
Risk is clearly defined with support just below the recent lows.
📊 Fundamentals & Sentiment
Supply shock remains in play:
Brazil’s citrus belt is under severe strain from citrus greening disease (HLB), with nearly half of orchards infected.
2024/25 production fell to multi-decade lows, leaving Brazilian OJ stocks near “technical zero.”
Demand resilience: While high prices have pressured some consumers, global demand for NFC and premium juice has stayed firm.
Weather risk: Brazil’s 2025/26 crop outlook is uncertain — drought and heat remain threats.
🧾 COT Positioning
Speculators: Net long positioning indicates a bullish tilt, reflecting continued interest in upside exposure.
Commercials: Hedgers are active on the short side, but this is typical for producers locking in higher prices.
Interpretation: With speculators holding long exposure and commercials hedging into strength, the structure supports a bullish bias from a positioning standpoint.
🎯 Trade Plan
Strategy Stats: My long setups have a 70% win rate and average +11% gain.
Entry Zone: Current levels (~265–270) on confirmation of support holding.
Target 1: 350
Target 2: 400+ (if momentum extends)
⚠️ Risks
Strong rebound in Brazilian production (2025/26 season) could ease supply stress.
Demand destruction if consumers continue to balk at higher prices.
Large speculator long unwinds could trigger a sharp correction.
✅ Conclusion
With supply tightness, disease risk, and speculators maintaining long exposure, the Orange Juice market is primed for a bullish rebound from strong support. My system favors a long entry here, targeting 350–400, with a 70% historical profitability rate on similar setups.

CRUDE OIL (WTI): Important Breakout
Crude Oil broke and closed above a major daily horizontal resistance.
With a high probability, a broken structure turns into a potentially strong
support now.
I will expect a rise from that and a bullish continuation to 65.56 resistance.
❤️Please, support my work with like, thank you!❤️
I am part of Trade Nation's Influencer program and receive a monthly fee for using their TradingView charts in my analysis.

GOLD price exceeds 3,700 USD, market waits for Fed decisionThe spot price of OANDA:XAUUSD has officially surpassed the $3,700/ounce mark, setting a new record. The main reason comes from the expectation that the US Federal Reserve (Fed) will cut interest rates this week. In addition, news that the Trump administration is considering imposing additional tariffs on imported auto parts has further boosted gold's status as a safe haven.
Current context: the global economy remains unstable, geopolitical tensions have not cooled down. The US dollar is weakening, falling to its lowest level since July, making gold more attractive. However, some investors have taken advantage of the opportunity to take profits ahead of the important Fed meeting on Wednesday.
Since the beginning of the year, gold has increased by more than 40% thanks to:
• The risk of a trade war, especially from US tax policy.
• Demand for gold from central banks, especially in emerging markets.
• A weak dollar and the possibility of further interest rate cuts.
According to CME Group’s FedWatch tool, investors are almost certain that the Fed will cut by 25 basis points, although there is still a (small) chance that the Fed will cut by 50 basis points.
Personally, I will continue to lean towards the upward trend of gold prices since the beginning of this year because gold has benefited from the low interest rate environment, making gold – which does not yield – more attractive. In addition, with President Trump publicly urging the Fed to “loosen aggressively”, the market is expecting a series of new interest rate cuts to be opened in the near future.
Technical outlook analysis of OANDA:XAUUSD
On the daily chart, gold briefly crossed the $3,700 mark in yesterday's US session, but then pulled back slightly.
Currently, the 0.618% Fibonacci extension level is the nearest support level, if the recovery from this $3,677 support level brings gold back to work above the $3,700 base point, this will be the most suitable condition for a new continued bullish cycle, and the target then is around $3,722 in the short term.
The 3,722 USD level is the price point of the 0.786% Fibonacci extension, in which the signal for a possible correction to the downside has not appeared in terms of momentum.
The RSI maintains its activity in the overbought area, but it is mostly moving sideways in this area, indicating that the market forces (profit taking/selling) are insignificant. A momentum signal for a possible correction to the downside is the RSI folding down below the 80 mark with a significant slope.
In case gold is sold below the 3,677 USD mark, it may fall further to retest the 3,645 USD mark, but the trend and the main bullish conditions will remain unchanged.
Finally, the bullish trend of gold prices will be noticed again by the following positions.
Support: 3,677 – 3,645 USD
Resistance: 3,700 – 3,722 USD
SELL XAUUSD PRICE 3729 - 3727⚡️
↠↠ Stop Loss 3735
→Take Profit 1 3721
↨
→Take Profit 2 3715
BUY XAUUSD PRICE 3653 - 3655⚡️
↠↠ Stop Loss 3649
→Take Profit 1 3661
↨
→Take Profit 2 3667

GOLD hits new all-time high, watch out for FedOANDA:XAUUSD continued to rise sharply, renewing all-time highs, currently trading around 3,678 USD/oz. Gold rose thanks to the weak Dollar and US Treasury yields. In addition, there was new news about Trump's tariffs. The US plans to add steel and aluminum derivatives to the tariff list. Trade uncertainty has contributed to the increase in gold prices.
The US Dollar Index TVC:DXY fell 0.3% on Monday and is now down another 0.11% at 97.235, hitting a one-week low, and the 10-year Treasury yield also weakened, reflecting that investors are preparing for a possible rate cut ahead of the Federal Reserve's highly anticipated meeting this week. The weaker dollar makes dollar-denominated gold more attractive because of the inverse correlation between the two assets.
Regarding Trump's tariffs, according to a notice issued by the U.S. Department of Commerce on Monday, the U.S. Bureau of Industry and Security (BIS) has established a process to include additional steel and aluminum derivatives in the tariff scope authorized by President Trump under Section 232 of the Trade Expansion Act of 1962. The notice said the filing period for the September 2025 period has begun. The filing period will begin on September 15, 2025, and end at 11:59 p.m. Eastern Time on September 29, 2025.
Traders are gearing up for the Federal Open Market Committee (FOMC) monetary policy meeting on September 16-17. Expectations for a rate cut are high, and as a result, US Treasury yields fell sharply on Monday. Gold prices are reflecting the restart of the Fed's easing cycle amid mixed data. Inflation remains high, but a revised jobs report last Tuesday showed that job growth from April 2024 to March 2025 was overestimated by 911,000, raising concerns about a labor market downturn.
As a result, last week’s data and Fed Chairman Jerome Powell’s abrupt change of heart at the Jackson Hole symposium in late August have opened the door to a 25 basis point rate cut. However, few still expect the Fed to cut by 50 basis points.
Along with their decision, Fed officials will also release their latest economic projections and a “dot plot” of interest rates, in which the committee charts the future path of the federal funds rate.
Investors will be watching U.S. retail sales data on Tuesday ahead of the Federal Reserve’s policy decision on Wednesday, which could shape gold’s price direction ahead of the Fed’s decision.
Focus on Federal Reserve Decision
The Federal Reserve will meet this week under unusually heavy pressure as US President Trump seeks greater influence over monetary policy and the Senate clears a seat for White House economic adviser Milan to join the rate-setting committee in time for a vote at its policy meeting on Wednesday.
On Monday, Trump tweeted that he was calling on Federal Reserve Chairman Powell to cut the benchmark interest rate “much more aggressively,” and hinted at the need for more aggressive monetary easing, citing the housing market as an example. This came just ahead of this week’s Fed meeting.
Traders have fully priced in a 25 basis point rate cut at the September 16-17 FOMC meeting and see a 5% chance of a 50 basis point rate cut, according to the Chicago Mercantile Exchange’s (CME) FedWatch tool.
Technical Outlook Analysis OANDA:XAUUSD
On the daily chart, gold continues to renew its all-time high, surpassing the 0.618% Fibonacci extension level noted by readers in the previous issue. And now, it is likely to continue towards the full price level of $3,700 with all the technical indicators in place.
The RSI is operating in the overbought area (80-100) but has not shown any signal for a possible price decrease, a signal for a corrective price decrease is when the RSI bends down below 80. Therefore, in terms of momentum, gold remains very resilient.
The short-term trend is highlighted by the price channel, while the main support is from the EMA21.
As long as gold remains above the raw price point of $3,600, the main technical outlook in the short-term is bullish, the dips should only be viewed as a short-term correction or a new buying opportunity.
During the day, the bullish outlook for gold will be highlighted again by the following positions.
Support: $3,677 – $3,645
Resistance: $3,700 – $3,722
SELL XAUUSD PRICE 3699 - 3697⚡️
↠↠ Stop Loss 3703
→Take Profit 1 3691
↨
→Take Profit 2 3685
BUY XAUUSD PRICE 3645 - 3647⚡️
↠↠ Stop Loss 3641
→Take Profit 1 3653
↨
→Take Profit 2 3659

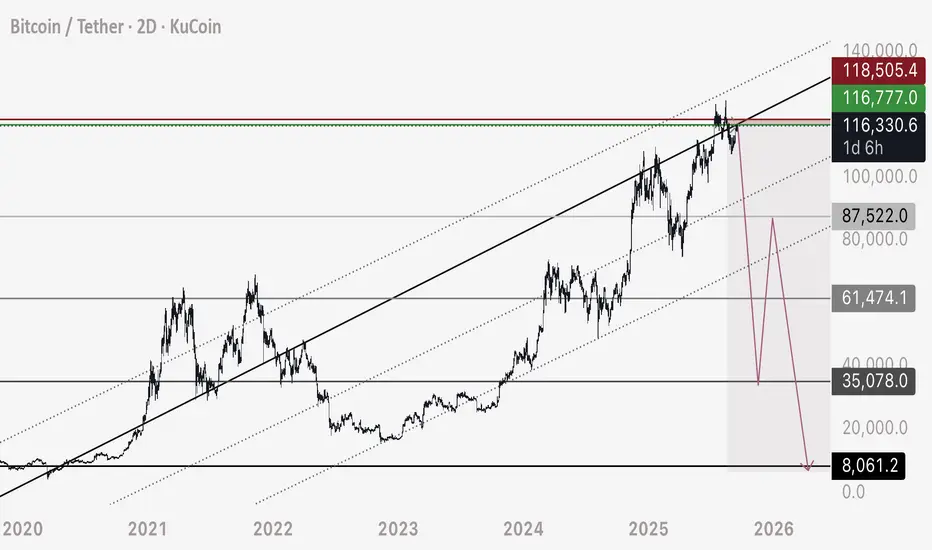
BTC Short Update - First Entry Point Hit Hi all, we have hit the first entry level on this trade idea again, and I will provide you with updated numbers.
First of all - to those asking “why” this would happen - please see my related idea on DXY as well as Blackrock.
For those asking “how” it’s possible, please see my tutorial on drawing heatmaps and understanding how bitcoin moves.
For those following my ideas, I explain order block analysis, my theory on how Bitcoin moves, and here we have a trading plan compiling it all together.
In theory, these drops should happen very quickly - as I explain the technicals of it in the order block tutorials.
Entry - 116,300 to 116,800
Stop Loss - (Can be lowered to 118,000)
Targets:
1) 90,000
2) 62,000
3) 38,000
After the third target we will likely rise to 86,000-88,000 area - however the short may be held all the way to 8,000.
88,000 is a major bearish trendline - I expect this will break, we will form a 3 wave corrective pattern and rise back up to retest this level.
4) 20,000 (Potential bottom 18,000)
5) 10,000
God speed and happy trading.
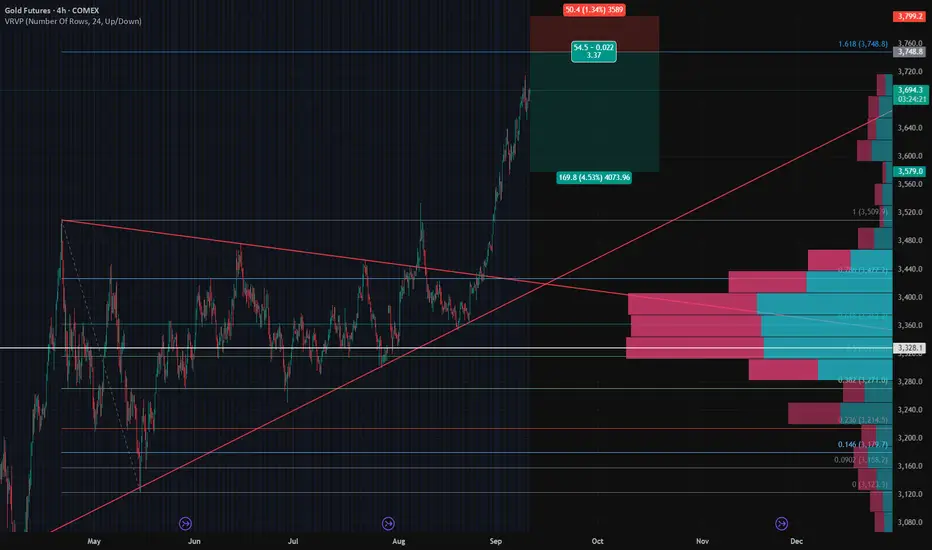
Gold Futures – Short Setup to Lock in Profits🟠 Gold Futures – Short Setup to Lock in Profits
Gold has had a strong breakout above the symmetrical triangle and has now pushed into an extended move near $3,700+. While the trend remains bullish on the higher timeframe, the current leg looks overextended, and I’m looking to hedge profits with a short setup.
🔑 Key Technicals
Pattern Breakout: Gold broke out of a long consolidation wedge and accelerated higher.
Resistance Zone: Price is testing the Fib 1.618 extension near $3,750, a potential exhaustion area.
Volume Profile: Strong demand zone sits between $3,300 – $3,360 where most volume is concentrated. A pullback could retest this area.
Risk-Reward: Setup gives ~1:3.4 RR with stop above recent highs and target into the HVN zone.
📉 Trade Idea – Protective Short
Entry: 3750
Stop Loss: 3800 (extension level).
Take Profit: $3580
⚖️ Strategy
This is not a reversal call – the larger trend is still bullish. The short setup is hedge/profit-protection only, aiming to capture a pullback after the parabolic leg.
I’ll be watching if buyers can defend $3,600 on the first dip; failure to hold could accelerate selling toward the high-volume zone.
📊 Bias
Short-term: Bearish (pullback expected)
Mid-term: Neutral to Bullish (trend intact above $3,300)
What do you think – do we see a healthy correction here, or is gold too strong to fade yet?
Sugar Futures Long SetupThis is my play — based on seasonality, COT index, and supply/demand.
Seasonality into Q4 historically supports sugar strength.
COT Index: commercials/hedgers are now heavily long, which typically signals a turning point — these players are often positioned opposite speculators at major inflection zones.
Managed money has been trimming shorts, opening the door for a short-cover rally.
Price is pressing into a long-term base zone, with RSI washed out and downside momentum stalling.
Trade Plan
✅ Entry: initiating longs around current levels (~15.8c/lb).
🎯 Target (TP): 17.50c/lb — confluence of prior resistance and seasonal tendency.
🔒 Stop: under recent structure lows (~14.8c/lb) for clean invalidation.
Bias
Positioning, seasonals, and supply/demand all line up for a long setup.
With commercials positioned aggressively long, I see this as a potential turning point with asymmetric upside into 17.5c.
⚠️ Not financial advice — just my read on sugar positioning and seasonals.

ES — Week Ahead (Sep 15–19) — Fundamentals & Key Risk WindowsMacro focus: FOMC (Wed 2:00/2:30 pm ET), plus Retail Sales, Industrial Production, Housing Starts, Jobless Claims, Philly Fed, and LEI.
Calendar (ET):
Tue 9/16
• Retail Sales (Aug) 8:30 — Census schedule confirms Sep 16, 8:30 am release.
• Industrial Production (Aug) 9:15 — G.17 release calendar shows Sep 16 at 9:15 am.
• NAHB Housing Market Index (Sep) 10:00 — NAHB schedule sets Sep 16, 10:00 am.
• FOMC (Day 1) begins — Fed calendar.
Wed 9/17
• Housing Starts/Permits (Aug) 8:30 — Census/HUD note next report Sep 17, 8:30 am.
• FOMC Statement 2:00 / Powell 2:30 — Fed event calendar.
Thu 9/18
• Initial Jobless Claims 8:30 — DOL weekly; last print 263k (spike tied to TX/fraud anomalies).
• Philly Fed (MBOS) 8:30 — 3rd Thu schedule.
• Conference Board LEI 10:00 — next release Sep 18, 10:00 am.
Fri 9/19
• State Employment (Aug) 10:00 — BLS schedule.
• (FYI for next week: Existing Home Sales (Aug) Tue Sep 23, 10:00 am.)
Context to watch:
• Markets widely expect a 25 bp cut at the Sep 16–17 FOMC; path/“dots” and Powell’s tone matter more than the cut size.
• Michigan sentiment (prelim) fell to 55.4 with inflation expectations elevated (1-yr 4.8%, 5-yr 3.9%).
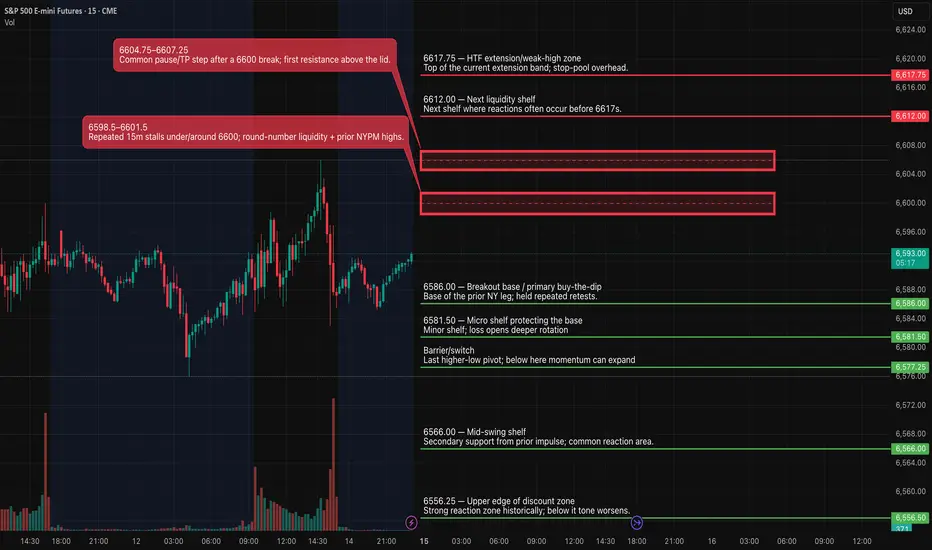
Tomorrow (Mon 9/15) — Trade Plan
Kill-zones (ET): NY AM 09:30–11:00; NY PM 13:30–16:00.
News risk: NAHB 10:00 (size down or wait 2–3m around print)
Long from support 6586 → TP1 6600
• 15m trigger: Rejection at 6586 (close ≥ 6587 after testing ≤ 6585).
• 5m confirm: Higher-low + close ≥ 6588.
• 1m entry: First retest that closes back above 6587.
• Hard SL: 15m wick low − 0.25–0.50.
• TP1: 6600 (book 70%, runner 30% @ BE).
• TP2 (runner): 6606.25.
Short from resistance 6600 → TP1 6586
• 15m trigger: Rejection at 6600 (close < 6596.5 after probing ≥ 6598.5).
• 5m confirm: Lower-high + close < 6596.0.
• 1m entry: First retest that closes back below 6596.5.
• Hard SL: 15m wick high + 0.25–0.50.
• TP1: 6586 (book 70%, runner 30% @ BE).
• TP2 (runner): 6581.50.
Weekly plan—how fundamentals change our timing
• Tue AM (Retail Sales 8:30 / IP 9:15 / HMI 10:00): Expect a more directional NY AM; trade level→level but avoid first prints by ±3–5m.
• Wed (FOMC 2:00/2:30): Treat NY PM as the main event; no positions carried into 1:55–2:35 unless already at TP1 with runner @ BE.
• Thu (Claims/Philly/LEI): 8:30–10:00 stack can create a trend morning; trade acceptance if a 15m body prints through a level.
BTC ANALYSIS🔮 #BTC Analysis
🌟🚀 As we said earlier #BTC moved around 5%. Right now we would see a little retest and then a bullish movement will be seen soon
🔖 Current Price: $1,15,858
⏳ Target Price: $1,21,713
⁉️ What to do?
- We have marked crucial levels in the chart . We can trade according to the chart and make some profits. 🚀
#MKR #Cryptocurrency #Breakout #DYOR

GOLD rebounds strongly, supported by US dataGold prices were volatile during the New York trading session on Thursday (September 11) due to the influence of the US CPI index and initial data on unemployment benefits applications. OANDA:XAUUSD price has recovered strongly during today's Asian session (September 12) and is currently trading at 3,647 USD/oz.
Very weak initial U.S. jobless claims data eased concerns over inflation data. The likelihood of a Federal Reserve rate cut next week remains high, supporting gold prices and recouping most of the day’s losses.
Data released by the U.S. Bureau of Labor Statistics on Thursday showed the consumer price index (CPI) rose more than expected in August from the previous month, but the year-over-year increase was in line with expectations.
The data showed that the CPI rose 0.4% month-over-month in August, beating the 0.3% forecast by economists surveyed by Dow Jones. However, the 2.9% year-over-year increase was in line with expectations. Moreover, the core CPI, which excludes the more volatile food and energy components, rose 0.3% month-over-month and 3.1% year-over-year, both in line with Dow Jones' forecasts.
Meanwhile, the US labor market is showing signs of slowing: weekly jobless claims unexpectedly jumped on Thursday after jobs growth data was revised down earlier this week. In the week ending September 6, initial jobless claims rose 27,000 to a seasonally adjusted 263,000, the highest since October 2021, far exceeding market expectations of 235,000.
Initial data on unemployment claims 'saved' OANDA:XAUUSD
Gold rallies after finding support at the 0.382% Fibonacci extension trendline note to readers in yesterday's issue.
The rally has now just cleared the 0.50% Fibonacci level, which provides the initial conditions for a possible retest of the all-time high at the 0.618% Fibonacci level.
The technical structure has not changed much with the uptrend dominating the market, from the uptrend channel as the main trend, the main support from EMA21 while RSI has not shown any signal for the possibility of a price decrease.
Therefore, the technical chart summary is completely uptrend and the notable price points during the day will be listed as follows.
Support: 3,613 - 3,600 USD
Resistance: 3,645 - 3,677 USD
SELL XAUUSD PRICE 3682 - 3680⚡️
↠↠ Stop Loss 3686
→Take Profit 1 3674
↨
→Take Profit 2 3668
BUY XAUUSD PRICE 3530 - 3532⚡️
↠↠ Stop Loss 3526
→Take Profit 1 3538
↨
→Take Profit 2 3544

CRUDE OIL (WTI): Strong Bearish Pressure
WTI Crude Oil is under a strong bearish pressure after
US CPI release today.
A bearish breakout of a support line of a flag pattern
in a clear intraday downtrend on a 4H time frame leaves
a strong confirmation.
I think that the price will reach 62.0 level soon.
❤️Please, support my work with like, thank you!❤️
I am part of Trade Nation's Influencer program and receive a monthly fee for using their TradingView charts in my analysis.

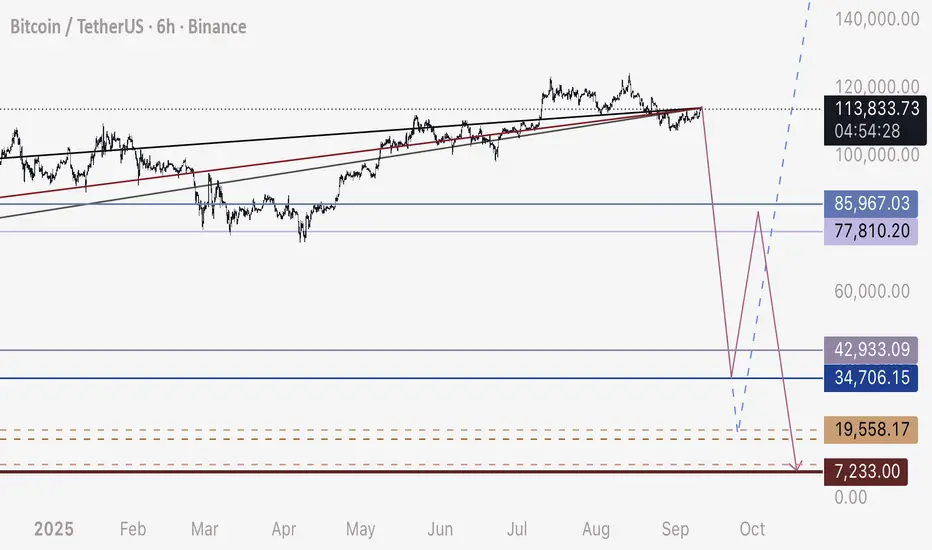
BTC - Crash Path PossibilitiesI expect Bitcoin to crash hard today, and here is a zoomed in look at my potential pathways.
NOTE - See linked related idea on DXY to make sense of this more
Beginning with most likely in my own opinion, to least likely:
Option 1:
114,200 to 35,000 - Short
35,000 to 85,000-86,000 - Long
85,000 to 8,000 - Short
8,000 - Long Entry
Option 2:
114,000-115,000 to 18,000-19,500 - Short
20,000 - Long Entry
Option 3:
114,200 to 43,000 - Short
43,000 to 77,000 - Long
77,000 to 8,000 - Short
8,000 - Long Entry
Strategy:
- Regardless of option I am short Bitcoin
- I will watch for a sudden crash initiate today
- I will first watch for a hold and bounce at 35,000 - closing 75% of my short at 45,000 (I expect wick to be very fast and hard to trade exact numbers)
- If we see a bounce at 35,000 - I will open a hedge long at that level
- Repeat first four steps if we drop below 30,000, looking for the correct bottom and closing short accordingly
- Safest option is low leverage short and spot buys at the bottom levels
Thanks to those who have been following me and supporting my ideas. I know I’m the only one speaking about this.
Happy trading.
Sep 10 MES Recap: Watching MAG7, Session Highs/Lows, and Higher MES Journal – September 10, 2025
Today I traded MES using supply and demand levels, while also tracking leadership from the MAG7 (with QQQ as my main proxy).
Track the MAG7 with me on TradingView using the MAG7
List .
I didn’t trade with this strategy until a few guys in my Discord recommended it. I had a bit of a learning curve, but I finished green on most accounts for the first time in a while.
Context I Tracked
Asian session high/low: 6,514 / 6,492
London session high/low: 6,528 / 6,506
Previous day high/low: 6,536.25 / 6,489.25
PPI report (Aug 2025): -0.1% vs forecast, shifted bias from bullish to bearish intraday
VWAP levels on both ES and QQQ
Wins
Stayed green overall on funded accounts with payout potential.
Saw the end-of-day pump confirmed by MAG7, even after an initial retrace.
Reinforced my supply/demand and VWAP process.
Losses and Lessons Learned
Entered one trade without higher timeframe confirmation, which cost me a FundingTicks eval account (treating this loss as tuition).
Learned that higher timeframes (1H/4H/Daily) must confirm intraday levels before entering.
Looking Forward
I’ll combine:
Supply/Demand + Session Highs/Lows
Leader ETF (QQQ/MGK/MAG7)
Higher Timeframes (1H/4H/Daily)
This approach gives me more conviction and fewer blind trades.
Indicators
Since I’m still learning how to mark levels properly, I’m starting out with indicators to help reinforce that I’m using potentially correct levels. I primarily used:
Asian
& London Sessions High/Lows
Previous
Highs & Lows
Supply
and Demand Visible Range
TradingView default VWAP indicator

SPX500 Holds Above 6,527 Ahead of U.S. PPI DataSPX500 – Overview
Global equities rose early Wednesday as bets for a Federal Reserve rate cut next week strengthened after more weak U.S. jobs data. Traders now await the release of U.S. PPI today and CPI tomorrow, which may spark short-term volatility, though few expect them to alter the Fed’s plans.
Technical Outlook:
📈 The index remains in a bullish trend, with potential to set a new ATH near 6,550. A confirmed breakout above this level could open another bullish leg.
📉 To confirm bearish momentum, price would need to close a 1H candle below 6,527, exposing downside targets at 6,518 → 6,506.
Key Levels:
Pivot: 6,527
Resistance: 6,550 – 6,566
Support: 6,518 – 6,506

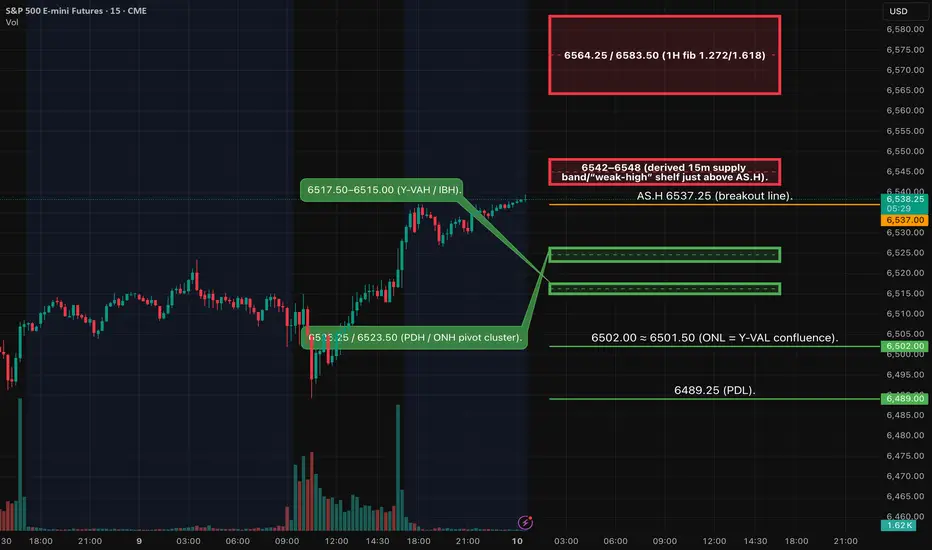
ES1! — Analyses (Sep 10) - Key Zones SeyupsHTF remains bullish into a labeled weak‑high cluster. Tomorrow’s path likely pivots around 6523–6527 (ONH/PDH cluster). Two A++ plays only after event‑led volatility prints structure:
Two possibilities:
Continuation LONG on acceptance > 6537 → 6564/6583.
Fade SHORT on sweep into 6542–6548 + 5m and 15m bearish confirmation → 6526/6510/6502.
SMT check with NQ is required.
Continuation LONG (A++) — “Acceptance > 6537”
Sweep → 5m MSS up → 5m close above 6537 → retest 6531–6533 (derived 5m OB/FVG at prior close shelf) for entry.
Entry: 6532 ±1.
SL: 6524 (structure; back inside PDH/ONH cluster).
• TP1: 6564.25 (1H 1.272) → ~+32.3 pts ≈ 4.0R.
• TP2: 6583.50 (1H 1.618) → ~+51.5 pts ≈ 6.4R.
• TP3: 6668+ (4H fib region) — runner; trail by 15m/30m closes.
Management: Scale ½ at TP1; move to BE only after a 5m close through TP1 or new structure; time‑stop 45–60 min if no progress in a kill zone.
Fade SHORT (A++) — “Sweep 6542–6548”
This is counter‑HTF; require 5m MSS down + 15m bearish close before entry (your rule).
Entry: 6545 ±2 after confirmations.
SL: 6552 (above sweep high/5m OB).
• TP1: 6526.25 (PDH/ONH) → ~19 pts ≈ 2.7R.
• TP2: 6510 (derived 15m demand near VWAP band) → ~35 pts ≈ 5.0R.
• TP3: 6502 (ONL=VAL) → ~43 pts ≈ 6.1R.
• TP4: 6489.25 (PDL) → ~56 pts ≈ 8.0R.
Management: Scale ½ at TP1; move to BE only after a 5m close < 6526 and fresh LTF structure; trail above last 5m swing/VWAP.
Fundamentals (tomorrow — Eastern Time)
• 08:30 — PPI (Aug). BLS schedule confirms Sep 10 @ 08:30.
• 10:30 — EIA Weekly Petroleum Status (energy vol shock risk). Standard release Wednesdays 10:30; PDF posts after 1:00 pm.
• 13:00 — UST 10‑yr (reopening). Treasury’s tentative auction schedule shows Wed Sep 10; competitive close customarily 1:00 pm ET.
• Heads‑up (Thu): 08:30 — CPI (Aug) next day.
• FOMC next week: Sep 16–17.