CAD JPY Entry Setup 1 hour Timeframe CAD JPY Entry Setup 1 hour Timeframe
Entry Setup: Bullish break and retest
Additional confluence: 0.618 - 0.50 Fib Retracement Level.
Candlestick confirmation: No confirmation yet so we wait.
Fyp

Netflix Skyrockets After Q1 Revenue Surge: What’s Next?📺 NASDAQ:NFLX has recently exhibited a strong bullish trend, supported by both technical breakout structure and positive fundamental developments. After an extended rally from the March lows, the stock managed to break above a key resistance zone between $1,080 and $1,100, it has now been decisively cleared. With this breakout, the structure confirms bullish momentum, and the expectation is for a retest of this newly formed support area before resuming the uptrend.
The price is currently around $1,133, and a pullback into the $1,060–$1,080 zone would present a high-probability buy opportunity. This aligns with classic price action behavior: after a breakout, markets often retrace to test former resistance, now turned support. If we see it retest, it would validate the technical setup for a continuation move toward the projected target of $1,220.
🌟From a fundamental perspective, the recent Q1 earnings report (released on April 17, 2025) added strong fuel to the upside momentum. Netflix reported $10.54 billion in revenue for the quarter, exceeding Wall Street’s expectations and representing a 13% year-over-year growth. Net income also impressed, coming in at $2.9 billion. Perhaps more telling than the earnings themselves was Netflix’s decision to stop reporting quarterly subscriber numbers. This shift in focus toward profitability and revenue per user signals confidence in their monetization model and emphasizes a transition to a more mature phase of growth. Management’s tone on the earnings call adds to all this, citing growing traction in its ad-supported tier and plans to expand into live sports and podcast-style content.
💰Technically, the overall structure remains bullish. The breakout is clean, and volume is supportive. The area above $1,140 has low volume resistance, which means price can move relatively easily toward the next psychological barrier at $1,220. Any deeper pullback that breaches below $1,020 would invalidate the short-term bullish bias, as it would signal a failure to hold above former resistance and could mean the start of a deeper correction toward the trendline support from last October.
🚀 In conclusion, the current market behavior suggests Netflix is in the process of forming a bullish continuation, supported by a clean breakout above prior resistance, robust financial performance, and an optimistic revenue outlook.
Price is likely to retest the breakout zone, offering a potential long setup anticipating a move higher if momentum remains strong. The technical picture is backed by future growth plans, making Netflix a stock to watch closely in the coming weeks for confirmation of the pullback and continuation.

US DOLLAR at Key Support: Will Price Rebound to 103.000TVC:DXY is currently approaching an important support zone, an area where the price has previously shown bullish reactions. This level aligns closely with the psychological $100 , which tends to have strong market attention.
The recent momentum suggests that buyers could step in and drive the price higher. A bullish confirmation, such as a strong rejection pattern, bullish engulfing candles, or long lower wicks, would increase the probability of a bounce from this level. If I'm right and buyers regain control, the price could move toward the 103.00 level.
However, a breakout below this support would invalidate the bullish outlook, potentially leading to more even more downside.
This is not financial advice!

NZDJPY - Potential bounce to 85.300 from SupportOANDA:NZDJPY has reached a major support level, an area where buyers have previously shown strong interest. This zone has acted as a key zone, increasing the likelihood of a bounce if buyers step in.
A bullish confirmation, such as a strong rejection pattern, bullish engulfing candles, or long lower wicks, would strengthen the case for a move higher. If buyers take control, the price could bounce toward the 85.300 target. However, a decisive breakdown below this support would invalidate the bullish scenario and could lead to further downside.
This isn’t financial advice, just my take on how I approach support and resistance zones. Best to wait for clear confirmation, like a strong rejection or a volume spike, before making a move.
Every trader has a unique perspective. Let’s discuss this setup within the TradingView community!

Tesla: bounce expected at $200 Support?NASDAQ:TSLA is currently approaching an important support zone, an area where the price has previously shown bullish reactions. This level aligns closely with the psychological $200 mark, which tends to carry added weight in the market .
The recent momentum suggests that buyers could step in and drive the price higher. A bullish confirmation, such as a strong rejection pattern, bullish engulfing candles, or long lower wicks, would increase the probability of a bounce from this level. If I'm right and buyers regain control, the price could move toward the 260.00 level.
However, a breakout below this support would invalidate the bullish outlook, potentially leading to more downside.
This is not financial advice but rather how I approach support/resistance zones. Remember, always wait for confirmation, like a rejection candle or volume spike before jumping in.

GOLD Trending Higher - Can buyers push toward 3,238?OANDA:XAUUSD is trading within a well-defined ascending channel, with price action consistently respecting both the upper and lower boundaries. The recent bullish momentum indicates that buyers are in control, suggesting a potential continuation.
The price has recently broken above a key resistance zone and may come back for a retest. If this level holds as support, it would reinforce the bullish structure and increase the likelihood of a move toward the 3,238 target, which aligns with the channel’s upper boundary.
As long as the price remains above this support zone, the bullish outlook stays intact. However, a failure to hold above this level could invalidate the bullish scenario and increase the likelihood of a pullback toward the channel’s lower boundary.
Remember, always confirm your setups and trade with solid risk management.
Best of luck!

BITCOIN Outlook: Watch for a Drop Toward $85100COINBASE:BTCUSD has reached a key resistance level, an area that has been a key point of interest where sellers have regained control, leading to notable reversals in the past. Given this, there is potential for a bearish reaction if price action confirms rejection, such as a bearish engulfing candle, long upper wicks or increased selling volume.
If the resistance level holds, I anticipate a downward move toward 85,100$, which represents a logical target based on previous price behavior and market structure.
However, if the price breaks above this zone and sustains above it, the bearish outlook may be invalidated, leading to further upside.
Just my take on support and resistance zones, not financial advice. Always confirm your setups and trade with solid risk management.

SOLANA at key support zone - Is $160 within reach?BINANCE:SOLUSDT has reached a major support level, an area where buyers have previously shown strong interest. This zone has acted as a key zone, increasing the likelihood of a bounce if buyers step in.
A bullish confirmation, such as a strong rejection pattern, bullish engulfing candles, or long lower wicks, would strengthen the case for a move higher. If buyers take control, the price could rally toward the $160 target. However, a decisive breakdown below this support would invalidate the bullish scenario and could lead to further downside.
This isn’t financial advice, just my take on how I approach support and resistance zones. Best to wait for clear confirmation, like a strong rejection or a volume spike, before making a move.
Every trader has a unique perspective. Let’s discuss this setup within the TradingView community!

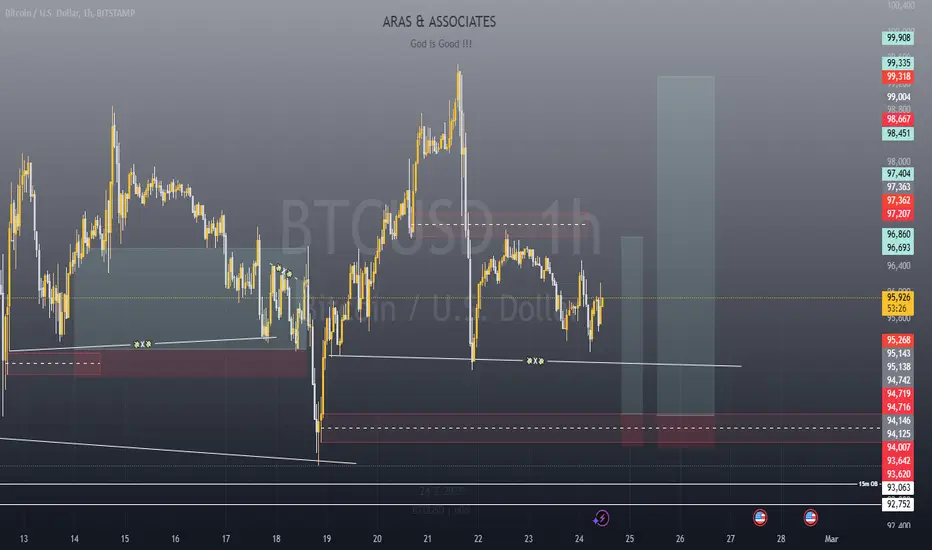
Rinse & Repeat !!!Hello everyone, a happy new trading week to you all !.
This setup is particularly a short-term buy for those looking to take advantage of BTC's range that has been refusing to take a side.
A good RRR trade that's sure to make you a bit of money. Use proper risk and money management (risk what you're willing to not get bothered by) and most especially, do your own analysis for extra confluence !.
GBP USD Trade Setup 4-Hour TimeframeOn the 4-hour timeframe, GBP USD has formed a bearish break and retest pattern, which aligns with the 0.50–0.618 Fibonacci retracement levels.
Clean 👌🏻🔥

NASDAQ100Are we going to see more crash on stock? If indeed the stocks are crashing, they really need to come up with some more excuses to dump the price quick. Because this week may be the last week we are down and aiming new highs. Use proper risk management. Lets Download Success.

GOLD NEXT TARGET A bearish outlook on gold suggests that prices are expected to decline over a period of time. This could be due to various factors, including a strong U.S. dollar, rising interest rates, or a lack of investor demand. When gold is bearish, it typically indicates a market sentiment where traders and investors believe that economic conditions or market forces are reducing gold’s value as a safe-haven asset. Traders might look for short-selling opportunities, aiming to profit from the potential decrease in gold prices.

GOLD OFTEN HOLDS or INCREASES its value in the long runGold has been valued for centuries, maintaining a reputation as a reliable investment, especially during economic uncertainty. While it doesn't literally go "up" every day, gold often holds or increases its value in the long run. This tutorial will explain why gold is considered a strong long-term asset, outline the forces that drive its price, and provide steps to begin investing in gold.

EUR JPY Trade Setup 4 Hour TimeframeOn the 4-hour timeframe, EUR JPY is pulling back for a retest of the broken resistance level, which has now turned into a new support level.
The pair continues to move in an uptrend, forming higher highs and higher lows while bouncing off a support trendline.
We will be looking for buy opportunities as the price tests this key support level.

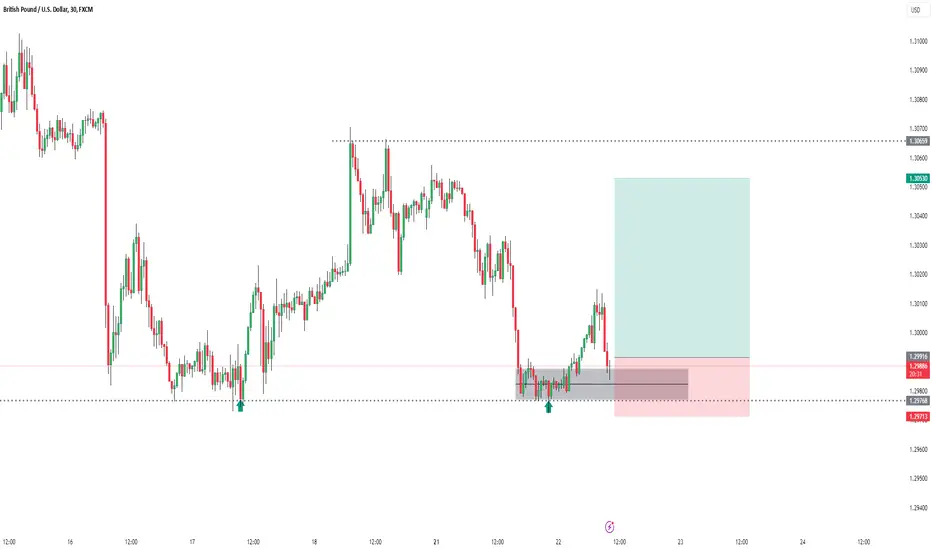
GBP USD Entry Setup 30 mins timeframe Now we wait for full confirmation from the level i marked out, if we don't get solid candlesticks confirmation from that level there will be no entry.
Stay waiting and stay patient.
NAS100I believe we reached our resistance zone, I would like to see, NASDAQ100 drop. Though, we likely gonna be stopped out due high manipulation today. US has Federal Funds Rates report. Otherwise we do what is best, we try. Use low lots and proper risk management. Lets DownloaD Success.

NASDAQ100US100 has been ranging since last week, I would like to see it drop before it rallies to new highs, though it is simple for nas100 to reach our SL because our entry is exposed and in sync with 97% of retail traders who sold simply because resistance zone, we are part of liquidity into this trade and market algo price machine is mostly likely to take us out.Use low lots and proper risk management. Lets Download Success

NASDAQ100US100 has been ranging since last week, I would like to see it drop before it rallies to new highs, though it is simple for nas100 to reach our SL because our entry is exposed and in sync with 97% of retail traders who sold simply because resistance zone, we are part of liquidity into this trade and market algo price machine is mostly likely to take us out.Use low lots and proper risk management. Lets Download Success

AUDUSDThe pair has been on bull for a while now, I think it has already started the bear trend, let us wait for a small retracement up, then we short, sniper entry or nothing, this is a swing trade, use proper risk management. Lets Download Success

GER30I would like to see Ger20 pull back up a little bit before it sells off. Sniper entries or nothing, remember to use proper risk management, entries will be taken after a pull back. Not now, you can use a pending order. Lets Download Success .

NASDAQ100US100 has been up since todays market open. I would like to see a significant drop from current price, as it has reached resistance zone, remember to use proper risk management, Lets Download Success.

GER30GER30 has been going up for a while now, I am interested seeing it drop, but before it drops, I will be happy to see a small retracement up, thats where we will be executing trades, sniper entry or nothing, Lets Download Succes s

NASDAQ100NASDAQ100 has been falling hard lately, we are going to trade a small bull move. Lets be patient and wait for retracement to our entry zone. Sniper entry or nothing. Use proper risk management. Lets Download Success.
