EURGBP FRGNT Daily Forecast -Q4 | W45 | D3| Y25 |📅 Q4 | W45 | D3| Y25 |
📊 EURGBP FRGNT Daily Forecast
🔍 Analysis Approach:
I’m applying Smart Money Concepts, focusing on:
Identifying Points of Interest on the Higher Time Frames (HTFs) 🕰️
Using those POIs to define a clear trading range 📐
Refining those zones on Lower Time Frames (LTFs) 🔎
Waiting for a Break of Structure (BoS) for confirmation ✅
This method allows me to stay precise, disciplined, and aligned with the market narrative, rather than chasing price.
💡 My Motto:
"Capital management, discipline, and consistency in your trading edge."
A positive risk-to-reward ratio, paired with a high win rate, is the backbone of any solid trading plan 📈🔐
⚠️ Losses?
They’re part of the mathematical game of trading 🎲
They don’t define you — they’re necessary, they happen, and we move forward 📊➡️
🙏 I appreciate you taking the time to review my Daily Forecast.
Stay sharp, stay consistent, and protect your capital
— FRNGT 🚀
FX:EURGBP
Gann

Case study : completing tasks ,both with and without the assistGeneral idea. For a new shore aimed at a specific market or sports is understand,be creative and give at least 10 idea
2) pick the best idea and explain why so that your boss and other manager can understand your think
3) describe a potential prototype shoe in vivib detail in one paragraph three to four sentencesd
4) come up with a list of step needed to launch the product be concise but comprehensive
5) come up with name for the product consider at least four name , write them down and explain the you picked
6)use your knowledge to segment the footwear Industry market by use keep it general and do not focus yet on you specific target and customer group
7) list the initial segment you might consider (do not consider more than three)
LIST the presumed needs of each of these segments explain you assessment
8) divide which segment is must important explain your assessment
10)come up with a marketing slogans of each of the segment your
11) suggest three way testing whether your marketing slogans work well with the customer you have identity

GBPUSD FRGNT Daily Forecast -Q4 | W45 | D3| Y25 |📅 Q4 | W45 | D3| Y25 |
📊 GBPUSD FRGNT Daily Forecast
🔍 Analysis Approach:
I’m applying Smart Money Concepts, focusing on:
Identifying Points of Interest on the Higher Time Frames (HTFs) 🕰️
Using those POIs to define a clear trading range 📐
Refining those zones on Lower Time Frames (LTFs) 🔎
Waiting for a Break of Structure (BoS) for confirmation ✅
This method allows me to stay precise, disciplined, and aligned with the market narrative, rather than chasing price.
💡 My Motto:
"Capital management, discipline, and consistency in your trading edge."
A positive risk-to-reward ratio, paired with a high win rate, is the backbone of any solid trading plan 📈🔐
⚠️ Losses?
They’re part of the mathematical game of trading 🎲
They don’t define you — they’re necessary, they happen, and we move forward 📊➡️
🙏 I appreciate you taking the time to review my Daily Forecast.
Stay sharp, stay consistent, and protect your capital
— FRNGT 🚀
FX:GBPUSD

AUDUSD FRGNT Daily Forecast -Q4 | W45 | D3| Y25 |📅 Q4 | W45 | D3| Y25 |
📊 AUDUSD FRGNT Daily Forecast
🔍 Analysis Approach:
I’m applying Smart Money Concepts, focusing on:
Identifying Points of Interest on the Higher Time Frames (HTFs) 🕰️
Using those POIs to define a clear trading range 📐
Refining those zones on Lower Time Frames (LTFs) 🔎
Waiting for a Break of Structure (BoS) for confirmation ✅
This method allows me to stay precise, disciplined, and aligned with the market narrative, rather than chasing price.
💡 My Motto:
"Capital management, discipline, and consistency in your trading edge."
A positive risk-to-reward ratio, paired with a high win rate, is the backbone of any solid trading plan 📈🔐
⚠️ Losses?
They’re part of the mathematical game of trading 🎲
They don’t define you — they’re necessary, they happen, and we move forward 📊➡️
🙏 I appreciate you taking the time to review my Daily Forecast.
Stay sharp, stay consistent, and protect your capital
— FRNGT 🚀
OANDA:AUDUSD

EURUSD FRGNT Daily Forecast -Q4 | W45 | D3| Y25 |📅 Q4 | W45 | D3| Y25 |
📊 EURUSD FRGNT Daily Forecast
🔍 Analysis Approach:
I’m applying Smart Money Concepts, focusing on:
Identifying Points of Interest on the Higher Time Frames (HTFs) 🕰️
Using those POIs to define a clear trading range 📐
Refining those zones on Lower Time Frames (LTFs) 🔎
Waiting for a Break of Structure (BoS) for confirmation ✅
This method allows me to stay precise, disciplined, and aligned with the market narrative, rather than chasing price.
💡 My Motto:
"Capital management, discipline, and consistency in your trading edge."
A positive risk-to-reward ratio, paired with a high win rate, is the backbone of any solid trading plan 📈🔐
⚠️ Losses?
They’re part of the mathematical game of trading 🎲
They don’t define you — they’re necessary, they happen, and we move forward 📊➡️
🙏 I appreciate you taking the time to review my Daily Forecast.
Stay sharp, stay consistent, and protect your capital
— FRNGT 🚀
OANDA:EURUSD

DXY FRGNT Daily Forecast -Q4 | W45 | D3| Y25 |📅 Q4 | W45 | D3| Y25 |
📊 DXY FRGNT Daily Forecast
🔍 Analysis Approach:
I’m applying Smart Money Concepts, focusing on:
Identifying Points of Interest on the Higher Time Frames (HTFs) 🕰️
Using those POIs to define a clear trading range 📐
Refining those zones on Lower Time Frames (LTFs) 🔎
Waiting for a Break of Structure (BoS) for confirmation ✅
This method allows me to stay precise, disciplined, and aligned with the market narrative, rather than chasing price.
💡 My Motto:
"Capital management, discipline, and consistency in your trading edge."
A positive risk-to-reward ratio, paired with a high win rate, is the backbone of any solid trading plan 📈🔐
⚠️ Losses?
They’re part of the mathematical game of trading 🎲
They don’t define you — they’re necessary, they happen, and we move forward 📊➡️
🙏 I appreciate you taking the time to review my Daily Forecast.
Stay sharp, stay consistent, and protect your capital
— FRNGT 🚀
TVC:DXY

Part 2 Support and Resistance Key Terms in Option Trading
Before diving deeper, it’s important to understand some key terms:
Underlying Asset: The financial asset on which the option is based (e.g., Nifty, Bank Nifty, Reliance Industries stock).
Strike Price: The fixed price at which the holder can buy or sell the underlying asset.
Expiry Date: The date when the option contract expires.
Premium: The price paid by the buyer to the seller (writer) of the option.
Lot Size: The minimum quantity of the underlying asset in one option contract.
In-the-Money (ITM): When exercising the option is profitable.
Out-of-the-Money (OTM): When exercising the option is not profitable.
At-the-Money (ATM): When the strike price is equal (or close) to the current market price of the underlying asset.

Successful Forex Trading1. Understanding the Forex Market
The forex market operates 24 hours a day, five days a week, across major financial centers like London, New York, Tokyo, and Sydney. Currencies are traded in pairs such as EUR/USD, GBP/JPY, or USD/INR, where one currency is bought while the other is sold.
Forex prices fluctuate due to various factors—economic indicators, geopolitical events, interest rate changes, and global demand for currencies. A successful trader understands that the forex market is influenced by both technical and fundamental dynamics.
2. The Foundation: Education and Knowledge
Knowledge is the backbone of successful forex trading. Before risking money, traders must learn how the market works, understand price action, and study trading tools. Beginners should grasp basic concepts such as:
Pips and lots: The smallest unit of price movement and standard trade size.
Leverage and margin: Borrowed capital that amplifies both profits and losses.
Bid-ask spread: The difference between the buying and selling price.
Stop-loss and take-profit: Tools to manage risk and lock in gains.
Reading books, taking courses, and following reliable market news sources like Bloomberg or Reuters can help traders stay informed. Continuous learning is vital, as market conditions and trading technologies evolve rapidly.
3. Developing a Solid Trading Strategy
A well-defined trading strategy is what separates successful traders from impulsive gamblers. Strategies can be short-term (scalping, day trading) or long-term (swing trading, position trading). Some of the popular trading strategies include:
Trend following – Identifying and trading in the direction of the market’s momentum.
Breakout trading – Entering trades when price moves beyond key resistance or support levels.
Range trading – Buying at support and selling at resistance during sideways markets.
News trading – Capitalizing on price volatility during major economic releases.
A successful trader tests strategies through backtesting (using historical data) and demo trading (using virtual money). This builds confidence before risking real funds.
4. Mastering Technical Analysis
Technical analysis helps traders forecast future price movements based on historical data. It involves studying charts, patterns, and indicators. Commonly used tools include:
Moving Averages (MA): To identify trends and smooth price fluctuations.
Relative Strength Index (RSI): To detect overbought or oversold market conditions.
Fibonacci Retracements: To identify potential reversal levels.
Candlestick Patterns: To reveal market sentiment through price behavior.
Technical analysis is most effective when combined with risk management and market psychology, rather than used in isolation.
5. Importance of Fundamental Analysis
While technical analysis focuses on charts, fundamental analysis examines the economic and political forces behind currency movements. Key indicators include:
Interest rates – Currencies with higher interest rates tend to attract more investors.
Inflation and GDP data – Indicate economic health and purchasing power.
Employment reports – Such as U.S. Non-Farm Payrolls, which can cause sharp volatility.
Geopolitical stability – Political crises can weaken a nation’s currency.
Successful traders often blend both technical and fundamental analysis to make informed trading decisions.
6. Risk Management: Protecting Capital
No matter how skilled a trader is, losses are inevitable. The key is to control risk so one bad trade doesn’t wipe out the account. Effective risk management includes:
Position sizing – Risking only 1–2% of trading capital per trade.
Stop-loss orders – Automatically closing trades at a predetermined loss level.
Diversification – Avoiding concentration in a single currency pair.
Avoiding over-leverage – High leverage amplifies both gains and losses.
Successful forex traders focus more on capital preservation than on quick profits. As the saying goes, “Take care of your losses, and profits will take care of themselves.”
7. The Psychology of Trading
Emotions are a trader’s biggest enemy. Fear and greed often lead to irrational decisions, like exiting trades too early or chasing losing positions. To succeed, traders must cultivate:
Discipline: Stick to the trading plan and rules consistently.
Patience: Wait for high-probability setups rather than forcing trades.
Confidence: Trust in analysis and avoid self-doubt after losses.
Emotional control: Accept losses as part of the process.
Maintaining a trading journal helps track performance, recognize emotional triggers, and improve over time.
8. Using Technology and Trading Tools
In today’s digital era, technology plays a massive role in forex trading success. Platforms like MetaTrader 4/5, cTrader, or TradingView offer real-time data, charting tools, and automated trading options.
Successful traders also use:
Economic calendars to track important news events.
Algorithmic trading systems for consistent execution.
VPS hosting to reduce latency for automated strategies.
Staying updated with fintech innovations gives traders a competitive edge in execution speed and market insight.
9. Continuous Improvement and Adaptation
The forex market is dynamic—strategies that worked yesterday may not work tomorrow. Therefore, traders must constantly adapt. Successful forex traders regularly:
Review past trades to learn from mistakes.
Refine strategies based on changing volatility or trends.
Stay updated on global economic developments.
Seek mentorship or community support to exchange insights.
Flexibility and adaptability ensure that traders survive both bullish and bearish cycles.
10. Building Long-Term Success
Successful forex trading is not about overnight riches—it’s about consistency, patience, and growth. The most successful traders:
Focus on steady returns rather than big wins.
Maintain discipline in both winning and losing streaks.
Keep records of all trades for analysis.
Continue to learn, adapt, and evolve with the market.
They treat trading as a business, not a hobby—an enterprise requiring planning, analysis, and emotional balance.
Conclusion
Success in forex trading is a journey that combines knowledge, discipline, strategy, and self-control. It’s not about predicting every market move but about managing risks and maximizing opportunities. A trader who focuses on education, follows a tested strategy, controls emotions, and practices sound risk management can thrive in the volatile world of forex.
The essence of successful forex trading lies in one rule: “Trade smart, not hard.” With persistence, patience, and proper planning, anyone can achieve consistent profitability and long-term success in the global forex market.

XAUUSD - Spot Gold Weekly
Reversal bar follow thru to support at a midpoint of structure.
One lower low…. (Does not make a trend)
Bias has narrowed to 4.0846/1 Buyers
*monitoring for pullback trade variants
*Noting lower time frames for directional bias

Im looking for buy setups.Those who are passionate about trading understand that it’s a tough business. What you must realize is that every market prediction—every call on price direction—is based on probabilities. There is no such thing as a 100% guaranteed outcome. The market can move against you at any time, for any reason. It might be triggered by geopolitical news, changes in oil production, a sudden war, or any number of unpredictable factors that can influence financial markets.
If you have one or more solid reasons to believe that the price will move in a certain direction, your job is to take a small, calculated position with a good risk-to-reward ratio—and then let the market decide.
A trader’s bias—whether bullish or bearish—can come from various sources: technical analysis, fundamental data, past price behavior, or simply well-observed market patterns. What matters most is understanding that the market is constantly evolving. Yesterday’s analysis may no longer apply today.
Remember, the market doesn’t have to follow your analysis. You have to follow the market—observe its shifts, adapt to its changes, and respond accordingly.
I hope this perspective helps some of you on your trading journey. Good luck!

Kellton Tech Solutions CMP 22.00Kellton Tech Solutions CMP 22.00
>Penny Stock
>PAT increasing
>Order book as on Q3 FY24 stood at 800 Cr
they offers services in digital transformation, ERP and other IT services. It has operations across US, Europe, India and Asia-Pacific with a team of ~1,800 employees.

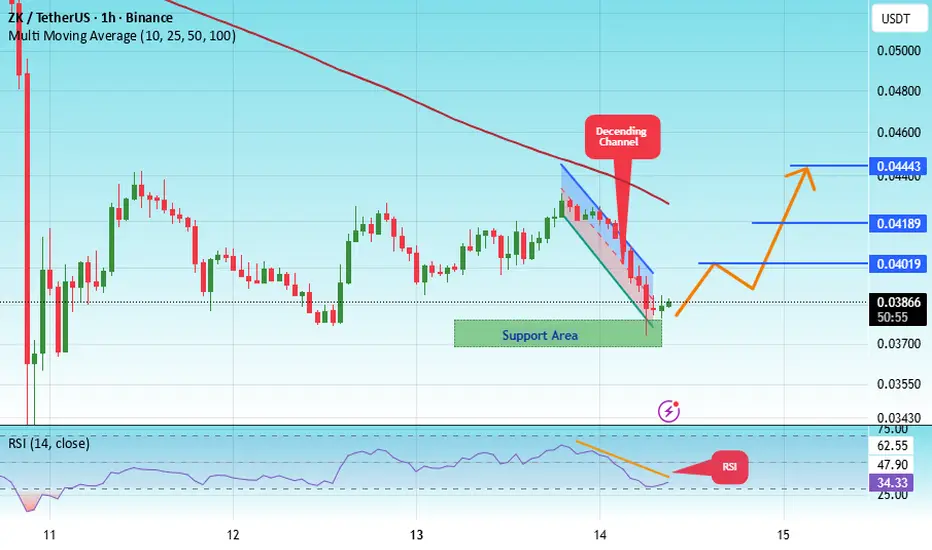
#ZK/USDT — Descending Triangle Key Support, Breakout or Breakd#ZK
The price is moving within a descending channel on the 1-hour frame, adhering well to it, and is heading for a strong breakout and retest.
We have a bearish trend on the RSI indicator that is about to be broken and retested, which supports the upward breakout.
There is a major support area in green at 0.03736, which represents a strong support point.
We are heading for consolidation above the 100 moving average.
Entry price: 0.03853
First target: 0.04019
Second target: 0.04189
Third target: 0.004443
Don't forget a simple matter: capital management.
When you reach the first target, save some money and then change your stop-loss order to an entry order.
For inquiries, please leave a comment.
Thank you.
XAUUSD📊 GOLD (XAUUSD) – Multi-Timeframe Technical Outlook
Monthly:
Gold closed the last monthly candle bullish, even with a long upper wick.
✅ Buyers are still in control
⚠️ But the wick shows loss of momentum at the top
✅ Weekly Timeframe
Price broke out of a symmetric triangle, and for 9 consecutive weeks, gold pushed aggressively to the upside.
However, the last two weekly candles show:
smaller bodies
longer wicks
loss of momentum
📉 If this correction continues, price may come back down to retest the broken triangle around the 3,500 zone.
This retest would collect liquidity and give the market structure needed to build a new leg toward the 5,000 long-term target.
✅ Daily Timeframe
Recent high near 4,400
Price dropped to 4,000 → new low
Pullback to 4,150 → Lower High
Deeper drop to 3,886 → new lower low
Bounce up to 4,046 → another Lower High
🔻 Conclusion on D1:
The daily structure is bearish with a clear sequence of Lower Highs, showing loss of bullish strength.
✅ H4 Timeframe
On H4, price is currently forming a bearish flag pattern — slow, corrective movement after the drop.
If price breaks below the flag, that would open the door for another leg down, targeting:
3,900
3,750
and possibly the 3,500 weekly retest zone
📌 Summary
Monthly → bullish but losing steam
Weekly → breakout confirmed, but correction likely before continuation
Daily → bearish market structure
H4 → bearish flag building momentum for another drop
If the flag breaks down, the next major liquidity zone sits around 3,500 — the same zone as the symmetric triangle retest.
🔥 Bias: Bearish short-term
🚀 Long-term: Bullish continuation toward 5,000 after deeper correction

Eth Weekly Key SupportEth weekly candles currently have support of the Gann 1x2 fib ray and 78.60% fib
If Monday's candle can open above these supports then we can expect a price rally eventually reaching the top of the chart at around $6k
Breaking of ascending support would see a drop looking for next support at $2.8k-$3k
Opening of the next weekly candle will show direction

Bearish Continuation AnalysisFor this following week let's analyze what possible outcomes we may face.
First and foremost, the trend is your friend. We can see that, combined with recent news, bears are in full control. After breaking out, and closing bearish, of the consolidation channel (white) we would prefer to look for a retest and liquidity sweep between 1.155 and 1.157 area. With a proper confirmation to the downside we can enter for a short position and target the FVG, possibly taking profits near the 1.14 level.
Respecting the trendline (green), confirmed by 3 taps, we can also expect a retracement back to the same trendline and see how market will react. Expectations are that it will continue bearish but only time will tell when we reach that area. If that's the case I will be keeping my eye for possibilities of a short between 1.156 and 1.16.
We are in an area where there is high demand as well. Let's keep our eyes open for hints of reversals. Set your triggers and lets have a good week.

AAVE USDT LONG SIGNAL---
📢 Signal Alert
🔹 Pair: AAVE / USDT
📈 Trade Type: Long
💰 Entry: 222.40
🎯 Targets (Take Profits):
TP1 = 224.65
TP2 = 226.80
TP3 = 228.50
TP4 = 231.90
🛑 Stop-Loss: 221.00
📊 Timeframe: 1H
⚖️ Risk/Reward Ratio: 6.85
📌 Suggested Leverage: 5x – 10x
---
🧠 Technical Analysis
AAVE is showing bullish continuation signals after consolidating near the 221 support area.
The price has bounced from support and is forming a higher low pattern.
RSI is turning upward and remains above the midline, showing growing bullish momentum.
Entry at 222.40 offers a favorable low-risk, high-reward setup.
Stop-Loss at 221.00 is set below the nearest swing low to manage risk efficiently.
⚠️ Confirm entry with a bullish 1H candle close or breakout of minor resistance. Consider partial profit-taking at TP1 and TP2, while holding remaining positions toward TP3 and TP4

EURGBP FRGNT Weekly Forecast -Q4 | W45 | Y25 |📅 Q4 | W45 | Y25 |
📊 EURGBP FRGNT Weekly Forecast
🔍 Analysis Approach:
I’m applying Smart Money Concepts, focusing on:
Identifying Points of Interest on the Higher Time Frames (HTFs) 🕰️
Using those POIs to define a clear trading range 📐
Refining those zones on Lower Time Frames (LTFs) 🔎
Waiting for a Break of Structure (BoS) for confirmation ✅
This method allows me to stay precise, disciplined, and aligned with the market narrative, rather than chasing price.
💡 My Motto:
"Capital management, discipline, and consistency in your trading edge."
A positive risk-to-reward ratio, paired with a high win rate, is the backbone of any solid trading plan 📈🔐
⚠️ Losses?
They’re part of the mathematical game of trading 🎲
They don’t define you — they’re necessary, they happen, and we move forward 📊➡️
🙏 I appreciate you taking the time to review my Daily Forecast.
Stay sharp, stay consistent, and protect your capital
— FRNGT 🚀
FX:EURGBP

GBPUSD FRGNT Weekly Forecast - Q4 | W45 | Y25 |📅 Q4 | W45 | Y25 |
📊 GBPUSD FRGNT Weekly Forecast
🔍 Analysis Approach:
I’m applying Smart Money Concepts, focusing on:
Identifying Points of Interest on the Higher Time Frames (HTFs) 🕰️
Using those POIs to define a clear trading range 📐
Refining those zones on Lower Time Frames (LTFs) 🔎
Waiting for a Break of Structure (BoS) for confirmation ✅
This method allows me to stay precise, disciplined, and aligned with the market narrative, rather than chasing price.
💡 My Motto:
"Capital management, discipline, and consistency in your trading edge."
A positive risk-to-reward ratio, paired with a high win rate, is the backbone of any solid trading plan 📈🔐
⚠️ Losses?
They’re part of the mathematical game of trading 🎲
They don’t define you — they’re necessary, they happen, and we move forward 📊➡️
🙏 I appreciate you taking the time to review my Daily Forecast.
Stay sharp, stay consistent, and protect your capital
— FRNGT 🚀
FX:GBPUSD

AUDUSD FRGNT Weekly Forecast -Q4 | W45 | Y25 |📅 Q4 | W45 | Y25 |
📊 AUDUSD FRGNT Weekly Forecast
🔍 Analysis Approach:
I’m applying Smart Money Concepts, focusing on:
Identifying Points of Interest on the Higher Time Frames (HTFs) 🕰️
Using those POIs to define a clear trading range 📐
Refining those zones on Lower Time Frames (LTFs) 🔎
Waiting for a Break of Structure (BoS) for confirmation ✅
This method allows me to stay precise, disciplined, and aligned with the market narrative, rather than chasing price.
💡 My Motto:
"Capital management, discipline, and consistency in your trading edge."
A positive risk-to-reward ratio, paired with a high win rate, is the backbone of any solid trading plan 📈🔐
⚠️ Losses?
They’re part of the mathematical game of trading 🎲
They don’t define you — they’re necessary, they happen, and we move forward 📊➡️
🙏 I appreciate you taking the time to review my Daily Forecast.
Stay sharp, stay consistent, and protect your capital
— FRNGT 🚀
OANDA:AUDUSD

EURUSD FRGNT Weekly Forecast -Q4 | W45 | Y25 |📅 Q4 | W45 | Y25 |
📊 EURUSD FRGNT Weekly Forecast
🔍 Analysis Approach:
I’m applying Smart Money Concepts, focusing on:
Identifying Points of Interest on the Higher Time Frames (HTFs) 🕰️
Using those POIs to define a clear trading range 📐
Refining those zones on Lower Time Frames (LTFs) 🔎
Waiting for a Break of Structure (BoS) for confirmation ✅
This method allows me to stay precise, disciplined, and aligned with the market narrative, rather than chasing price.
💡 My Motto:
"Capital management, discipline, and consistency in your trading edge."
A positive risk-to-reward ratio, paired with a high win rate, is the backbone of any solid trading plan 📈🔐
⚠️ Losses?
They’re part of the mathematical game of trading 🎲
They don’t define you — they’re necessary, they happen, and we move forward 📊➡️
🙏 I appreciate you taking the time to review my Daily Forecast.
Stay sharp, stay consistent, and protect your capital
— FRNGT 🚀
OANDA:EURUSD

VET USDT LONG SIGNAL---
📢 Signal Alert
🔹 Pair: VET / USDT
📈 Trade Type: Long
💰 Entry Zone: 0.015981
🎯 Targets (Take Profits):
TP1 = 0.016480
TP2 = 0.016794
TP3 = 0.017200
🛑 Stop-Loss: 0.015680
📊 Timeframe: 1H
⚖️ Risk/Reward Ratio: 4
📌 Suggested Leverage: 5x – 10x
---
🧠 Technical Analysis
VET is showing signs of a bullish reversal after testing the 0.015680 support zone.
Higher low formation indicates buyers are stepping back in.
RSI is turning upward from oversold levels and bullish volume is increasing.
Entry Zone (0.015981) is just above the local support, providing a low-risk, high-reward setup.
Stop-Loss at 0.015680 is placed below the last swing low.
⚠️ Confirm entry with a bullish candle close or breakout of minor resistance. Partial profit-taking is recommended at TP1 and TP2.
---

AVAX USDT LONG SIGNAL 📢 Signal Alert
🔹 Pair: AVAX / USDT
📈 Trade Type: Long
💰 Entry Zone: 18.355 – 18.565
🎯 Targets (Take Profits):
TP1 = 18.830
TP2 = 19.225
TP3 = 19.500
🛑 Stop-Loss: 18.265
📊 Timeframe: 1H
⚖️ Risk/Reward Ratio: 2.17
📌 Suggested Leverage: 5x – 10x
---
🧠 Technical Analysis
AVAX is showing signs of a bullish reversal after testing the 18.265 support zone.
Higher low formation indicates buyers are stepping back in.
RSI is turning upward from near-oversold levels and bullish volume is increasing.
Entry Zone (18.355 – 18.565) is just above local support, providing a low-risk, high-reward setup.
Stop-Loss at 18.265 is placed below the last swing low.
⚠️ Confirm entry with a bullish candle close or breakout of minor resistance. Partial profit-taking is recommended at TP1 and TP2.

TRX USDT LONG SIGNAL---
📢 Signal Alert
🔹 Pair: TRX / USDT
📈 Trade Type: Long
💰 Entry Zone: 0.29442 – 0.29639
🎯 Targets (Take Profits):
TP1 = 0.29935
TP2 = 0.30178
TP3 = 0.30507
🛑 Stop-Loss: 0.29278
📊 Timeframe: 1H
⚖️ Risk/Reward Ratio: 2.50
📌 Suggested Leverage: 10x
---
🧠 Technical Analysis Explanation
TRX is currently showing signs of a bullish reversal after testing the 0.2927–0.2944 support zone.
The price has formed a higher low, signaling buyers stepping in.
RSI is moving up from oversold territory and bullish volume is increasing, suggesting growing buying pressure.
The Entry Zone (0.29442 – 0.29639) is just above the local support, providing a low-risk, high-reward setup.
Targets are aligned with nearby resistance levels and short-term supply zones.
Stop-Loss is placed at 0.29278 to protect against false breakdowns.
⚠️ Note: Confirm entry with a bullish candle close or minor resistance breakout. Actively manage your position — consider taking partial profits at TP1 and TP2.
---
