4/29 Gold Trading SignalsThe buy orders initiated around 3273 yesterday have already delivered solid profits.
After a slight rally at today’s opening, gold prices have pulled back.
Currently, the candlestick formation shows no clear directional trend, while some short-term technical indicators are pointing downward.
Before any corrective signals appear, we need to closely watch the support near 3306.
As long as this level holds, the short-term bullish momentum still has a chance to continue.
On the news side, today's scheduled data releases are of minor impact.
Focus instead on developments regarding the India-Pakistan situation and US Treasury Secretary Bessent’s press conference.
If geopolitical tensions escalate, gold may break out to new highs.
🔹 Today's Trading Strategy:
Sell within 3407-3428 zone
Buy within 3258-3223 zone
Flexibly trade between 3346-3313 / 3378-3336 / 3273-3316 zones
Please manage your positions carefully and stay alert for unexpected market moves.
Gann

#HBAR/USDT#HBAR
The price is moving within a descending channel on the 1-hour frame, adhering well to it, and is heading for a strong breakout and retest.
We are seeing a bounce from the lower boundary of the descending channel, which is support at 0.1870.
We have a downtrend on the RSI indicator that is about to be broken and retested, supporting the upward trend.
We are looking for stability above the 100 Moving Average.
Entry price: 0.19000
First target: 0.1935
Second target: 0.1970
Third target: 0.2001

#GRT/USDT#GRT
The price is moving within a descending channel on the 1-hour frame, adhering well to it, and is on its way to breaking it strongly upwards and retesting it.
We are seeing a bounce from the lower boundary of the descending channel, which is support at 0.0956.
We have a downtrend on the RSI indicator that is about to break and retest, supporting the upward trend.
We are looking for stability above the 100 moving average.
Entry price: 0.1010
First target: 0.1033
Second target: 0.1065
Third target: 0.1110

#SNX/USDT#SNX
The price is moving within a descending channel on the 1-hour frame, adhering well to it, and is heading for a strong breakout and retest.
We are seeing a bounce from the lower boundary of the descending channel, which is support at 0.711.
We are seeing a downtrend on the RSI indicator that is about to break and retest, supporting the upward trend.
We are looking for stability above the 100 Moving Average.
Entry price: 0.744
First target: 0.765
Second target: 0.785
Third target: 0.811

#QUICK/USDT#QUICK
The price is moving within a descending channel on the 1-hour frame, adhering well to it, and is heading for a strong breakout and retest.
We are seeing a bounce from the lower boundary of the descending channel. This support is at 0.02317.
We have a downtrend on the RSI indicator that is about to be broken and retested, supporting the upward trend.
We are looking for stability above the 100 Moving Average.
Entry price: 0.02446
First target: 0.02546
Second target: 0.02673
Third target: 0.02820

FIBO Retracement + GANN SQ 9+ TrendlineThe green horizontal line at 506.55 had been an important support level that was broken on 6th February 2025. Fibo Retracement from 557 to 286.40 provides important levels to look for . The GANN Sq 9 also provides the support and resistance levels to note.

BTC/USD Price Action Update – April 29, 2025📊BTC/USD Price Action Update – April 29, 2025
🔹Current Price: 94,371.51
🔹Timeframe: 1H
📌Key Supply Zone (Resistance):
🔴95,781.91 – Major Resistance (previous swing high)
📌Key Demand Zone (Support):
🟢91,711–92,122 – Strong Demand Zone (major bullish origin area)
📈Bullish Outlook:
Price is consolidating between resistance and demand. If BTC holds above 94,000 and builds bullish momentum, we could see a retest of the 95,781 high. Breakout above 95,781 may trigger further upside.
📉Bearish Outlook:
Failure to hold 94,000 could lead to a drop toward the 91,711–92,122 demand zone. Watch for reaction at demand to find potential reversal opportunities.
⚡Trade Setup Tip:
✅Wait for clean break and retest above 94,500 for bullish continuation
✅Look for longs at 91,711–92,122 with confirmation
✅Use stop-loss carefully to protect against sharp moves
#BTCUSD #BitcoinAnalysis #CryptoTrading #SmartMoneyConcepts #PriceAction #FXFOREVER #CryptoUpdate #SupplyAndDemand #BreakOfStructure #MarketUpdate

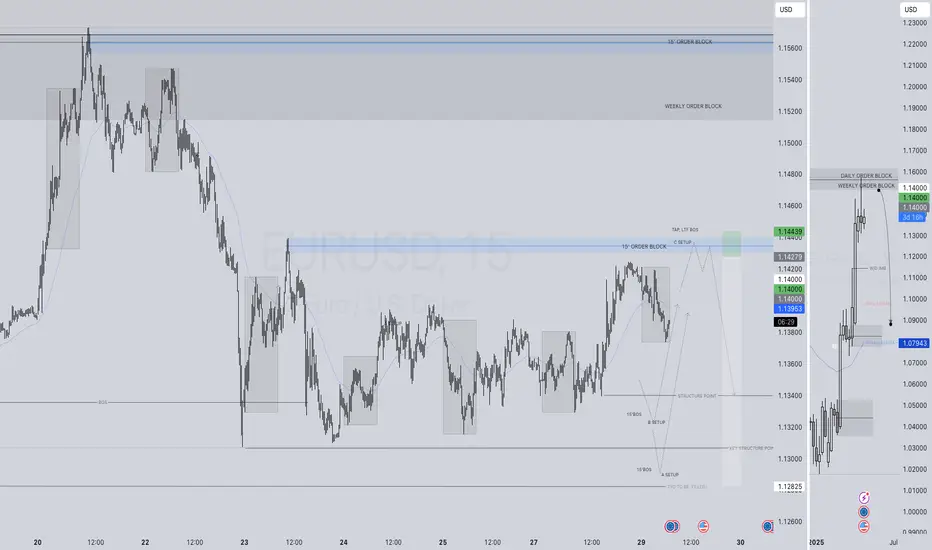
EURUSD SHORT FORECAST Q2 W18 D29 Y25
EURUSD SHORT FORECAST Q2 W18 D29 Y25
Professional Risk Managers👋
Welcome back to another FRGNT chart update📈
Diving into some Forex setups using predominantly higher time frame order blocks alongside confirmation breaks of structure.
Let’s see what price action is telling us today!
💡Here are some trade confluences📝
✅Weekly order block rejection
✅Daily order block rejection
✅Intraday 15' order block
✅Tokyo ranges to be filled
🔑 Remember, to participate in trading comes always with a degree of risk, therefore as professional risk managers it remains vital that we stick to our risk management plan as well as our trading strategies.
📈The rest, we leave to the balance of probabilities.
💡Fail to plan. Plan to fail.
🏆It has always been that simple.
❤️Good luck with your trading journey, I shall see you at the very top.
🎯Trade consistent, FRGNT X
AUDUSD SHORT FORECAST Q2 W18 D29 Y25AUDUSD SHORT FORECAST Q2 W18 D29 Y25
Professional Risk Managers👋
Welcome back to another FRGNT chart update📈
Diving into some Forex setups using predominantly higher time frame order blocks alongside confirmation breaks of structure.
Let’s see what price action is telling us today!
💡Here are some trade confluences📝
✅Weekly 50 EMA
✅Intraday 15' order block
✅Tokyo ranges to be filled
✅Intraday 15' order block trading levels
🔑 Remember, to participate in trading comes always with a degree of risk, therefore as professional risk managers it remains vital that we stick to our risk management plan as well as our trading strategies.
📈The rest, we leave to the balance of probabilities.
💡Fail to plan. Plan to fail.
🏆It has always been that simple.
❤️Good luck with your trading journey, I shall see you at the very top.
🎯Trade consistent, FRGNT X

EURUSD I Weekly CLS I KL - OB, Model 1 target - 50% AMD in playHey, Market Warriors, here is another outlook on this instrument
If you’ve been following me, you already know every setup you see is built around a CLS range, a Key Level, Liquidity and a specific execution model.
If you haven't followed me yet, start now.
My trading system is completely mechanical — designed to remove emotions, opinions, and impulsive decisions. No messy diagonal lines. No random drawings. Just clarity, structure, and execution.
🧩 What is CLS?
CLS is real smart money — the combined power of major investment banks and central banks moving over 6.5 trillion dollars a day. Understanding their operations is key to markets.
✅ Understanding the behaviour of CLS allows you to position yourself with the giants during the market manipulations — leading to buying lows and selling highs - cleaner entries, clearer exits, and consistent profits.
🛡️ Models 1 and 2:
From my posts, you can learn two core execution models.
They are the backbone of how I trade and how my students are trained.
📍 Model 1
is right after the manipulation of the CLS candle when CIOD occurs, and we are targeting 50% of the CLS range. H4 CLS ranges supported by HTF go straight to the opposing range.
📍 Model 2
occurs in the specific market sequence when CLS smart money needs to re-accumulate more positions, and we are looking to find a key level around 61.8 fib retracement and target the opposing side of the range.
👍 Hit like if you find this analysis helpful, and don't hesitate to comment with your opinions, charts or any questions.
⚔️ Listen Carefully:
Analysis is not trading. Right now, this platform is full of gurus" trying to sell you dreams based on analysis with arrows while they don't even have the skill to trade themselves.
If you’re ever thinking about buying a Trading Course or Signals from anyone. Always demand a verified track record. It takes less than five minutes to connect 3rd third-party verification tool and link to the widget to his signature.
"Adapt what is useful, reject what is useless, and add what is specifically your own."
— David Perk aka Dave FX Hunter ⚔️

AUDCAD SHORT FORECAST Q2 W18 D29 Y25AUDCAD SHORT FORECAST Q2 W18 D29 Y25
Professional Risk Managers👋
Welcome back to another FRGNT chart update📈
Diving into some Forex setups using predominantly higher time frame order blocks alongside confirmation breaks of structure.
Let’s see what price action is telling us today!
💡Here are some trade confluences📝
✅Daily 50 EMA
✅Intraday 15' order block to be created
✅Tokyo ranges to be filled
✅Intraday bearish breaks of structure to be confirmed
🔑 Remember, to participate in trading comes always with a degree of risk, therefore as professional risk managers it remains vital that we stick to our risk management plan as well as our trading strategies.
📈The rest, we leave to the balance of probabilities.
💡Fail to plan. Plan to fail.
🏆It has always been that simple.
❤️Good luck with your trading journey, I shall see you at the very top.
🎯Trade consistent, FRGNT X

EURGBP SHORT FORECAST Q2 W18 D29 Y25EURGBP SHORT FORECAST Q2 W18 D29 Y25
Professional Risk Managers👋
Welcome back to another FRGNT chart update📈
Diving into some Forex setups using predominantly higher time frame order blocks alongside confirmation breaks of structure.
Let’s see what price action is telling us today!
💡Here are some trade confluences📝
✅Weekly order block
✅5' order blockS
✅Intraday bearish breaks of structure
✅Tokyo ranges to be filled
🔑 Remember, to participate in trading comes always with a degree of risk, therefore as professional risk managers it remains vital that we stick to our risk management plan as well as our trading strategies.
📈The rest, we leave to the balance of probabilities.
💡Fail to plan. Plan to fail.
🏆It has always been that simple.
❤️Good luck with your trading journey, I shall see you at the very top.
🎯Trade consistent, FRGNT X

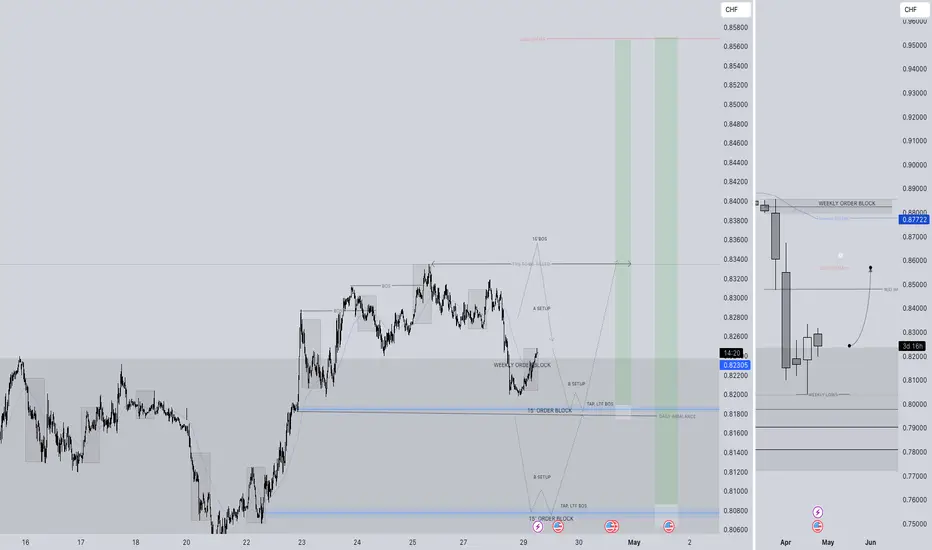
USDCHF LONG FORECAST Q2 W18 D29 Y25USDCHF LONG FORECAST Q2 W18 D29 Y25
Professional Risk Managers👋
Welcome back to another FRGNT chart update📈
Diving into some Forex setups using predominantly higher time frame order blocks alongside confirmation breaks of structure.
Let’s see what price action is telling us today!
💡Here are some trade confluences📝
✅Weekly order block rejection
✅Daily order block rejection
✅15’ order block
✅Intraday bullish breaks of structure
🔑 Remember, to participate in trading comes always with a degree of risk, therefore as professional risk managers it remains vital that we stick to our risk management plan as well as our trading strategies.
📈The rest, we leave to the balance of probabilities.
💡Fail to plan. Plan to fail.
🏆It has always been that simple.
❤️Good luck with your trading journey, I shall see you at the very top.
🎯Trade consistent, FRGNT X
USDCHFUSDCHF
- Extreme POI
- Break of Structure
- Completed " 12345 " Impulsive Waves and " A " Corrective Waves
- Demand Zone
- Rising Wedge as an corrective pattern in Short Time Frame


GBPUSD short movePrice raised to a very strong resistance level, reacted bearishly and hence i expect downward move in price.

USDZAR-BUY strategy 3 hourly chart GANNYesterday I underestimated the downside potential, and now we are below 18.5500 trend line, which does not bode well. However, we have a low RSI and other indicators, and even though pressure seems downward, I think we may have a change to recover to 18.7000 again.
Strategy BUY @ 18.4750-18.5100 and take profit near 18.6875.

S&P 500 ... ES1! ... SPY... a Gann review from 2000Basically performed another Gann Box copy-n-Stack technique and have aligned everything exactly on the daily and then switched to the 4hr
Some interesting levels occur and seems like that gap fill at 5566.25 or so or possible run to 5600 would be in the cards...but a lot of levels are smashing all together.
Make sure to expand the chart by using you mouse along the bottom of the scale, pull it left to expand or right to shrink....
Make sure to also click in the bottom right corner, hover you mouse over where price meets the date on the scale and click the "L" Log function to see if anything else comes up that different from my yellow "attention getting" marks.
Well....that's about all I got for doodles for tonight....enjoy.
weekly view to see the stacking and the duration of this run since 2000..thats quick high up eh??
1 hr view with gap highlighted:
5min close up with lower gap highlighted....so green path if good earnings week/economic data, or red path which trends to that gap fill...the choice is the investor's

EURUSDWeekly tf is bullish
Daily it's in an uptrend
H4 broke outside of a consolidation to the upside
H1, we will revisit 1.14 to keep pushing to the upside.

Crypto Total Market Cap Status -- #TOTALSooner or later, #TOTAL will reach the 3 trillion level, as indicators have passed the danger zone daily and weekly.
But be careful: At this particular number, it will face fierce resistance and will only be breached with a strong bullish candle!
🔹 Therefore:
** The momentary speculator must pay attention to this level and set a stop-loss.
** The swing investor must also set a stop-loss in anticipation of any sudden, sharp decline.
** As for the long-term investor, who entered a full price cycle, #Bitcoin has not yet completed its time cycle. So continue and don't fear :)
💬 Note on the fly:
If we surpass this level and close above it steadily, be prepared to see "surface-to-air missiles" in the market! 🚀
Against all this, always be cautious and work with a clear plan far from emotions.
I wish you all the best in your trading 🥰😇

US30: Next Move Is Up! Long!
My dear friends,
Today we will analyse US30 together☺️
The market is at an inflection zone and price has now reached an area around 39,955.7 where previous reversals or breakouts have occurred.And a price reaction that we are seeing on multiple timeframes here could signal the next move up so we can enter on confirmation, and target the next key level of 40,208.3.Stop-loss is recommended beyond the inflection zone.
❤️Sending you lots of Love and Hugs❤️

GOLD: Target Is Up! Long!
My dear friends,
Today we will analyse GOLD together☺️
The price is near a wide key level
and the pair is approaching a significant decision level of 3,332.62 Therefore, a strong bullish reaction here could determine the next move up.We will watch for a confirmation candle, and then target the next key level of 3,359.49.Recommend Stop-loss is beyond the current level.
❤️Sending you lots of Love and Hugs❤️

Current $BTC Analysis: target 100k
Price is currently testing the major descending trendline.
A breakout and weekly close above the trendline would confirm a strong bullish continuation and mark the beginning of a new upward wave.
Breaking the trendline = bullish confirmation.
Failure to break = possible short-term pullback before another attempt.
🎯 Next Target Levels After Breakout:
1 : $118,476
2 : $136,753
3 : $161,132
