Gold Buy at 4080 and sell at 4240Now gold in consolidation mode and trying to book profits and make the retail traders into the trap so for now we need to be patience and buy at 4080 and close at 4240, after the fed interest cut gold will come down so sell at 4240 and wait for long selling till 3966. This method is Wd Gann inspiration i made and am still learning, this one sharing for study purpose so trade with your own analysis.
Gann

Update on Bearish continuationPlayed out as analyzed in my previous post.
Depending on your style of trading, patience should be the #1 rule.
Furthermore, we should be looking for a LH now, breaking 1.1547. Then look that we get a liquidity sweep back at 1.1586 for continuation to the downside. Wait for confirmation and manage your stop loss to the downside.

IN USDT LONG SIGNAL---
💎 Futures Signal — IN
🔹 Entry Zone: 0.1156 – 0.1115
🔹 Targets:
🎯 TP1: 0.1265
🎯 TP2: 0.1375
🔹 Stop Loss: 0.1053
🔹 Leverage: ×5
🔹 Position Type: Long (Futures)
📊 Analysis:
Price is testing a key support zone. As long as 0.1115 holds, a bullish move toward 0.1265 and 0.1375 is likely.
A confirmed breakout above 0.1156 may indicate the beginning of an upward trend.
Use proper risk management and adjust position size according to leverage.

XAUUSD M15 Live Trade XAUUSD M15 Live Trade As price is at key support and Gold is in Long trend right now...

XAUUSD: Market Analysis and Strategy for October 30Gold Technical Analysis:
Daily chart resistance: 4090, support: 3840.
4-hour chart resistance: 4050, support: 3890.
1-hour chart resistance: 4030, support: 3916.
Technical Analysis: Gold prices rebounded technically after falling nearly 5% over four consecutive trading days. The market faced short-term headwinds due to Powell downplaying the possibility of a December rate cut; however, widening divisions within the Federal Reserve regarding interest rate decisions have introduced new uncertainty to the market. Meanwhile, the trade easing agreement reached between the US and China has weakened safe-haven demand.
The daily chart shows a stepped decline, with four consecutive days of losses up to the previous trading day, and the moving average system has formed a death cross. After the European market opened today, prices rebounded rapidly. Short-term resistance levels to watch are 4010 and 4030. If gold can hold above 4010 and remain firmly above 4000, it will likely attract previous buying interest and resume its long-term upward trend. Conversely, if gold fails to recover and hold above 4000, selling on rallies is advisable.
Looking at the 1-hour chart, the moving averages have formed a golden cross, and the MACD/KDJ indicators are providing upward momentum. In the short term, focus on the continuation of the upward trend, paying particular attention to yesterday's rebound high of 4006 and the previous trading day's rebound high around 4030.
Trading Strategy:
SELL: 4050~4056 near
BUY: 3966~3960 near
More Analysis →

EthereumETHUSD
- Bearish Channel as an corrective pattern in Short Time Frame
- Sell Side Liquidity
- Change of Characteristics
- Completed " 1234 " Impulsive Waves
- Order Block

October 29 Bitcoin Bybit chart analysis (FOMC)Hello
It's a Bitcoin Guide.
If you "follow"
You can receive real-time movement paths and comment notifications on major sections.
If my analysis was helpful,
Please click the booster button at the bottom.
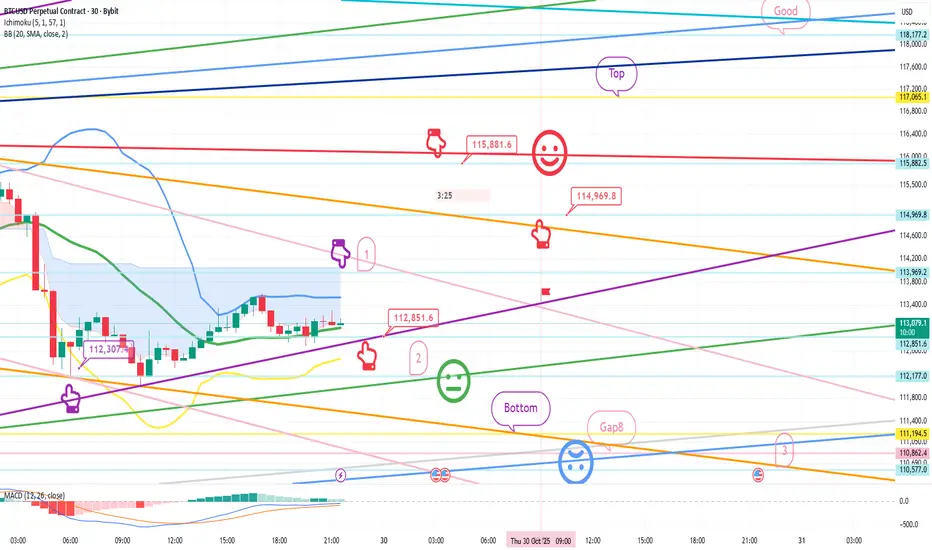
Here's a 30-minute Bitcoin chart.
Shortly, at 11 AM, there will be Nasdaq data releases.
At 3 AM, the FOMC releases data.
Unfortunately, yesterday's BTC move, which involved long and short positions, led to a strategy failure, so today's analysis will be completely public.
I ask for your support.
On the left, the purple finger connects yesterday's final long position entry point, the third section at $112,307.4.
While the interest rate cut is fundamentally positive,
I calculated the Nasdaq price fluctuations and implemented my strategy.
While there may be significant movements early in the morning,
BTC has many important elements, so I recommend reading carefully.
*Conditional Long Position Strategy: When the Red Finger Moves
1. After confirming that the purple finger touches the first section at the top,
the red finger marks the entry point for a long position at $112,851.6.
/ If the green support line is broken, set a stop loss price at $115,881.6.
1st target for a long position: $115,881.6 -> Target price at Top, Good, in that order.
If the strategy succeeds until the first target is touched, $114,969.8 is the point where the long position can be re-entered.
If the red resistance line is broken,
an uptrend could immediately resume.
If the price fails,
there's a possibility of another strong correction.
If the top section is touched before tomorrow's daily candlestick formation,
since this is the resistance line on the daily Bollinger Band chart,
a strong correction is likely,
it would be a good idea to enter a short position and then wait for a long position.
From the first section at the top to the orange resistance line,
a strong rebound is possible, so I don't recommend shorting.
If the price drops immediately without touching the first section,
then I recommend waiting for a final long position in the second section. If the green support line is broken,
then a pullback to the Gap 8 section at the bottom is highly likely.
Please note that if the green support line is broken,
then a pullback to the Gap 8 section at the bottom is highly likely.
Up to section 3 is open,
but this section is connected to the medium-term uptrend line,
so long positions should be held at all costs.
Yesterday's move also broke the first and fourth sections without any support,
breaking the medium-term pattern.
Since the 12-hour MACD dead cross isn't yet considered risky,
I proceeded as safely as possible, as the Nasdaq's movements were in line with it.
Please use my analysis to this point for reference only.
I hope you operate safely, adhering to principled trading and a stop-loss system.
Thank you.
JELLYGLLLY USDT SHORT SIGNAN📉 SHORT SIGNAL – JELLYLEL/USDT
Entry Zone: 0.13088
Stop Loss: 0.13465
Targets:
🎯 TP1 = 0.12680
🎯 TP2 = 0.12275
🎯 TP3 = 0.11855
Leverage: 10
R/R Ratio: 4.0
Timeframe: —
Reason:
Price rejection from upper resistance zone
Bearish structure with lower highs forming
Volume weakening, confirming potential downward move
⚠️ Risk management is essential — Always review the chart before entering any trade.

TONCOIN (TON/USDT): Wave 5 or Impulse FailureTONCOIN (TON/USDT): Wave 5 or Impulse Failure
📈 Weekly Scenarios
Bullish scenario: Price holds above ~$2.70 and breaks through ~$3.90 → start of wave (3) or (5) up → target ~$5.00+.
Consolidation: Price remains in the ~$2.70-$3.90 range without a clear move, market paused.
Bearish scenario: Price breaks below ~$2.60-$2.70 with volume confirmation → start of a corrective wave → possible move to ~$2.10-$2.20.
✅ Conclusion
For the coming week, the technical picture for TON/USDT is on the verge of a reversal.
Holding support at ~$2.60-$2.70 and breaking above ~$3.90 could activate upward momentum.
A breakout below $2.60 is a signal for caution and a possible decline.
The wave count is still unclear, so it's important to monitor the price reaction at key levels.

BTC/USD: Wave 5 Launch or Wave Cycle End?BTC/USD: Wave 5 Launch or Wave Cycle End?
📈 Weekly Scenarios
Bullish scenario: Price holds above ~$110,000, breaks through ~$120,000 → wave (5) strengthens → possible rise to ~$135,000-140,000.
Consolidation: Price trades between ~$110,000 and ~$120,000 without a formed structure, the market is paused.
Bearish scenario: Break of support at ~$110,000 with volume → corrective wave A-B-C → possible decline to ~$100,000-105,000.
✅ Conclusion
On the weekly timeframe, BTC/USD is at a key turning point: either an upward impulse (wave (5)) or the beginning of a major correction.
Holding support at ~$110,000 is the basis for a bullish scenario.
A breakout of resistance at ~$120,000 is a signal for continued growth.
A breakout below ~$110,000 is a signal for a change in structure.

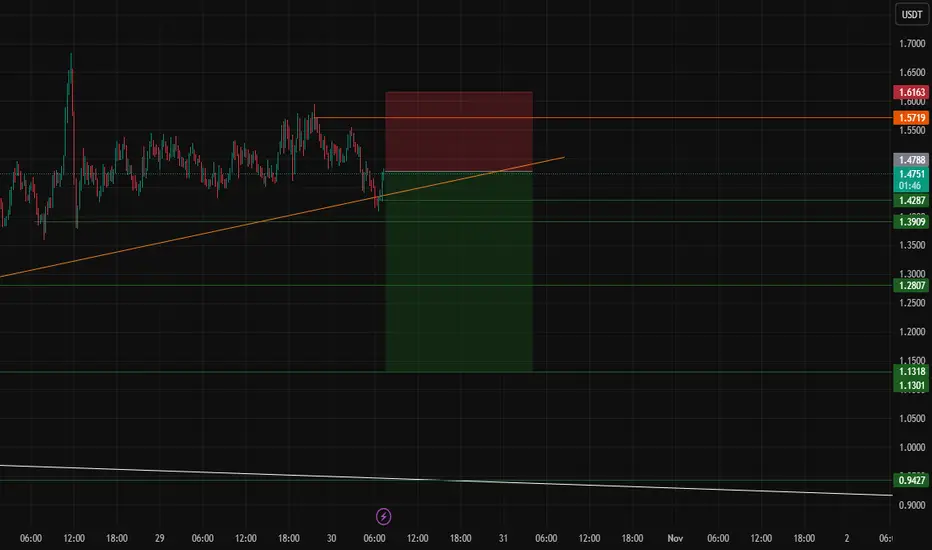
VIRTUAL USDT SHORT SIGNAL📉 Short Signal — VIRTUAL / USDT
🧠 Technical Overview:
After a strong upward movement, VIRTUAL faced heavy resistance around the 1.57–1.60 zone, showing clear exhaustion in bullish momentum.
The price has now formed a lower high and broken below the short-term support at 1.49, confirming a bearish structure on the chart.
We can expect a continued downside movement if the price stays below 1.50, with potential targets aligning with the next demand zones.
💰 Entry Zone:
• 1.4944 (confirmed entry)
• 1.5719 (secondary entry on retest of resistance)
🎯 Targets:
• TP1 = 1.3909
• TP2 = 1.2800
• TP3 = 1.1400
🛑 Stop Loss: 1.6170
⚖️ R/R: 3.2
📌 Recommended Leverage: 5x
⏱ Timeframe: 4H
⚠️ Note:
Risk management is essential — avoid over-leverage and wait for candle confirmation before entering the trade.
If the price breaks and closes above 1.61, the setup becomes invalid.
AUDUSD FRGNT Daily Forecast -Q4 | W44 | D30| Y25 |📅 Q4 | W44 | D30| Y25 |
📊 AUDUSD FRGNT Daily Forecast
🔍 Analysis Approach:
I’m applying Smart Money Concepts, focusing on:
Identifying Points of Interest on the Higher Time Frames (HTFs) 🕰️
Using those POIs to define a clear trading range 📐
Refining those zones on Lower Time Frames (LTFs) 🔎
Waiting for a Break of Structure (BoS) for confirmation ✅
This method allows me to stay precise, disciplined, and aligned with the market narrative, rather than chasing price.
💡 My Motto:
"Capital management, discipline, and consistency in your trading edge."
A positive risk-to-reward ratio, paired with a high win rate, is the backbone of any solid trading plan 📈🔐
⚠️ Losses?
They’re part of the mathematical game of trading 🎲
They don’t define you — they’re necessary, they happen, and we move forward 📊➡️
🙏 I appreciate you taking the time to review my Daily Forecast.
Stay sharp, stay consistent, and protect your capital
— FRNGT 🚀
OANDA:AUDUSD

DXY FRGNT Daily Forecast - Q4 | W44 | D30| Y25 |📅 Q4 | W44 | D30| Y25 |
📊 DXY FRGNT Daily Forecast
🔍 Analysis Approach:
I’m applying Smart Money Concepts, focusing on:
Identifying Points of Interest on the Higher Time Frames (HTFs) 🕰️
Using those POIs to define a clear trading range 📐
Refining those zones on Lower Time Frames (LTFs) 🔎
Waiting for a Break of Structure (BoS) for confirmation ✅
This method allows me to stay precise, disciplined, and aligned with the market narrative, rather than chasing price.
💡 My Motto:
"Capital management, discipline, and consistency in your trading edge."
A positive risk-to-reward ratio, paired with a high win rate, is the backbone of any solid trading plan 📈🔐
⚠️ Losses?
They’re part of the mathematical game of trading 🎲
They don’t define you — they’re necessary, they happen, and we move forward 📊➡️
🙏 I appreciate you taking the time to review my Daily Forecast.
Stay sharp, stay consistent, and protect your capital
— FRNGT 🚀
TVC:DXY

Shifts in Global Trade Patterns and Supply ChainsIntroduction: The New Dynamics of Global Trade
The 21st century has witnessed an unprecedented transformation in global trade patterns and supply chains. From the post–World War II dominance of Western industrial economies to the rise of Asia as the global manufacturing hub, and now to an era shaped by digitalization, sustainability, and geopolitical realignment, trade is no longer just about goods crossing borders—it’s about interconnected systems, data flows, and strategic dependencies.
The COVID-19 pandemic, escalating trade wars, and regional conflicts like the Russia–Ukraine war have further reshaped the global trade map, compelling nations and corporations to rethink where and how they source, produce, and distribute goods. Today’s supply chains are not just economic instruments but also political, environmental, and technological battlegrounds.
This essay explores how global trade patterns and supply chains are shifting—highlighting the key forces driving these changes, the regions gaining and losing influence, and the implications for the future of global commerce.
1. Historical Context: From Globalization to Strategic Localization
In the decades following the 1990s, globalization reached its peak. Corporations sought efficiency through offshoring—relocating production to countries with cheaper labor and favorable trade policies. China, in particular, became the “world’s factory,” while emerging economies like Vietnam, Bangladesh, and Mexico grew as secondary manufacturing centers.
However, this model also created vulnerabilities. The overdependence on a few key suppliers and logistical routes meant that any disruption—whether a natural disaster, pandemic, or political tension—could paralyze entire industries. The 2008 global financial crisis and the 2020 pandemic both exposed these structural weaknesses, sparking a paradigm shift from efficiency-driven globalization to resilience-driven regionalization.
This historical backdrop set the stage for today’s reconfiguration of global trade and supply chains.
2. The Decline of Traditional Globalization
The forces of globalization—free trade, open markets, and integrated supply networks—are no longer the sole organizing principles of world commerce. Instead, nations are turning inward or aligning with regional blocs.
Key drivers of this shift include:
Trade Protectionism: The US–China trade war initiated in 2018 marked a turning point. Tariffs on hundreds of billions of dollars’ worth of goods disrupted established supply chains and forced firms to reconsider sourcing strategies.
National Security Concerns: Sensitive technologies, semiconductors, and critical minerals are now treated as strategic assets. Countries are restricting exports and promoting domestic production to avoid dependency.
Pandemic Disruptions: COVID-19 halted global logistics, revealed the fragility of “just-in-time” supply chains, and accelerated the adoption of “just-in-case” models emphasizing inventory buffers and regional diversification.
As a result, global trade growth has slowed. According to the World Trade Organization (WTO), the share of global trade in GDP has plateaued since 2015, signaling a structural slowdown in hyper-globalization.
3. Regionalization and the Rise of New Trade Hubs
A major trend reshaping global trade is the regionalization of supply chains. Instead of sourcing components from far-flung regions, companies are building shorter, more localized networks to reduce risk and improve resilience.
Key examples include:
Asia-Pacific Integration: While China remains central, production is increasingly distributed across ASEAN nations—Vietnam, Indonesia, Malaysia, and Thailand. This “China + 1” strategy helps reduce dependency on Chinese manufacturing while keeping access to its vast ecosystem.
North American Reshoring: Under the USMCA (United States–Mexico–Canada Agreement), companies are bringing manufacturing closer to home, especially in sectors like electronics, autos, and semiconductors. Mexico, benefiting from proximity to the US, has emerged as a major reshoring destination.
European Realignment: The EU is striving for “strategic autonomy” by strengthening internal supply networks, investing in renewable energy, and reducing reliance on Russian gas and Chinese raw materials. Eastern European nations like Poland, Hungary, and the Czech Republic are gaining traction as nearshoring hubs.
Regionalization doesn’t mean de-globalization—it represents a reconfiguration where trade flows become more concentrated within strategic clusters rather than globally dispersed.
4. The Digital Revolution and Smart Supply Chains
Technology is fundamentally transforming how global supply chains operate. Digital tools—ranging from artificial intelligence (AI) and blockchain to the Internet of Things (IoT) and advanced data analytics—are making supply chains smarter, more transparent, and adaptive.
Key technological impacts include:
AI-driven demand forecasting: Firms now predict market shifts with greater precision, reducing overproduction and wastage.
Blockchain for traceability: This ensures transparency across complex multi-tier supplier networks, particularly vital in industries like pharmaceuticals, food, and luxury goods.
Automation and robotics: Advanced robotics and 3D printing are reducing the cost differential between developed and developing countries, encouraging some industries to “reshore” production.
Digital trade platforms: Cloud-based trade management systems are facilitating faster customs clearance and cross-border documentation.
Digitalization thus acts as a “force multiplier,” enabling efficiency even within shorter, regional supply chains.
5. Geopolitical Tensions and Strategic Supply Chains
Geopolitics now plays a decisive role in shaping global trade patterns. The rivalry between major powers—particularly the US and China—has spilled into areas like technology, finance, and infrastructure.
Examples of this geopolitical fragmentation include:
The US–China Tech War: Restrictions on semiconductor exports, Huawei’s global ban, and supply chain decoupling efforts in critical tech sectors.
The Russia–Ukraine Conflict: Disruption in global energy and food supplies led Europe to accelerate diversification away from Russian dependence and invest in renewable alternatives.
Taiwan’s Semiconductor Dominance: Taiwan’s TSMC produces over 60% of the world’s advanced chips, making it a geopolitical flashpoint. Nations are now racing to build domestic semiconductor capabilities.
Governments worldwide are responding with industrial policies—such as the US CHIPS Act and the EU’s Green Deal Industrial Plan—to strengthen domestic supply resilience and reduce strategic vulnerabilities.
6. Sustainability and Green Supply Chains
Sustainability has become another key pillar shaping global trade. Corporations and countries are now judged not just by efficiency but by environmental and social responsibility.
Emerging sustainability trends include:
Carbon Border Adjustments: The EU’s Carbon Border Adjustment Mechanism (CBAM) will impose tariffs on carbon-intensive imports, encouraging cleaner production methods globally.
Circular Supply Chains: Companies are reusing materials, recycling components, and designing products for longevity—reducing dependency on raw material imports.
Renewable Energy Integration: Nations are aligning trade policies with green energy goals, influencing logistics routes and energy-intensive production locations.
This “green reindustrialization” is creating new opportunities for economies investing in clean manufacturing and renewable technologies, while penalizing those relying heavily on fossil fuels.
7. Emerging Markets: The New Centers of Trade Gravity
While developed economies are reshaping strategies for security and sustainability, emerging markets are becoming the new growth engines of global trade.
India: With its large labor force, pro-manufacturing policies (like “Make in India”), and digital infrastructure, India is positioning itself as a credible alternative to China for global manufacturers.
Vietnam and Indonesia: Both are attracting massive FDI inflows in electronics, apparel, and automotive sectors as part of the “China + 1” diversification strategy.
Africa: The African Continental Free Trade Area (AfCFTA) is creating a single market of over a billion people, opening new avenues for intra-African trade and global partnerships.
Latin America: Mexico and Brazil are emerging as nearshoring hubs for North America and Europe respectively.
These shifts mark a rebalancing of global economic power, where trade is less dominated by a single country or region and more evenly distributed across multiple growth centers.
8. The Logistics Revolution: Ports, Corridors, and Connectivity
Global trade depends not only on production but also on transport and logistics. Recent developments show a massive reorientation of global transport networks.
Alternative Shipping Routes: The Russia–Ukraine war and tensions in the Red Sea have redirected maritime traffic toward longer but safer routes, impacting global shipping costs.
India–Middle East–Europe Economic Corridor (IMEC): Announced in 2023, this new trade corridor aims to counterbalance China’s Belt and Road Initiative by linking India with Europe via the Middle East.
Automation in Ports: Smart ports and AI-based logistics management are reducing turnaround times and improving efficiency in global trade routes.
The next phase of trade will rely on infrastructure intelligence—where logistics are powered by data, automation, and alternative energy.
9. Supply Chain Resilience: From Just-in-Time to Just-in-Case
The traditional “just-in-time” model—minimizing inventory to cut costs—proved fragile under recent crises. Today, supply chain resilience has become a corporate priority.
Resilience strategies include:
Diversification of suppliers and locations to avoid overreliance on one country.
Inventory buffers for critical materials like semiconductors, lithium, and rare earths.
Multi-shoring and friend-shoring—favoring trade with politically aligned or nearby nations.
Scenario planning and stress testing to anticipate disruptions.
Resilience no longer means inefficiency—it is an investment in stability and strategic independence.
10. The Future of Global Trade: Multipolar, Digital, and Sustainable
The future of global trade will be multipolar, digital, and sustainability-driven. Power will no longer be concentrated in one global hub like China or the US, but spread across multiple regional clusters—each specializing in distinct industries.
Key trends for the next decade include:
Expansion of digital trade agreements (like the Digital Economy Partnership Agreement, DEPA).
Integration of AI and data analytics for predictive supply chain management.
Growth of sustainable trade finance linked to ESG (Environmental, Social, Governance) metrics.
The rise of cross-border e-commerce as small businesses join global trade through digital platforms.
In essence, globalization is not disappearing—it is evolving into a more complex, technology-enabled network of regional and digital ecosystems.
Conclusion: The Great Reconfiguration
The global trade system is undergoing its most profound transformation in decades. The twin forces of geopolitical realignment and technological innovation are redrawing the map of commerce. Efficiency is no longer the sole metric of success—resilience, sustainability, and strategic autonomy now define the new era of global trade.
Nations that adapt to these shifts—by investing in technology, building sustainable industries, and forging resilient partnerships—will lead the next chapter of globalization. Meanwhile, those clinging to old models of cost-driven offshoring may find themselves sidelined in an increasingly fragmented but interconnected world.
The global trade landscape of the 2030s will thus be characterized not by the dominance of any single power, but by the emergence of a networked, multipolar world—where innovation, adaptability, and trust define the flow of goods, data, and ideas.

Strategies for Investors in Emerging Markets1. Understanding Emerging Markets: The Opportunity and the Risk
Emerging markets are nations transitioning from low-income to middle-income status with improving infrastructure, industrial capacity, and governance. They typically exhibit higher GDP growth rates compared to developed economies but are also prone to fluctuations due to external shocks, commodity cycles, and policy uncertainty.
Opportunities:
High Growth Potential: Economic expansion driven by demographics, technology, and urbanization.
Rising Middle Class: Increasing disposable incomes create strong demand for goods, housing, and financial services.
Untapped Markets: Sectors like renewable energy, digital payments, healthcare, and logistics are still underpenetrated.
Diversification: Adding emerging markets exposure helps investors reduce overreliance on developed market cycles.
Risks:
Political Instability: Policy reversals and corruption can disrupt business environments.
Currency Volatility: Exchange rate fluctuations can erode returns for foreign investors.
Liquidity Risk: Many emerging market stocks and bonds are thinly traded.
Regulatory Uncertainty: Sudden capital controls or taxation changes may impact investments.
The challenge is balancing these opportunities and risks through intelligent portfolio design and disciplined execution.
2. Strategic Approach: Building an Investment Framework
Before diving into specific markets or sectors, investors must establish a framework that defines their objectives, time horizon, and risk tolerance.
A. Long-Term Orientation
Emerging markets tend to be volatile in the short term but rewarding over longer periods. A 7–10 year investment horizon allows investors to ride out short-term turbulence and benefit from structural growth trends like digitization, infrastructure expansion, and industrial modernization.
B. Top-Down vs. Bottom-Up Analysis
Top-Down Approach: Focuses on macroeconomic indicators like GDP growth, fiscal health, inflation, interest rates, and political stability to identify attractive countries or regions.
Bottom-Up Approach: Focuses on identifying fundamentally strong companies within those economies that are capable of delivering consistent earnings growth regardless of external volatility.
A blend of both approaches ensures that investors capture macroeconomic upside while remaining selective at the micro level.
3. Geographic Diversification: Don’t Bet on a Single Country
One of the core principles in emerging market investing is diversification. No two emerging markets move in the same direction at the same time. For example, India’s tech-led growth story differs from Brazil’s commodity-driven economy or Vietnam’s export manufacturing model.
Key Diversification Strategies:
Regional Balance: Spread exposure across Asia, Latin America, Eastern Europe, and Africa.
Economic Model Diversification: Combine consumer-driven economies (India, Indonesia) with export-driven ones (Vietnam, Mexico).
Political Diversity: Mix stable democracies with reform-driven autocracies to spread political risk.
Exchange-Traded Funds (ETFs) like iShares MSCI Emerging Markets ETF (EEM) or Vanguard FTSE Emerging Markets ETF (VWO) provide diversified exposure across multiple markets, reducing country-specific volatility.
4. Sectoral Allocation: Focus on Structural Growth Themes
Emerging markets often lead global trends in specific sectors. Identifying high-growth industries within these regions helps investors capture sustainable long-term returns.
Promising Sectors:
Technology & Digital Infrastructure: The explosion of fintech, e-commerce, and AI startups in India, Indonesia, and Latin America.
Renewable Energy: Transition toward solar, wind, and green hydrogen projects in India, Brazil, and South Africa.
Healthcare & Pharmaceuticals: Growing middle-class populations are demanding better healthcare access and quality.
Consumer Goods & Retail: Expanding domestic consumption supports strong demand for FMCG and retail companies.
Financial Services: Low financial penetration opens vast opportunities for banking, insurance, and digital finance firms.
Investors should look for sectors aligned with long-term development trends and domestic reforms rather than short-term cyclical plays.
5. Currency and Inflation Management
One of the most overlooked risks in emerging market investing is currency fluctuation. Even if local asset prices rise, depreciation in the local currency against the U.S. dollar can wipe out gains for foreign investors.
Strategies to Manage Currency Risk:
Hedged ETFs: Use instruments that neutralize foreign exchange exposure.
Dollar-Cost Averaging: Regular investments over time reduce the impact of exchange rate timing.
Local Currency Bonds: Some investors use local bonds to balance currency exposure since yields often compensate for risk.
Stable Country Selection: Prioritize countries with credible central banks and stable monetary policies (e.g., India or Chile).
Inflation, too, can erode real returns. Investing in inflation-resilient assets such as commodities, real estate, or dividend-paying equities helps offset purchasing power loss.
6. Active vs. Passive Investment Strategies
Passive Investing
Investors can use index funds or ETFs tracking emerging market indices for cost-effective diversification. These instruments provide broad exposure and reduce single-country or single-stock risk.
However, passive strategies may miss out on specific outperformers or structural changes in certain markets.
Active Investing
Active fund managers can exploit inefficiencies in emerging markets by selecting undervalued companies, timing entries, and managing risk dynamically.
Successful active investing requires local knowledge, deep research, and a long-term view.
Blended Approach
Many investors use a core-satellite strategy:
Core portfolio: Passive exposure to broad emerging markets.
Satellite portfolio: Active bets on select countries or sectors with strong upside potential.
This combination provides balance between stability and opportunity.
7. Incorporating ESG and Governance Factors
Environmental, Social, and Governance (ESG) considerations have become integral to investment decisions worldwide. In emerging markets, ESG risks—such as corruption, labor practices, or environmental degradation—can directly affect returns.
ESG Strategies:
Screening Out High-Risk Firms: Avoid companies with poor governance or environmental violations.
Engagement: Encourage companies to improve transparency and sustainability practices.
ESG-Focused Funds: Many global asset managers now offer emerging market ESG ETFs and funds.
ESG adoption is not only ethically sound but also improves long-term performance as well-governed companies often enjoy lower borrowing costs and better investor confidence.
8. Timing and Entry Strategy
Emerging markets are highly sensitive to global liquidity cycles. When interest rates in developed markets rise, capital often flows out of emerging economies, leading to currency depreciation and market corrections.
Timing Tips:
Avoid Herd Behavior: Don’t chase rallies driven by short-term sentiment.
Buy During Corrections: Use market pullbacks to accumulate high-quality stocks at attractive valuations.
Follow Global Monetary Trends: Emerging markets typically perform better when the U.S. dollar weakens and global liquidity expands.
Technical Indicators: Use support levels and moving averages to identify favorable entry points.
Investors who remain disciplined and patient tend to benefit from long-term uptrends following temporary volatility.
9. Using Local Expertise and Partnerships
Investing directly in foreign markets can be complex due to legal, taxation, and information asymmetry challenges.
Collaborating with local fund managers, research firms, or regional ETFs provides better access to data, understanding of cultural nuances, and insight into domestic market behavior.
For example:
Joint ventures with local asset managers can open doors to private equity opportunities.
Local advisory services help navigate regulations and currency repatriation rules.
10. Risk Management and Hedging Tools
Emerging market investors must prioritize capital preservation as much as growth. Key risk management measures include:
Position Sizing: Avoid concentrating too much in a single country or sector.
Stop-Loss and Rebalancing: Regularly review portfolios to lock in gains and cut losses.
Derivatives and Hedging Instruments: Use currency futures or options to mitigate exchange risk.
Fixed Income Allocation: Pair equity exposure with sovereign or corporate bonds for income stability.
Liquidity Buffer: Maintain cash reserves to take advantage of opportunities during volatility spikes.
Effective risk management separates disciplined investors from speculative traders.
11. Case Studies: India and Vietnam
India: The Digital and Consumption Story
India represents one of the strongest long-term emerging market stories, driven by digital transformation, manufacturing expansion under “Make in India,” and a rising young population.
Sectors like IT services, fintech, renewable energy, and capital goods have delivered consistent returns. The government’s focus on infrastructure and fiscal reforms adds structural strength.
Vietnam: The Manufacturing Powerhouse
Vietnam benefits from trade diversification, young labor force, and foreign investment inflows as companies relocate from China. Its export-oriented economy, stable governance, and strategic location make it a regional favorite. However, investors must watch for banking sector vulnerabilities and currency management challenges.
These examples highlight the importance of aligning investment strategy with each country’s unique growth narrative.
12. Long-Term Vision: Compounding in High-Growth Economies
Emerging markets reward investors who think in decades, not quarters. Compounding works best when capital remains invested during both upcycles and corrections. Reinvesting dividends, staying informed on macroeconomic trends, and maintaining a disciplined approach can create exponential growth over time.
Global investors like BlackRock, Fidelity, and Franklin Templeton have consistently emphasized that emerging markets are no longer speculative bets — they are essential components of global portfolios.
Conclusion: Balancing Risk and Reward in the New Global Order
The next wave of global economic growth will likely come from emerging markets. With technological innovation, demographic dividends, and economic reforms, these nations are shaping the new world order.
However, investing in them requires a careful balance between optimism and prudence.
Successful investors in emerging markets:
Diversify broadly.
Focus on long-term structural growth themes.
Actively manage currency and political risks.
Blend passive exposure with active conviction plays.
Stay disciplined during volatility.
Emerging markets are not for the faint-hearted, but for those with patience, research, and strategy — they offer some of the most rewarding opportunities in global investing today.
SHort soonWith the Fed cutting interest rates for the DXY, I’d like to see that buy-side liquidity engaged, followed by a price breakdown.
With only Thursday and Friday remaining, we could potentially see them target that buy-side before starting to work lower next week.
Currently, we are trading above a previous high.

EURUSD FRGNT Daily Forecast -Q4 | W44 | D30| Y25 |📅 Q4 | W44 | D30| Y25 |
📊 EURUSD FRGNT Daily Forecast
🔍 Analysis Approach:
I’m applying Smart Money Concepts, focusing on:
Identifying Points of Interest on the Higher Time Frames (HTFs) 🕰️
Using those POIs to define a clear trading range 📐
Refining those zones on Lower Time Frames (LTFs) 🔎
Waiting for a Break of Structure (BoS) for confirmation ✅
This method allows me to stay precise, disciplined, and aligned with the market narrative, rather than chasing price.
💡 My Motto:
"Capital management, discipline, and consistency in your trading edge."
A positive risk-to-reward ratio, paired with a high win rate, is the backbone of any solid trading plan 📈🔐
⚠️ Losses?
They’re part of the mathematical game of trading 🎲
They don’t define you — they’re necessary, they happen, and we move forward 📊➡️
🙏 I appreciate you taking the time to review my Daily Forecast.
Stay sharp, stay consistent, and protect your capital
— FRNGT 🚀
OANDA:EURUSD

Predicting Intraday CRASHES 10%+ w/ 5 Easy Steps1️⃣ Daily imbalance above has been rebalanced.
2️⃣ Price is rejecting from premium arrays (above equilibrium of the daily dealing range).
3️⃣ Intraday displacement (#4) aligns perfectly with that macro rejection.
4️⃣ Volume and spread expand on the breakdown — that’s real order-flow, not stop-hunts.
5️⃣ There’s untouched liquidity resting below the daily lows. That’s where the algorithm’s draw is.

$GOLD topped until 2026?TVC:GOLD seems topped, by 105 days cycle 15(weeks) we can await a pullback after left ranslation by gold

EURUSD FRGNT Daily Forecast - Q4 | W44 | D29| Y25 |📅 Q4 | W44 | D29| Y25 |
📊 EURUSD FRGNT Daily Forecast
🔍 Analysis Approach:
I’m applying Smart Money Concepts, focusing on:
Identifying Points of Interest on the Higher Time Frames (HTFs) 🕰️
Using those POIs to define a clear trading range 📐
Refining those zones on Lower Time Frames (LTFs) 🔎
Waiting for a Break of Structure (BoS) for confirmation ✅
This method allows me to stay precise, disciplined, and aligned with the market narrative, rather than chasing price.
💡 My Motto:
"Capital management, discipline, and consistency in your trading edge."
A positive risk-to-reward ratio, paired with a high win rate, is the backbone of any solid trading plan 📈🔐
⚠️ Losses?
They’re part of the mathematical game of trading 🎲
They don’t define you — they’re necessary, they happen, and we move forward 📊➡️
🙏 I appreciate you taking the time to review my Daily Forecast.
Stay sharp, stay consistent, and protect your capital
— FRNGT 🚀
OANDA:EURUSD

eth to 6000 early next year?2026 would be much better for eth to head toward my target of
6000
8000
10,000
Q1 2026

GOLD IN A DANGER ZONE, SAFE ASSETS DAYS ARE GONE FOPR A WHILE?after a rally with small corrections since 2019. gold never saw a bear season or 35-39% correction
2026 might be the year for that to happen
DYOR

Granuels : breaking out of consolidation ?Granuels : breaking out of consolidation ?
cmd 605
Sl 588
Target 628, 700 if it breaks 628 then good upside momentum
PE < industry PE
Strictly for educational purpose and not a buy sell recommmendation
