EURUSD: Local Bearish Bias! Short!
My dear friends,
Today we will analyse EURUSD together☺️
The recent price action suggests a shift in mid-term momentum. A break below the current local range around 1.13366 will confirm the new direction downwards with the target being the next key level of 1.13144.and a reconvened placement of a stop-loss beyond the range.
❤️Sending you lots of Love and Hugs❤️
Gann

SILVER: Strong Growth Ahead! Long!
My dear friends,
Today we will analyse GOLD together☺️
The in-trend continuation seems likely as the current long-term trend appears to be strong, and price is holding above a key level of 32.688 So a bullish continuation seems plausible, targeting the next high. We should enter on confirmation, and place a stop-loss beyond the recent swing level.
❤️Sending you lots of Love and Hugs❤️

CRV/USDT – 2W Chart Overview
The price is currently consolidating after a prolonged downtrend and shows signs of a potential trend reversal.
The price has broken out of a falling wedge (bullish pattern).
Currently testing the Fibonacci retracement levels — most notably the 0.5 - 0.618 zone, which may act as a pullback entry zone.
📌 Key Buy Zone: Retest of the breakout near the 0.618 Fibonacci level (~0.55 - 0.60) could offer a strategic entry if confirmed by price action.
🎯 Upside Targets:
1st Target: 1.0966 USDT
2nd Target: 1.3328 USDT
3rd Target: 1.6212 USDT
Invalidation: Break below the support zone near 0.45 would invalidate this setup.


GOLD VS BTC: 2026 Like it or not, Bitcoin is behaving like a risk on asset but with the seasonality of a commodity. so there are reasons to compare the pair with its rival Gold to peek into the future, much like people do with the dollar and its fake blockchain derivates. the implications of a brutal 2025 bear market could be really bad for crypto and I seriously doubt that market makers would ever allow that. however, it's clear that they are playing with retail emotions pretty hard since COVID happened. everything is permitted, also a great wealth transfer. especially when nationwide "blackouts" happens in first world countries like Spain and France.

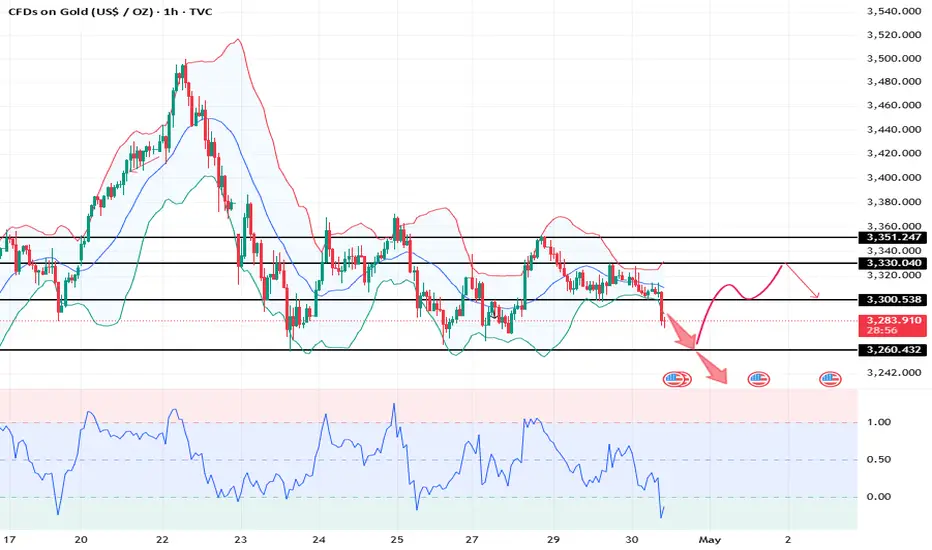
XAUUSD: 30/4 Today’s Market Analysis and StrategyGold technical analysis
The resistance level of the four-hour chart is 3330, and the support level is 3260.
The resistance level of the one-hour chart is 3307, and the support level is 3275.
The resistance level of the 30-minute chart is 3300, and the support level is 3280.
The 4H cycle is a horizontal box operation. This week is a data week. The gold price is greatly affected by the news. Wait for the NFP data on Friday to break the box operation. Due to the recent market fluctuations, the entry position is very critical. For the time being, focus on the previous support of 3300 today. If the US market stands at 3300, it can be bullish to the 3320~3330 area. On the contrary, if it falls below the 4H and daily support of 3260 US dollars, it may touch the monthly support level of 3230~3200.
There are many news about the US market data today. Wait for the data to be released before trading! Avoid losses caused by increased liquidity during the news release.
Trading strategy:
Buy: 3265 SL:3260
Buy: 3300 SL:3295
Sell: 3330 SL:3335
Sell: 3260 SL:3265
Only provide trading direction, specific entry price, SL/TP need to wait for real-time liquidity confirmation
April 29 Bitcoin Bybit chart analysisHello
It's a Bitcoinguide.
If you have a "follower"
You can receive comment notifications on real-time travel routes and major sections.
If my analysis is helpful,
Please would like one booster button at the bottom.
This is the Nasdaq 30-minute chart.
There will be an indicator announcement at 11 o'clock in a little while.
After the 4-hour chart MACD dead cross was imprinted yesterday
Today, two things are clear
*Red finger strong rise or purple finger major rebound.
The main issue was whether the 6-hour chart MACD dead cross occurred
After writing the analysis, looking at the overall movement
The purple finger seems strong today.
Let's apply it to Bitcoin as it is.
This is a 30-minute Bitcoin chart.
At the bottom left, I connected the long position entry point of $93,046 that I entered in the analysis article on the 25th.
Bitcoin and Tether dominance are moving sideways.
Bitcoin is slightly more advantageous in terms of MACD signals or Ichimoku Kinko Hyo,
but it is not strange if one side skyrockets or plummets.
While moving sideways, I was watching Nasdaq,
and I paid attention to the Nasdaq movement.
*Red finger movement path
One-way long position strategy
1. 94242.4 dollar long position entry section / green support line breakaway stop loss price
2. 96005.1 dollar long position 1st target -> Top 2nd target -> Final Good
The 1st section at the top is the rising wave position
If you touch it first, the possibility of success of the strategy increases.
If the strategy is successful, it would be good to use it as the final long position re-entry.
Depending on the adjustment coming out of Nasdaq, it can be pushed up to section 2
Roughly, it is the support line of the Bollinger Band 6-hour chart.
If the rebound fails in Nasdaq
Bottom -> Please note that it can be pushed to section 3.
Up to this point, please use my analysis as a simple reference and use.
Thank you.

GANNSQ9 + LRC + FIBO RETRACEMENTThe price has broken the upper line of the linear regregreesion lines in this chart. It indicates potential reversal of trend. The fibonacci retracement line dram from 394.70 to 198.55 shows important levels for the bulls to reach. The price is already above the 23.6 % and is looking toward 38.2% (273.55) . The GANN square of Nine shows important support and resistance for near term.

BTCI am closely monitoring BTC price action and will look at how it manages on the upcoming NYO. As seen on the chart I have market out my points of interest with the blue lines, take it as my potential entry points. I will be updating my views on BTC as soon as possible.
As you can see, I market out liquidity and potential entry points. As always I will monitor PA closely and provide a possible entry setup when I see it possible.
Remember to trade with mind and not with heart!
I always appreciate a follow, keeps me going :) thanks !!!!

SOLOn CRYPTOCAP:SOL you can see the support zone I mark out. Take them as POI and watch PA closely when it reaches them. When I see a proper confirmation on either of the support levels you see on the chart I will announce it asap and notify you guys about my entry.
Remember to always use a stop loss and proper take profit to eliminate emotions and secure the profits.
Goodluck!
I always appreciate a follow, it keeps me going :) thanks!!!

USDCAD LONG FORECAST Q2 W18 D30 Y25 USDCAD LONG FORECAST Q2 W18 D30 Y25
Professional Risk Managers👋
Welcome back to another FRGNT chart update📈
Diving into some Forex setups using predominantly higher time frame order blocks alongside confirmation breaks of structure.
Let’s see what price action is telling us today!
💡Here are some trade confluences📝
✅Intraday bullish breaks of structure
✅Tokyo ranges to be filled
✅Daily low rejection
✅1' order block identified
🔑 Remember, to participate in trading comes always with a degree of risk, therefore as professional risk managers it remains vital that we stick to our risk management plan as well as our trading strategies.
📈The rest, we leave to the balance of probabilities.
💡Fail to plan. Plan to fail.
🏆It has always been that simple.
❤️Good luck with your trading journey, I shall see you at the very top.
🎯Trade consistent, FRGNT X

GANN SQ9+ INV H&S + FIBO The inverted head and shoulder pattern can be observed in the chart. It is a bullish reversal chart pattern indicating potential shift from downtrend to uptrend. The green horizontal line was the support that was broken with a gap and is the potential target for the bulls to reach. The Fibonacci retracement from 1807 to 1084.05 provide important levels for the bulls to watch for. The GANN Sq9 provide near term support and resistances .

4/30 Gold Trading SignalsGold showed limited movement yesterday and did not enter either of our predefined major trading zones, leading to minimal profits.
As of now, the price continues to consolidate. A larger movement is likely to occur during the U.S. session following key economic data.
Until then, consider short-term range trading between 3330-3290.
📌 Why Today’s Data Matters
Gold has been trapped in a tight range for several sessions, and a directional breakout is imminent.
Today’s data release will likely dictate that direction, so it is crucial to stay alert.
✅ Data-Driven Strategy:
If data is bullish (gold rallies):
Avoid chasing the initial breakout. Wait for the first spike to settle, then short the retracement, with a TP of less than $10.
If bulls remain strong, the retracement should stay under $20. Once short positions are closed, watch for confirmation to go long.
If data is bearish (gold drops):
If price doesn't reach the lower buy zones(3258-3223), wait for a minor rebound to short, targeting the next leg lower.
📌 Today's Suggested Trade Zones:
🔻 Sell Zones:
3378–3418
3330–3358
🔺 Buy Zones:
3258–3223
3110–3330 (ladder entries)

AUDUSD SHORT FORECAST Q2 W18 D30 Y25AUDUSD SHORT FORECAST Q2 W18 D30 Y25
Professional Risk Managers👋
Welcome back to another FRGNT chart update📈
Diving into some Forex setups using predominantly higher time frame order blocks alongside confirmation breaks of structure.
Let’s see what price action is telling us today!
💡Here are some trade confluences📝
✅Weekly 50 EMA
✅Intraday 15' order block
✅Tokyo ranges to be filled
✅Intraday 15' order block trading levels
🔑 Remember, to participate in trading comes always with a degree of risk, therefore as professional risk managers it remains vital that we stick to our risk management plan as well as our trading strategies.
📈The Xrest, we leave to the balance of probabilities.
💡Fail to plan. Plan to fail.
🏆It has always been that simple.
❤️Good luck with your trading journey, I shall see you at the very top.
🎯Trade consistent, FRGNT

AUDCAD SHORT FORECAST Q2 W18 D30 Y25AUDCAD SHORT FORECAST Q2 W18 D30 Y25
Professional Risk Managers👋
Welcome back to another FRGNT chart update📈
Diving into some Forex setups using predominantly higher time frame order blocks alongside confirmation breaks of structure.
Let’s see what price action is telling us today!
💡Here are some trade confluences📝
✅Daily 50 EMA
✅Intraday 5' order block
✅Tokyo ranges to be filled
✅Intraday bearish breaks of structure to be confirmed
🔑 Remember, to participate in trading comes always with a degree of risk, therefore as professional risk managers it remains vital that we stick to our risk management plan as well as our trading strategies.
📈The rest, we leave to the balance of probabilities.
💡Fail to plan. Plan to fail.
🏆It has always been that simple.
❤️Good luck with your trading journey, I shall see you at the very top.
🎯Trade consistent, FRGNT X

USDCHF LONG FORECAST Q2 W18 D30 Y25USDCHF LONG FORECAST Q2 W18 D30 Y25
Professional Risk Managers👋
Welcome back to another FRGNT chart update📈
Diving into some Forex setups using predominantly higher time frame order blocks alongside confirmation breaks of structure.
Let’s see what price action is telling us today!
💡Here are some trade confluences📝
✅Weekly order block rejection
✅Daily order block rejection
✅15’ order block
✅Intraday bullish breaks of structure
🔑 Remember, to participate in trading comes always with a degree of risk, therefore as professional risk managers it remains vital that we stick to our risk management plan as well as our trading strategies.
📈The rest, we leave to the balance of probabilities.
💡Fail to plan. Plan to fail.
🏆It has always been that simple.
❤️Good luck with your trading journey, I shall see you at the very top.
🎯Trade consistent, FRGNT X

GBPUSD SHORT FORECAST Q2 W18 D30 Y25GBPUSD SHORT FORECAST Q2 W18 D30 Y25
Professional Risk Managers👋
Welcome back to another FRGNT chart update📈
Diving into some Forex setups using predominantly higher time frame order blocks alongside confirmation breaks of structure.
Let’s see what price action is telling us today!
💡Here are some trade confluences📝
✅Weekly order block rejection
✅Daily order block rejection
✅Daily high rejection
✅Daily imbalance fill targets
🔑 Remember, to participate in trading comes always with a degree of risk, therefore as professional risk managers it remains vital that we stick to our risk management plan as well as our trading strategies.
📈The rest, we leave to the balance of probabilities.
💡Fail to plan. Plan to fail.
🏆It has always been that simple.
❤️Good luck with your trading journey, I shall see you at the very top.
🎯Trade consistent, FRGNT X

EthereumETHUSD
- Completed " 123 " Impulsive Waves
- Break of Structure
- Demand Zone
- Ascending Triangle in Short Time Frame
- Order Block

EURUSD SHORT FORECAST Q2 W18 D30 Y25EURUSD SHORT FORECAST Q2 W18 D30 Y25
Professional Risk Managers👋
Welcome back to another FRGNT chart update📈
Diving into some Forex setups using predominantly higher time frame order blocks alongside confirmation breaks of structure.
Let’s see what price action is telling us today!
💡Here are some trade confluences📝
✅Weekly order block rejection
✅Daily order block rejection
✅Intraday 15' order blocks
✅Tokyo ranges to be filled
🔑 Remember, to participate in trading comes always with a degree of risk, therefore as professional risk managers it remains vital that we stick to our risk management plan as well as our trading strategies.
📈The rest, we leave to the balance of probabilities.
💡Fail to plan. Plan to fail.
🏆It has always been that simple.
❤️Good luck with your trading journey, I shall see you at the very top.
🎯Trade consistent, FRGNT X

EURGBP SHORT FORECAST Q2 W18 D30 Y25EURGBP SHORT FORECAST Q2 W18 D30 Y25
Professional Risk Managers👋
Welcome back to another FRGNT chart update📈
Diving into some Forex setups using predominantly higher time frame order blocks alongside confirmation breaks of structure.
Let’s see what price action is telling us today!
💡Here are some trade confluences📝
✅Weekly order block
✅15' order block
✅Intraday bearish breaks of structure
✅Tokyo ranges to be filled
🔑 Remember, to participate in trading comes always with a degree of risk, therefore as professional risk managers it remains vital that we stick to our risk management plan as well as our trading strategies.
📈The rest, we leave to the balance of probabilities.
💡Fail to plan. Plan to fail.
🏆It has always been that simple.
❤️Good luck with your trading journey, I shall see you at the very top.
🎯Trade consistent, FRGNT X

GOLD-BUY strategy 6 hourly chart GANNThe move lower was short lived, and now we have return to previous levels. I feel we may see higher levels now due to the fact indicators are positive turning upwards, and there is a chance to see $ 3,450 test again.
Strategy BUY @ $ 3,310-3,330 and take profit near $ 3,417 for now.

IGRDthe chart shows a technical analysis of Estithmar Holding (IGRD) on a weekly timeframe, using Elliott Wave theory and Gann/Fibonacci angles to predict potential price movements.
Key Observations:
Elliott Wave Pattern – ABC Correction:
The chart suggests that the stock completed wave B at a recent high.
A downward corrective wave C is anticipated, as shown by the red dotted line.
Bearish Divergence:
At the bottom, a momentum oscillator (likely RSI or a similar indicator) shows bearish divergence – price is rising, but momentum is falling.
This is typically a warning signal that upside momentum is weakening.
Downside Price Targets (based on Gann/Fibonacci angles):
Possible support levels:
2.15 QAR
1.93 QAR
1.71 QAR
1.49 QAR
Final target: ~1.06 QAR (as the lowest projected level)
Warning Highlighted:
The red text at the top: "IGRD – Estithmar Holding – See explanation below"
This suggests a bearish outlook unless key resistance levels are broken with strong volume.
Summary:
Current trend: Overbought with signs of weakness.
Outlook: Bearish correction likely.
Action: Watch for confirmation of a downtrend or support at key Fibonacci/Gann levels.

btc fibonacci levels i added new levels btc needs to hold new level 94837 buy green candle close new resistance 95751 if we break we will continue to break into new gann channels lookn for pullback around 96000 levels
