XAUUSD: Market Analysis and Strategy for October 23Gold Technical Analysis
Daily Resistance: 4380, Support: 4000
4-Hour Resistance: 4185, Support: 4015
1-Hour Resistance: 4160, Support: 4065
Gold prices have fluctuated significantly recently. A trading institution recently reviewed the historical trends of gold prices after nine consecutive weeks of gains and concluded that a 20%-40% correction is typical over the next year, with the exception of 1970. Investors should be prepared for a potential multi-month decline of 20%-40% and manage their funds accordingly. However, the long-term bull market logic for gold remains solid. Factors such as the restructuring of the global monetary and credit system, the trend of de-dollarization, continued gold purchases by central banks, and structural imbalances in supply and demand constitute the core support for gold's rise.
This view also aligns with the forecasts of many international investment banks for gold prices next year. This year's insane rally is undoubtedly unsustainable. The simple reason is that there is no such thing as a stock that only rises and never falls in the trading market.
As for the future market trend, I personally believe that after the rebound, gold will fall below 4000 points, perhaps even back to the 3750-3850 range. This would be a very good place to buy the dip. It also represents the 50% and 61.8% golden ratios of the upward trend from the August low of around 3311. Furthermore, 4000 points is a key psychological support level for retail traders; a break below this level would prompt many undecided traders to exit.
For today's trading, follow a sideways range, selling high and buying low. Focus on the upper resistance levels of 4160/4185 and the lower support levels of 4065/4015.
BUY: 4065 near
BUY: 4015 near
SELL: 4160 near
SELL: 4185 near
More Analysis →
Gann

USDJPY Daily Analysis (Short+Long) 24/10In today’s USDJPY scalping setup, I break down my short-term strategy for catching quick intraday moves. I cover key levels, entry zones, and what I’m watching for confirmation before pulling the trigger. Perfect for traders looking to take advantage of short bursts of momentum during the session.

DXY FRGNT Daily Forecast -Q4 | W43 | D2| Y25 |
📅 Q4 | W43 | D2| Y25 |
📊 DXY FRGNT Daily Forecast
🔍 Analysis Approach:
I’m applying Smart Money Concepts, focusing on:
Identifying Points of Interest on the Higher Time Frames (HTFs) 🕰️
Using those POIs to define a clear trading range 📐
Refining those zones on Lower Time Frames (LTFs) 🔎
Waiting for a Break of Structure (BoS) for confirmation ✅
This method allows me to stay precise, disciplined, and aligned with the market narrative, rather than chasing price.
💡 My Motto:
"Capital management, discipline, and consistency in your trading edge."
A positive risk-to-reward ratio, paired with a high win rate, is the backbone of any solid trading plan 📈🔐
⚠️ Losses?
They’re part of the mathematical game of trading 🎲
They don’t define you — they’re necessary, they happen, and we move forward 📊➡️
🙏 I appreciate you taking the time to review my Daily Forecast.
Stay sharp, stay consistent, and protect your capital
— FRNGT 🚀
TVC:DXY

the second transition was a fail. no excuses I've had a great run of AI models walking the market around like an obedient dog, including the first transition of this forecast
This time the second transition did not
time to reset the win streak? or do we still keep the first transition as a win?

ASTER Bright and clean future ahead.Aster today is testing the magic resistance band so far.
Today price moved into there after Trump parddon CZ, i think we can see a massive hype and capitulation by CRYPTOCAP:BNB and SEED_WANDERIN_JIMZIP900:ASTER

POSSIBLE XAUUSD SHORT SETUPANALYSIS
>Mon purged and reverted off last week high
>Tue price action formed the FRD(first red day )also closing below Mon lower high(swing low)
>Wed closed in breakout
>Thurs anticipation: purge and revert off wed high tapping into the FVGOB(fair value gap order block ) thats @ the FVG partition (4196.86 - 4179.29)

POSSIBLE XAGUSD SHORT SETUPANALYSIS
Last week:
>FRD(first red day) on Fri last week closing below Thurs low facilitating a CISD
This week:
>Mon price closed as an inside day
>Tues price closed in breakout(CIB) making the second day of bearish orderflow.
>Wed price closed in breakout as well however the price action was more of a range hence perceived as reaccumulation(acc)
>Thur: anticipating a purge and revert off Wed high and continuation of the bearish trend

#ETH/USDT : Another Attempt To Resume Upward Movement#ETH
The price is moving within a descending channel on the 1-hour frame, adhering well to it, and is heading for a strong breakout and retest.
We have a bearish trend on the RSI indicator that is about to be broken and retested, which supports the upward breakout.
There is a major support area in green at 3826, which represents a strong support point.
We are heading for consolidation above the 100 moving average.
Entry price: 3874.
First target: 3920.
Second target: 3969.
Third target: 4200.
Don't forget a simple matter: capital management.
When you reach the first target, save some money and then change your stop-loss order to an entry order.
For inquiries, please leave a comment.
Thank you.

EURUSD FRGNT FULL CHART BREAKDOWN 3%+ Q4 | W43 | D23| Y25 |📅 Q4 | W43 | D23| Y25 |
📊 EURUSD FRGNT FULL CHART BREAKDOWN 3%+
🔍 Analysis Approach:
I’m applying Smart Money Concepts, focusing on:
Identifying Points of Interest on the Higher Time Frames (HTFs) 🕰️
Using those POIs to define a clear trading range 📐
Refining those zones on Lower Time Frames (LTFs) 🔎
Waiting for a Break of Structure (BoS) for confirmation ✅
This method allows me to stay precise, disciplined, and aligned with the market narrative, rather than chasing price.
💡 My Motto:
"Capital management, discipline, and consistency in your trading edge."
A positive risk-to-reward ratio, paired with a high win rate, is the backbone of any solid trading plan 📈🔐
⚠️ Losses?
They’re part of the mathematical game of trading 🎲
They don’t define you — they’re necessary, they happen, and we move forward 📊➡️
🙏 I appreciate you taking the time to review my Daily Forecast.
Stay sharp, stay consistent, and protect your capital
— FRNGT 🚀
OANDA:EURUSD

#TATAMOTORS - Range ₹ 240 - ₹ 557Date: 23-10-2025
#TataMotors - Current Price: ₹ 405.85
Pivot Point: ₹ 398.93 Support: ₹ 374.42 Resistance: ₹ 423.66
Upside Levels: L1: ₹ 456.54 L2: ₹ 489.43 L3: ₹ 523.36 L4: ₹ 557.30
Downside Levels: L1: ₹ 341.42 L2: ₹ 308.43 L3: ₹ 274.49 L4: ₹ 240.55
#TradingView #Nifty #BankNifty #DJI #NDQ #SENSEX #DAX #USOIL #GOLD #SILVER

EURUSD FRGNT Daily Forecast -Q4 | W43 | D23| Y25 |📅 Q4 | W43 | D23| Y25 |
📊 EURUSD FRGNT Daily Forecast
🔍 Analysis Approach:
I’m applying Smart Money Concepts, focusing on:
Identifying Points of Interest on the Higher Time Frames (HTFs) 🕰️
Using those POIs to define a clear trading range 📐
Refining those zones on Lower Time Frames (LTFs) 🔎
Waiting for a Break of Structure (BoS) for confirmation ✅
This method allows me to stay precise, disciplined, and aligned with the market narrative, rather than chasing price.
💡 My Motto:
"Capital management, discipline, and consistency in your trading edge."
A positive risk-to-reward ratio, paired with a high win rate, is the backbone of any solid trading plan 📈🔐
⚠️ Losses?
They’re part of the mathematical game of trading 🎲
They don’t define you — they’re necessary, they happen, and we move forward 📊➡️
🙏 I appreciate you taking the time to review my Daily Forecast.
Stay sharp, stay consistent, and protect your capital
— FRNGT 🚀
OANDA:EURUSD

NQ & ES Premarket Comment Thursday 23-10-2025Good morning everyone,
Today the market is sitting in a balanced zone — we’re essentially in equilibrium. This means that price action could develop in either direction, and we need to stay open to both scenarios. It might initiate a move higher or lower, or simply oscillate within a defined range — a classic “ping-pong” session.
As the session opens, if we see price sweep the previous day’s low, that could offer a potential long setup. Conversely, if we get a strong impulse to the upside early on, we can start looking for potential short opportunities afterward.
What happens in the first few minutes after the open will be critical today — it should give us clarity on directional intent. The key levels to watch are clearly marked on the chart.
If you don’t feel confident or the picture remains unclear, do nothing. Staying on the sidelines is a valid position on days like this.
Normally I provide live commentary during sessions like this, but today I won’t be doing so. Stay calm, disciplined, and aligned with your trading plan and risk parameters.
We’ll review everything in the afternoon update to see how the session played out.
PF

AUDUSD FRGNT Daily Forecast -Q4 | W43 | D23| Y25 |📅 Q4 | W43 | D23| Y25 |
📊 AUDUSD FRGNT Daily Forecast
🔍 Analysis Approach:
I’m applying Smart Money Concepts, focusing on:
Identifying Points of Interest on the Higher Time Frames (HTFs) 🕰️
Using those POIs to define a clear trading range 📐
Refining those zones on Lower Time Frames (LTFs) 🔎
Waiting for a Break of Structure (BoS) for confirmation ✅
This method allows me to stay precise, disciplined, and aligned with the market narrative, rather than chasing price.
💡 My Motto:
"Capital management, discipline, and consistency in your trading edge."
A positive risk-to-reward ratio, paired with a high win rate, is the backbone of any solid trading plan 📈🔐
⚠️ Losses?
They’re part of the mathematical game of trading 🎲
They don’t define you — they’re necessary, they happen, and we move forward 📊➡️
🙏 I appreciate you taking the time to review my Daily Forecast.
Stay sharp, stay consistent, and protect your capital
— FRNGT 🚀
OANDA:AUDUSD

EthereumETHUSD
- RSI - Divergence
- SSL
- Change of Characteristics
- Order Block
- Symmetrical Triangle as an corrective pattern in Short Time Frame

#JASMY/USDT#JASMY
The price is moving within a descending channel on the 1-hour frame, adhering well to it, and is heading towards a strong breakout and retest.
We are experiencing a rebound from the lower boundary of the descending channel. This support is at 0.01480.
We are experiencing a downtrend on the RSI indicator, which is about to break and retest, supporting the upward trend.
We are in a trend of consolidation above the 100 moving average.
Entry price: 0.01530
First target: 0.01593
Second target: 0.01650
Third target: 0.01720

First transition has been correctly executedNot that it was a target, but just a good feeling to see mtops-ai take price to the first target :D
The key to the mtops-ai forecasts is that it provide the expected market shape and timing of the price pivot points, not to trade on every signal.
Trading rules are always the king...don't trade against trend being one of them

EURGBP FRGNT Daily Forecast -Q4 | W43 | D22| Y25 |📅 Q4 | W43 | D22| Y25 |
📊 EURGBP FRGNT Daily Forecast - Chart breakdown
🔍 Analysis Approach:
I’m applying Smart Money Concepts, focusing on:
Identifying Points of Interest on the Higher Time Frames (HTFs) 🕰️
Using those POIs to define a clear trading range 📐
Refining those zones on Lower Time Frames (LTFs) 🔎
Waiting for a Break of Structure (BoS) for confirmation ✅
This method allows me to stay precise, disciplined, and aligned with the market narrative, rather than chasing price.
💡 My Motto:
"Capital management, discipline, and consistency in your trading edge."
A positive risk-to-reward ratio, paired with a high win rate, is the backbone of any solid trading plan 📈🔐
⚠️ Losses?
They’re part of the mathematical game of trading 🎲
They don’t define you — they’re necessary, they happen, and we move forward 📊➡️
🙏 I appreciate you taking the time to review my Daily Forecast.
Stay sharp, stay consistent, and protect your capital
— FRNGT 🚀
FX:EURGBP

EURUSD FRGNT Daily Forecast - Q4 | W43 | D23| Y25 |📅 Q4 | W43 | D23| Y25 |
📊 EURUSD FRGNT Daily Forecast - Chart breakdown
My process - DO NOT JUMP INTO THE FIRST ORDER BLOCK BELOW ASIA . LOWER TIME FRAME BOS REQUIRED IN LONDON !!!!!!!!!!!!!!!
🔍 Analysis Approach:
I’m applying Smart Money Concepts, focusing on:
Identifying Points of Interest on the Higher Time Frames (HTFs) 🕰️
Using those POIs to define a clear trading range 📐
Refining those zones on Lower Time Frames (LTFs) 🔎
Waiting for a Break of Structure (BoS) for confirmation ✅
This method allows me to stay precise, disciplined, and aligned with the market narrative, rather than chasing price.
💡 My Motto:
"Capital management, discipline, and consistency in your trading edge."
A positive risk-to-reward ratio, paired with a high win rate, is the backbone of any solid trading plan 📈🔐
⚠️ Losses?
They’re part of the mathematical game of trading 🎲
They don’t define you — they’re necessary, they happen, and we move forward 📊➡️
🙏 I appreciate you taking the time to review my Daily Forecast.
Stay sharp, stay consistent, and protect your capital
— FRNGT 🚀
FX:EURUSD

OILUSD fast Scalp to Gapwiti created gap mostly closed within 12 hrs of creation, so that would be very fast please make sure tp have stop lose

Global Market Insights1. Introduction
The global market represents the vast, interconnected system through which goods, services, capital, and information flow across international borders. It encompasses multiple sectors—finance, manufacturing, technology, energy, commodities, and consumer markets—all interwoven through trade, investment, and policy networks. Global markets serve as the backbone of the modern economy, reflecting shifts in geopolitical influence, technological innovation, and consumer behavior. Understanding global market insights requires an in-depth view of these interconnections, examining how trends in one region or industry can ripple throughout the entire world economy.
The 21st century has witnessed dramatic globalization driven by digital transformation, liberalization of trade, and the rise of emerging economies. Yet, the landscape remains volatile due to political tensions, climate challenges, pandemics, and rapid technological disruption. Thus, global market insights today involve balancing opportunity with risk, short-term speculation with long-term sustainability.
2. The Structure of the Global Market
The global market is not a single unified entity but a network of interdependent systems. Its structure is defined by several core components:
a. Financial Markets
These include global exchanges for stocks, bonds, currencies, and derivatives. The major financial centers—New York, London, Tokyo, Hong Kong, and Singapore—drive liquidity and capital allocation worldwide. Financial markets influence investment decisions, currency valuations, and risk sentiment, often serving as early indicators of economic health.
b. Commodity Markets
These markets handle the trading of raw materials such as oil, gold, agricultural goods, and metals. Commodity prices are vital indicators of global supply-demand balance and economic activity. For instance, oil price fluctuations impact energy costs, inflation, and geopolitical stability.
c. Trade Networks
International trade forms the lifeblood of the global economy. Institutions such as the World Trade Organization (WTO) and regional trade agreements (e.g., USMCA, EU Single Market, ASEAN) shape cross-border exchange rules. Global supply chains connect producers and consumers across continents, emphasizing efficiency but also exposing vulnerabilities during crises.
d. Labor and Human Capital
A globally mobile workforce enables talent optimization, outsourcing, and competitive labor markets. Countries like India, the Philippines, and Vietnam have emerged as service and manufacturing hubs due to skilled labor and cost advantages.
e. Technological Ecosystems
Digital platforms, AI, and automation redefine how markets function. Technology companies now dominate global capitalization rankings, with firms such as Apple, Microsoft, and Tencent leading innovation-driven growth.
3. Key Drivers of Global Market Dynamics
Several forces collectively shape the global market environment. Understanding these drivers provides insight into long-term investment and policy trends.
a. Globalization and Trade Liberalization
Trade liberalization has historically propelled global economic growth by reducing tariffs and barriers. However, recent trends of protectionism and “friend-shoring” (relocating supply chains to allied nations) have created new trade dynamics. Countries are balancing globalization benefits with domestic economic security.
b. Technological Innovation
Artificial intelligence, blockchain, green energy, and biotechnology are revolutionizing productivity and business models. Fintech innovations democratize finance, while automation enhances manufacturing efficiency but also disrupts traditional labor markets.
c. Monetary Policy and Interest Rates
Central banks, particularly the U.S. Federal Reserve, European Central Bank, and Bank of Japan, influence global liquidity through interest rate policies. Low-rate environments stimulate investment, while tightening cycles tend to slow growth and shift capital flows.
d. Geopolitical Tensions
Conflicts, trade wars, and sanctions significantly affect global stability. For instance, U.S.-China rivalry shapes global technology access, supply chains, and foreign investment patterns. Similarly, regional conflicts like those in Eastern Europe and the Middle East disrupt energy supplies and commodity prices.
e. Environmental and Climate Considerations
Climate change has emerged as both a risk and an opportunity for global markets. Green energy investments, carbon pricing, and sustainable finance are transforming industries. Companies increasingly adopt ESG (Environmental, Social, Governance) frameworks to align profitability with sustainability.
4. Regional Market Insights
a. North America
The United States remains the world’s largest economy, driven by innovation, consumer spending, and strong financial markets. Canada complements this with robust energy and resource exports. North American markets are characterized by technological dominance, resilient consumption, and deep capital markets, though debt levels and political polarization pose risks.
b. Europe
Europe’s markets are defined by regulatory strength and industrial diversity. The European Union (EU) remains a global trade powerhouse, but it faces challenges such as slow growth, aging populations, and energy dependency. The post-Brexit landscape continues to redefine trade and financial dynamics.
c. Asia-Pacific
Asia is the epicenter of global growth. China’s transition from manufacturing to consumption-driven growth, India’s digital and service-led expansion, and Southeast Asia’s emerging consumer economies drive demand and innovation. Japan and South Korea continue to lead in technology and advanced manufacturing.
d. Latin America
Rich in natural resources, Latin America’s growth is often tied to commodity cycles. Political instability and inflation challenges persist, yet nations like Brazil, Chile, and Mexico are modernizing their industries and integrating more deeply into global value chains.
e. Africa and the Middle East
Africa’s markets offer high growth potential due to demographics and natural resources. However, infrastructure deficits and governance issues limit progress. The Middle East remains energy-centric, but nations like Saudi Arabia and the UAE are diversifying into tourism, technology, and renewable energy.
5. Global Market Trends and Transformations
a. Digitalization and E-Commerce
E-commerce, digital payments, and data-driven marketing have reshaped consumer behavior. Platforms such as Amazon, Alibaba, and Shopify integrate technology with logistics, enabling borderless retail markets.
b. Shift to Green Economies
Sustainable finance and renewable energy investments are accelerating. Electric vehicles, solar energy, and carbon credit markets exemplify the shift from fossil fuels toward decarbonized economies.
c. Rise of Emerging Markets
Emerging economies contribute over 60% of global GDP growth. Rapid urbanization, expanding middle classes, and technological adoption make these regions central to future global demand.
d. Supply Chain Realignment
COVID-19 exposed vulnerabilities in global supply chains. Companies now diversify sourcing through “China+1” strategies, reshoring, or nearshoring to enhance resilience.
e. Financial Digitalization
The global financial system is undergoing a technological revolution—cryptocurrencies, central bank digital currencies (CBDCs), and decentralized finance (DeFi) redefine how value is exchanged and stored.
6. Challenges in the Global Market
a. Economic Inequality
Globalization has lifted millions out of poverty but also widened income gaps. Developed nations face stagnating wages, while emerging markets grapple with uneven wealth distribution.
b. Inflation and Debt Pressures
Post-pandemic stimulus and geopolitical disruptions have driven inflationary pressures. High public and private debt levels threaten fiscal stability in several economies.
c. Geopolitical Fragmentation
Rising nationalism, trade barriers, and regional conflicts threaten global cooperation. The move toward multipolarity—where power is distributed across multiple regions—complicates policy coordination.
d. Technological Disruption
While innovation fuels growth, it also causes displacement. Automation, AI, and robotics could replace millions of jobs, demanding urgent skill development and policy adaptation.
e. Environmental Risks
Climate change, resource depletion, and extreme weather events increasingly disrupt markets. Sustainable investment and risk mitigation are becoming essential components of global economic strategy.
7. Opportunities in the Global Market
a. Green and Renewable Technologies
Investing in renewable energy, electric vehicles, and sustainable infrastructure offers massive long-term potential. Global climate policies encourage public-private collaboration in this sector.
b. Digital Transformation
AI, IoT (Internet of Things), 5G, and cloud computing provide opportunities for companies to enhance efficiency and innovation. Digitalization also opens new frontiers in fintech, healthcare, and education.
c. Emerging Market Expansion
Asia, Africa, and Latin America present enormous consumer and investment opportunities. Infrastructure development, mobile banking, and digital entrepreneurship are rapidly scaling.
d. Healthcare and Biotechnology
The pandemic accelerated innovation in healthcare, telemedicine, and biotechnology. Aging populations and increased health awareness drive continued global demand.
e. Financial Inclusion and Fintech
Fintech startups are democratizing access to financial services. Mobile payments, digital lending, and blockchain solutions bridge the gap for unbanked populations.
8. The Role of Policy and Global Institutions
Global markets depend on policy coordination and institutional support. Organizations such as the IMF (International Monetary Fund), World Bank, WTO, and OECD provide frameworks for trade, investment, and development. Meanwhile, regional alliances—like the EU, ASEAN, and BRICS—enhance collective bargaining power.
Monetary policies from leading central banks influence global liquidity. Regulatory bodies now emphasize transparency, cybersecurity, and ESG standards to safeguard global market stability. Effective governance remains essential to mitigate systemic risks and foster inclusive growth.
9. The Future Outlook
The future of global markets will be defined by adaptation—economic, technological, and environmental. We are entering a multipolar world, where economic influence is shared among the U.S., China, the EU, and emerging economies. Technology will continue to integrate markets, but digital sovereignty and cybersecurity will emerge as major battlegrounds.
Artificial intelligence and automation will revolutionize industries, while green transitions redefine energy and transportation systems. However, sustained global growth depends on balancing profit with sustainability, and innovation with inclusivity.
Global markets are likely to remain volatile in the short term due to inflation cycles, geopolitical uncertainty, and climate challenges. Yet, long-term prospects remain positive, driven by human ingenuity, digital innovation, and cross-border collaboration.
10. Conclusion
Global market insights reveal a dynamic, interconnected, and ever-evolving system that mirrors humanity’s economic ambitions and collective challenges. The interplay of technology, policy, and capital continues to transform industries and societies. While globalization has delivered prosperity and innovation, it also presents new risks—economic inequality, environmental degradation, and political fragmentation.
The key to thriving in the global market lies in adaptability, diversification, and sustainable strategy. Businesses, investors, and governments must embrace change, leverage digital transformation, and commit to ethical and resilient growth models. In this intricate web of interdependence, understanding global market insights is not just an academic pursuit—it is a strategic necessity for the future of global prosperity.
silver longsgold and silver have been selling off for quite some time now anyone with a brain will tell you the dump cannot go on forever. I might be entering early but im confident in the price action and so I will take the longs.

latest mtops-ai Bitcoin Forecast suggests downtrend cont'It appears we have lower highs and lower lows incoming
Today I've included the time and the price values for the next transition
The time value is expressed via the vertical trendline underneath the next price reversal (see chart)
The price is expressed with the Entry, Stop Loss and Target values along the y-axis (price column)

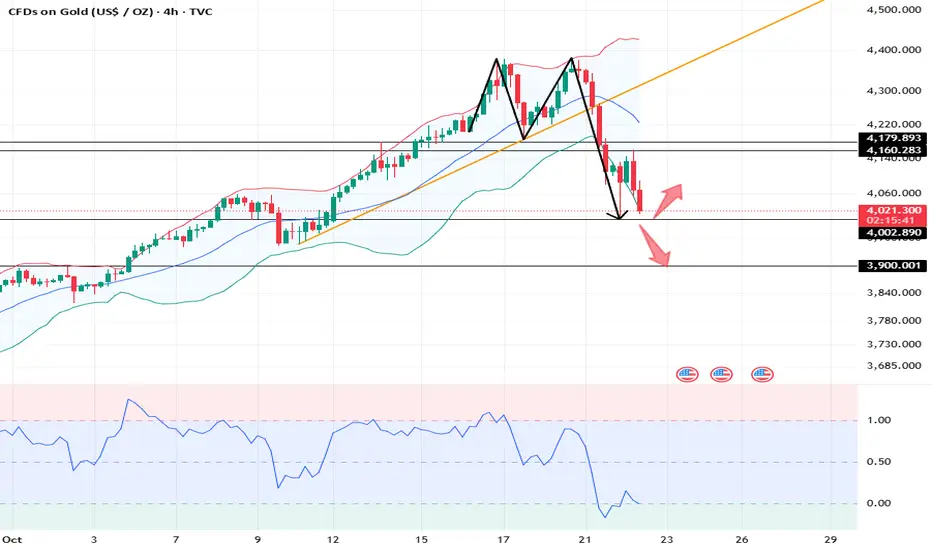
XAUUSD: Market Analysis and Strategy for October 22Gold Technical Analysis
Daily Resistance: 4380, Support: 3900
4-Hour Resistance: 4180, Support: 4000
1-Hour Resistance: 4160, Support: 4000
Technically, gold fell by $380, temporarily halting its decline near 4000. Technical indicators are recovering, and the market is taking a brief breather. Bull markets are prone to large swings, so it's unclear whether gold has truly reversed in the short term.
Gold has tested the 4000 support level twice. Watch for the continuation of the short-term downtrend. The moving average price has broken through the upward trend line in the short term, and the indicators are in a state of recovery, but the Bollinger Bands remain upward. The 4170/4180 levels on the daily chart are key. If they are successfully recaptured, the market is poised for a strong bullish resurgence. Otherwise, the market will continue to fluctuate downwards in the short term, looking for support. Focus on the 4000 level. If it breaks below, it will continue to move towards 3900.
Looking at the 1-hour chart, the candlestick pattern has broken below the neckline of the M-shaped top. Market bearish sentiment is being released, and indicators continue to move downward rapidly. The short-term bull-bear dividing line is between 4188 and 4208. Short-term rebound momentum is limited, and the NY market remains bearish.
Trading Strategy:
BUY: 4000-4005near
SELL: 4160near
SELL: 4178near
More Shares →