another incredible read of the market here from the MTOPS AIYet another incredible read of the market here from the MTOPS AI, demonstrating pinpoint accuracy in its latest Bitcoin forecast.
The AI's analysis continues to outperform, capturing crucial shifts and ensuring top-tier results for traders.
Gann

CirclesHere are two circles drawn on the Bitcoin chart. Lets see if it wants to escape upwards or get absorbed by the small one.

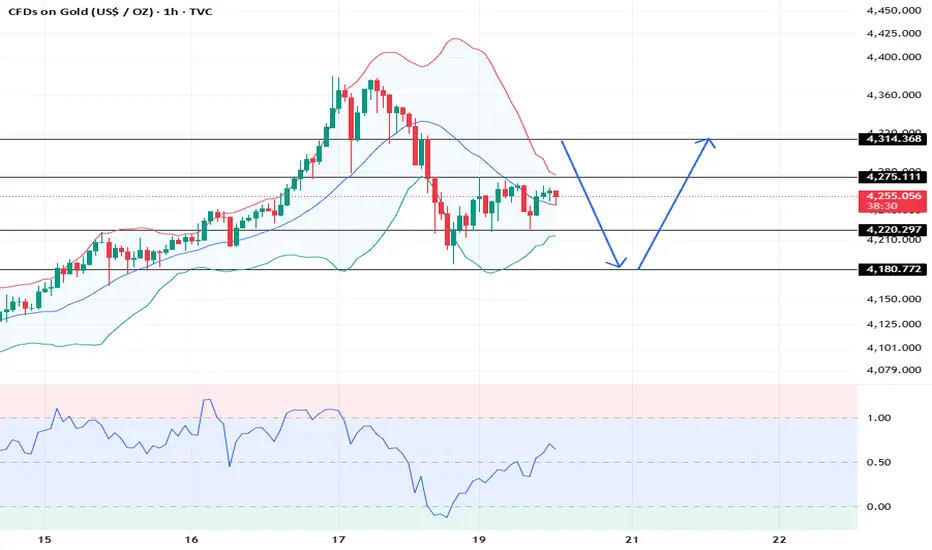
XAUUSD: Market Analysis and Strategy for October 20Gold Technical Analysis
Daily Resistance: 4380, Support: 4100
4-Hour Resistance: 4314, Support: 4180
1-Hour Resistance: 4275, Support: 4220
Last Friday, gold prices retreated after hitting $4380, dropping nearly $200 intraday to a low of around $4186.
The decline stems from both the previous excessive price increase and the strengthening US dollar and tariff policy changes. Regardless, this significant decline in gold prices is bound to raise market concerns about future trends.
From the weekly chart, despite a sharp rise, the market retreated after a surge. Friday's daily chart nearly reversed Thursday's gains.
The 4-hour MACD indicator formed a downward death cross, suggesting that short-term market volatility is at least inevitable.
What is certain is that the bull market in gold's major cycle has not ended. This so-called major cycle is measured on an annual basis, meaning next year's average price will undoubtedly be higher than this year's. As for whether the market will continue to fall this week, this possibility cannot be ruled out. After this week's rebound, if it fails to hold above 4300, there is still a chance that it will test the 4200 or even 4100 levels below.
For intraday trading, sell high and buy low. The market is expected to fluctuate and consolidate.
Selling range:
SELL: near 4275
SELL: near 4315
BUY: near 4220
BUY: near 4180
More analysis👉
“SPX – 750-Point Range in Play”Date: 20-10-2025
#SPX - Current Price: $6,664.00
Pivot Point: $6,656.59 Support: $6,518.03 Resistance: $6,796.21
Upside Levels:
L1: $6,938.02 L2: $7,079.83 L3: $7,238.55 L4: $7,397.26
Downside Levels:
L1: $6,375.69 L2: $6,233.35 L3: $6,074.64 L4: $5,915.92
#SPX #TRADINGVIEW #DJI #NDQ # NIFTY

Dow JonesUS 30 - DJI
- Completed " 12345 " Impulsive Waves and " AB " Impulsive Waves
- RSI - Divergence
- Bullish Channel as an corrective pattern in Short Time Frame
- Order Block
- Change of Characteristics

FIL/USDT – Bullish Reversal Setup
Price held strong at the key demand zone with a falling wedge breakout.
📍 Entry Zone: ~$1.50–$1.60
🟢 Breakout Signal Confirmed
🔁 Expected Retrace: Back to 0.618–0.5 Fibo before next leg up
🎯 Target Range: Above $2.00+

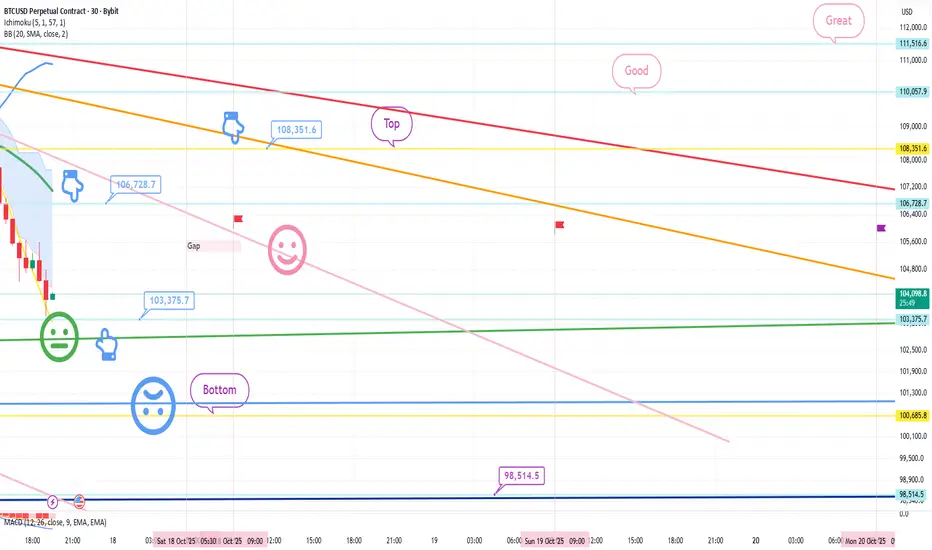
October 17 Bitcoin Bybit chart analysisHello
It's a Bitcoin Guide.
If you "follow"
You can receive real-time movement paths and comment notifications on major sections.
If my analysis was helpful,
Please click the booster button at the bottom.
This is Bitcoin's 30-minute chart.
There are no Nasdaq data releases today.
Bit has been falling sharply since yesterday and today, as it has been coupled with the Nasdaq.
I've been thinking a lot about the possibility of further declines.
*When the light blue finger moves,
Bidirectional neutral
Short->Long switching or final long position strategy
1. $106,728.7 short position entry point / Stop-loss price upon breaking the pink resistance line
2. $103,375.7 long position switching / Stop-loss price upon breaking the green support line
3. Long position target prices, starting from the top section at the top
If the price falls immediately without touching the short entry point at 106.7K,
the final long position is at the bottom section at the bottom.
The bottom section is a double bottom, where the previous low is broken.
Because the lower tail may be pushed to $98,514.5, indicated at the bottom,
rather than placing a limit order,
we recommend switching long positions after confirming a trend reversal on the 5-minute chart.
More importantly, the Nasdaq movement appears to be the most important. It's frustrating that Bitcoin is coupled with the Nasdaq, which plummets at crucial moments, but it seems the coin market has never been easy.
At least if you're trading in real time, in a market where some people lose money while others make money, giving up would only hurt you.
In times like these, it's crucial to stay focused and practice principled trading and stop-loss orders.
Thank you for your hard work this week.
EURCAD SWING Trade Forecast
Pair: EURCAD
Direction: Long (Buy Bias)
Forecast Entry Zone: Around 1.6100 to 1.6000
Forecast Stop Loss: Below 1.5750
Forecast Take Profit 1: 1.6560
Forecast Take Profit 2: 1.7038
Expected Risk to Reward: Around 1 to 3.8/7
Timeframe: Daily (Swing Forecast)
Date: October 2025
My Outlook
I am forecasting a continuation of the bullish trend on EURCAD following the recent pullback. The pair has shown consistent strength after breaking structure to the upside, and the current correction appears to be a normal retracement rather than a trend reversal.
The key zone I am watching is between 1.6100 and 1.6000, which aligns closely with the 50 and 61.8 percent Fibonacci retracement levels. This is a strong area of previous demand and also where the market last generated an impulsive bullish move.
I am expecting buyers to step back in around that zone and push the pair higher toward the next liquidity levels around 1.6560 and ultimately 1.7038, which aligns with the 100 percent extension level.
Technical View
The structure is bullish and well defined. The Break of Structure confirmed the start of a new upward leg earlier in the cycle, and since then, price has been forming higher highs and higher lows.
At the moment, price has reached a temporary resistance near 1.6360, where short term profit taking occurred. This pullback is likely to offer a new buying opportunity once price retraces deeper into the fair value region between 1.6100 and 1.6000.
The 61.8 percent retracement at 1.6006 serves as the last line of confluence before invalidation. My stop will sit safely below 1.5750, where a break would indicate a possible shift in structure and invalidate this bullish forecast.
As long as price holds above that zone, I expect the uptrend to resume with momentum.
Fundamental View
The broader macro picture currently supports a stronger euro against the Canadian dollar.
Positive drivers for this forecast:
The European Central Bank remains cautious but has signaled that interest rates will stay relatively elevated for a while, which supports the euro.
Oil prices have been slightly softer recently, which tends to weaken the Canadian dollar since CAD is closely tied to crude exports.
If risk sentiment stays stable and European economic data continues to show resilience, EURCAD could extend higher.
Possible risks to this outlook:
A strong rebound in oil prices could boost CAD and slow the bullish momentum.
Any dovish shift from the European Central Bank or weak Eurozone data could weigh on the euro.
If global risk sentiment drops and demand for the Canadian dollar increases, this could temporarily pressure the pair lower.
Despite these risks, the balance of technical and fundamental evidence supports a bullish continuation.
My Forecast Plan
My plan is to wait patiently for price to retrace toward the 1.6100 to 1.6000 demand zone. I will look for bullish confirmation such as a clear rejection or a strong engulfing candle on the four hour chart before entering long.
My first take profit level is 1.6560, which represents a key liquidity target and prior resistance zone. If momentum remains strong, I will aim for the 1.7038 area as the extended projection.
The invalidation point is clearly defined below 1.5750. A daily close under that level would indicate a structural change, and I will reassess the forecast at that point.
My Thoughts
This setup aligns perfectly with my trading principles ; clean structure, logical retracement, and a clear invalidation level. The 1.6100 to 1.6000 zone is a fair value area where I expect new accumulation to take place.
The risk to reward ratio on this forecast is solid, and I like the clarity of both technical and fundamental alignment. If the pair holds its bullish structure, this could be a strong continuation play toward 1.70 in the coming months.
As always, patience will be key. I will allow the market to pull back into my forecast zone rather than chasing price at current levels.

Symmetrical Triangles are high risk to trade within Symmetrical Triangles are high risk to trade within
My advise is to allow it to play out first, and after we have confirmation that it is a Symmetrical Triangle, then lets re-evaluate

#KDA/USDT bullish structure formed at the chart#KDA
The price is moving within a descending channel on the 1-hour frame, adhering well to it, and is heading for a strong breakout and retest.
We have a bearish trend on the RSI indicator that is about to be broken and retested, which supports the upward breakout.
There is a major support area in green at 0.2170, representing a strong support point.
We are heading for consolidation above the 100 moving average.
Entry price: 0.2184
First target: 0.2245
Second target: 0.2294
Third target: 0.2364
Don't forget a simple matter: capital management.
When you reach the first target, save some money and then change your stop-loss order to an entry order.
For inquiries, please leave a comment.
Thank you.


Monday's Gold Price Fluctuation AnalysisMonday's Gold Price Fluctuation Analysis
Gold prices fell sharply after hitting an all-time high of $4,379 and are currently fluctuating around $4,234, signaling a short-term correction.
Gold prices are facing downward pressure at high levels due to profit-taking, concentrated long positions, and overbought short-term technical indicators.
Upside Resistance: Focus first on the $4,275-4,280 area, followed by $4,300-4,305. Gold prices need to successfully break through these levels to regain strength.
Downside Support: Key support lies near $4,215-4,220. A break below this level could lead to a further correction to the stronger support range of $4,180-4,190.
Trading Strategy:
• Short Opportunity: Consider a small short position if gold prices rebound to the $4,275-4,280 area and show signs of weakness (such as a bearish candlestick pattern).
• Long opportunities: If gold prices fall back to the $4,180-4,190 support area and show signs of stabilization (such as a bullish rebound on the 15-minute chart or 1-hour chart), consider trying a light long position.

FRGNT FOCUS PAIR -GBPUSD FRGNT Forecast Q4 | W43 | D20 | Y25📅 Q4 | W43 | D20 | Y25 |📊 GBPUSD FRGNT Forecast
📉 Market Insight – GBPUSD / Daily Outlook
👉FRGNT FOCUS PAIR TODAY ! 📉
🔁 Retest of PWH (Previous Weekly High) leading to a rejection from the Daily 50 EMA.
📊 ASIA Session has created a large range, with current price sitting right where we need it ahead of London.
⚠️ Do not jump in early — wait for a clear Break of Structure (BoS) during the London session.
❌ If there’s no confirmed BoS, be patient and await a tap of the PWH before looking for the rollover short setup. Lower time frame BoS is enough confluences for the short from the absolute highs.
🎯 Key takeaway: Let structure lead the way — stay patient, wait for confirmation, and execute cleanly.
🔍 Analysis Approach:
I’m applying Smart Money Concepts, focusing on:
Identifying Points of Interest on the Higher Time Frames (HTFs) 🕰️
Using those POIs to define a clear trading range 📐
Refining those zones on Lower Time Frames (LTFs) 🔎
Waiting for a Break of Structure (BoS) for confirmation ✅
This method allows me to stay precise, disciplined, and aligned with the market narrative, rather than chasing price.
💡 My Motto:
"Capital management, discipline, and consistency in your trading edge."
A positive risk-to-reward ratio, paired with a high win rate, is the backbone of any solid trading plan 📈🔐
⚠️ Losses?
They’re part of the mathematical game of trading 🎲
They don’t define you — they’re necessary, they happen, and we move forward 📊➡️
🙏 I appreciate you taking the time to review my Daily Forecast.
Stay sharp, stay consistent, and protect your capital
— FRNGT 🚀
FX:GBPUSD

Sideways No More?Waypoint REIT (WPR) has been range bound for nearly six years, but the current structure hints at a potential breakout. Price has retraced to the top of the long-term range and is now finding support at two key 50% levels projected from major swing highs and lows.
Trade Scenario 1: Aggressive Entry
Entry: Current levels
Stop Loss: Just below the bullish engulfing candle from the week ending 19 Oct
Target: Initial TP just under the yearly R2 pivot. Beyond that, trail your stop below new swing lows to manage risk.
Minimum Range Target: $3.70
This setup favors traders looking to front run the breakout with tight risk control.
Trade Scenario 2: Conservative Confirmation
Entry: Wait for a clean breakout and hold above the $2.82 high
Stop Loss & Targets: Same as above initial TP near R2, then trail stops with structure
This approach suits those prioritizing confirmation over early positioning.

BTCUSD(Weekly): Price RealignmentIn ICT methodology, true consistency comes when your Supply & Demand zones align with the Higher Timeframe (HTF) bias and the External-to-Internal Liquidity cycle.
The Higher Timeframe Dictates Context
The HTF identifies the directional bias — the broader institutional narrative. If daily or 4H structure is bullish, internal retracements on the 1H or 15M are just liquidity collection phases before continuation. Going against this bias means fighting smart money flow.
ICT’s Internal vs External Liquidity in Context
External Liquidity: lies above/below major highs/lows — where stop hunts occur before re-aligning with the HTF narrative.
Internal Liquidity: exists within the range — in Fair Value Gaps (FVGs) or unmitigated zones used by institutions to rebalance after sweeping external liquidity.
Realignment Using Supply & Demand Zones
When price sweeps external liquidity against the trend, watch for return into a HTF demand/supply zone or FVG — that’s where smart money realigns internal order flow back toward the trend.
Example:
In an uptrend, a sweep below an internal low triggers liquidity collection.
Price then rebalances into a demand zone aligned with the HTF, creating a precision continuation point.
The best trades often unfold after liquidity grabs and realignment into the HTF direction.
🔥 Master the rhythm: External sweep → Internal rebalancing → HTF continuation.
USDJPY Daily / Weekly trade setup (20/10)In today’s USDJPY breakdown, I’m focusing on short setups as price action shows signs of exhaustion at the top. I cover key resistance levels, potential reversal zones, and the intraday targets I’ll be watching as the pair looks set for a pullback. As always, happy trading everyone.

Tata motors keep an eyeTatamotors seems to be creating a bottom and potentially can go upside from here.
its holding 50% fib levels, and seems to be creating a bottom over here

USDJPY LONG (JPYUSD SHORT)1300 PIPS!Looks like a strong short setup with a clean retest under institutional level structure, bearish weekly bias confirms downside probable move, valid.

My USD/CAD Trade Report — October 2025I’m positioning long on USD/CAD, planning an entry around 1.3930–1.3960. My stop loss is set near 1.3830, and I’m targeting 1.4245 first, with potential extension to 1.4388. This trade gives me a solid 1:3 risk-to-reward ratio, risking about 120 pips for over 350 pips of upside.
Technically, the pair is in a steady uptrend, printing higher highs and higher lows since mid-2025. The breakout above 1.3850–1.3900 confirms bullish continuation, and as long as price holds above 1.3830, the structure remains intact. I see 1.4050 as short-term resistance, but if momentum carries through, my targets at 1.4245 and 1.4388 come into play.
On the fundamentals, the setup still favour's USD strength over CAD. The Federal Reserve is holding rates high around 5.25–5.5%, while the Bank of Canada faces pressure to cut further because domestic data is weak. Both Canadian manufacturing and services PMIs are in contraction territory below 50, showing a slowdown. Meanwhile, oil prices hovering between $60 and $70 are an added drag on the Canadian dollar, since lower energy prices cut into Canada’s trade balance. The U.S. economy continues to show resilience, which underpins USD demand.
This trade rests on the interest-rate gap, Canada’s soft data, and weak oil prices. The risks I’m watching are stronger-than-expected Canadian jobs or inflation data, a sudden rebound in oil above $80, or the Fed signalling earlier-than-expected cuts.
Overall, I’m moderately bullish USD/CAD through Q4 2025. As long as 1.3830 holds, I’ll stay with the long bias. My plan is to scale out partial profits near 1.41 and ride the remaining position toward 1.42–1.44.

REVERSAL TRADE SET UP ANGEL ONEIf 25489 Breaks Can See 2470 AND 2455, TRADING REVERSAL With SL AS 2495 In 1 Hour Candle Closing.
Disclaimer
I am not a SEBI-registered analyst or advisor.
The content shared is purely for educational and informational purposes only.
should not be considered as investment or trading advice.
Trading and investing in financial markets involve risk.
Profits and losses are part of the process. You are solely responsible for any decisions you make,
and it is important to assess your risk tolerance and do your own due diligence before making,
any trades or investments.
Be safe with your capital. Stay disciplined. Stay invested.

BTC WEEKLY OUTLOOK - TARGETS & TIME RESISTANCEAs long as Bitcoin holds above 98,200, upside remains open with targets at 129,130 and 135,000.
Watch Oct 27, 2025, marked as a key time resistance (W-1, W-W, W+1). This date can also flip into an inversion, so price action around it will be decisive.

GOLD - BEARS PREPARING FOR THE NEXT MOVEGold has reached a strong resistance level around 4,380 and is currently showing signs of a pullback. After nine consecutive weeks of gains without a single red candle—a rare occurrence in gold’s history—market participants should anticipate a potential correction phase.
The 4,305–4,337 zone will be a key area to watch for a possible retest before the next move lower. If price fails to break above that zone, the downside targets remain at 4,110 and 4,040.
Overall bias stays bearish as long as gold trades below 4,380.

GBPJPY Trade Forecast
Pair: GBPJPY
Direction: Long (Buy Bias)
Forecast Entry Zone: Around 197.3 to 197.00
Forecast Stop Loss: 195.00
Forecast Take Profit 1: 205.26
Forecast Take Profit 2: 208.50
Expected Risk to Reward: About 1 to 3.5/5
Timeframe: Daily (Swing Forecast)
Date: October 2025
My Outlook
I am expecting GBPJPY to continue its broader bullish trend after completing this current corrective phase.
The area between 197.30 and 197.00 looks like a strong demand zone. It aligns with the 61.8 - 75 percent Fibonacci retracement levels, where previous liquidity was taken before the last push up. This is where I expect buyers to step back in.
My forecast is that price will find support within this zone and start building momentum again toward the upper levels around 205.26 and then 208.50.
Technical View
The market structure remains bullish. The break of structure earlier confirmed the uptrend, and price has since been correcting downward in a measured way. Nothing about this correction looks impulsive or bearish in nature.
My invalidation point is 195.00. If price closes below that level, it will signal a deeper correction or possible change in trend, which would invalidate this forecast.
As long as the structure stays intact, the probability of continuation remains high.
Fundamental View
The fundamental background continues to favor a stronger pound against the yen.
Positive factors supporting my outlook:
The Bank of England still holds relatively high interest rates, which supports the pound.
The Bank of Japan maintains an easy policy stance, and that keeps the yen weak.
Overall global sentiment is leaning risk on, which generally favors pairs like GBPJPY as investors move away from safe haven currencies.
There has been no sign of strong yen intervention from Japanese authorities, which allows the market to move more freely.
Possible risks to the forecast:
If the Bank of Japan surprises with a shift toward tightening, that could strengthen the yen quickly.
A turn in risk sentiment or any global uncertainty could bring safe haven flows into the yen.
If the United Kingdom data weakens or the Bank of England hints at rate cuts, the pound could lose strength.
Even with these risks, the balance of evidence still supports bullish continuation for now.
My Forecast Plan
I will be watching closely for bullish price action within the 197.30 to 197.00 zone. My focus will be on clear signs of rejection, such as a strong bullish candle close or a break in short term structure on the four hour chart.
Once price reacts positively, I expect it to move first toward 205.26, which is a previous swing high. From there, my extended projection is for price to continue higher to around 208.50, which represents the next major target and potential exhaustion point for this leg.
If price closes below 195.00, I will consider this forecast invalid and wait for a new setup to form.
My Thoughts
I like how this forecast lines up technically and fundamentally. The structure is clean, the risk is well defined, and the potential reward is worth the patience it requires.
I feel confident waiting for the market to come into my zone rather than chasing price near the highs. The to 197.00 area offers a fair value entry within the broader trend, and that is where I want to see confirmation before committing.
The key is patience and discipline. If the forecast plays out, it will reward both. If it fails, the loss will be controlled and within plan. Either way, the process will remain consistent.
