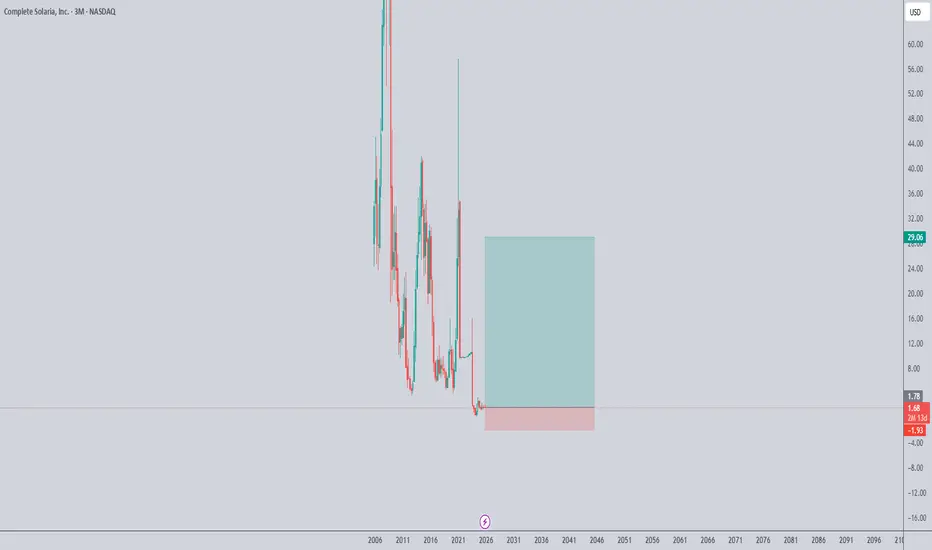
The sun doesn't send billsThe sun doesn't send bills. If you can capture it and sell it, you have a business.
Gann
USDJPY SWING Trade ForecastPair: USDJPY
Direction: Long (Buy Bias)
Forecast Entry Zone: Around 144.00
Forecast Stop Loss: 139.60
Forecast Take Profit 1: 157.30
Forecast Take Profit 2: 166.70
Expected Risk to Reward: Around 1 to 3.7-5
Timeframe: Daily (Swing Outlook)
Date: October 2025
My Outlook
I am expecting USDJPY to continue its long term uptrend after completing a deep corrective phase. The pair has been bullish since breaking structure earlier this year, and the recent pullback looks like a healthy retracement rather than a full reversal.
Price is now approaching a key demand zone near 144.00, which aligns with the 61.8 percent Fibonacci retracement of the last major impulse. This level also holds previous liquidity and institutional activity, which makes it a strong area for potential accumulation.
My expectation is that buyers will step in around this zone and drive price back toward the previous highs around 153.00 before pushing further to new levels near 166.70.
Technical View
The structure on the higher time frames remains bullish. I see a series of higher highs and higher lows that are still intact. The move into the 144 area looks corrective, which is consistent with a pullback phase in a continuing trend.
I expect price to show signs of rejection or reversal within the 144 zone. Once that happens, I plan to project bullish continuation targets at 157.30 and 166.70. A sustained close below 139.60 would invalidate this forecast and signal a possible deeper correction or full reversal.
The technical setup supports a high probability for a bullish continuation as long as structure remains protected.
Fundamental View
The fundamental backdrop still favour's a stronger United States dollar against the Japanese yen.
Supporting factors for my bullish outlook:
The Federal Reserve is maintaining a firm stance on interest rates, which continues to support the dollar.
The Bank of Japan remains accommodative, showing limited urgency to tighten monetary policy.
Global risk sentiment is improving, which usually weakens the yen as investors seek higher yielding assets.
Japanese authorities have expressed concern about volatility but have not shown active intervention to support the yen.
Factors that could work against my forecast:
Any sudden move by the Bank of Japan toward policy tightening could strengthen the yen.
Weak United States data could pressure the dollar and limit upside movement.
If risk sentiment shifts toward fear or uncertainty, safe haven demand could strengthen the yen.
A surprise intervention by Japanese officials could temporarily halt upward movement.
Overall, the fundamental tone supports continued dollar strength and yen weakness, which aligns well with my technical expectation for a bullish continuation.
My Forecast Plan
I expect price to react to the 144.00 zone with a bullish rejection. I will be watching for strong confirmation candles or a shift in structure on the lower time frames.
My forecast target for the first major move is 157.30, which represents a previous high and a key area of resistance. My extended projection is 166.70, which is based on a full measured move of the last bullish impulse.
If the pair breaks below 139.60, it will invalidate my bullish forecast and suggest a larger corrective phase instead.
My Thoughts
This forecast reflects patience and confidence in both the technical and fundamental alignment of USDJPY. I am not chasing price at the highs but waiting for the market to return to a fair value zone where long positions make more sense.
The 144.00 area represents a discount zone within the overall trend. I believe this area offers one of the best risk to reward opportunities on this pair for the coming weeks and possibly months.
If the expected reversal occurs, this move could develop into a large scale swing continuation toward new highs.

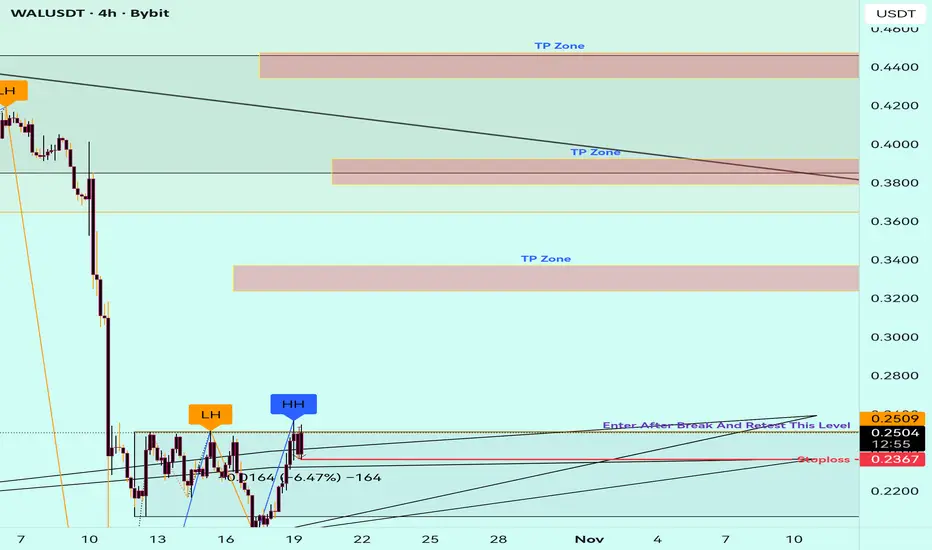
WAL – Technical Outlook: Key Levels, Market StructureWestern Alliance Bancorporation (WAL) is a regional U.S. bank listed on the NYSE, known for serving commercial and real estate clients across the western states. The company’s fundamentals show stable earnings and moderate growth, though the stock remains sensitive to interest rate policy and financial sector sentiment.
In this analysis, we review technical structure, price action, and potential breakout/reversal zones using multi-timeframe confluence, RSI momentum, and volume flow. The chart highlights areas of interest for both short-term and swing perspectives.
📊 Key Focus: Support–Resistance Dynamics, Trend Confirmation, RSI Divergence, and Volume Reaction Zones.
⚠️ Disclaimer: This content is for educational purposes only and does not constitute financial advice. Always perform your own due diligence before making investment decisions.
#WAL #WesternAllianceBancorporation #Stocks #TechnicalAnalysis #TradingView #SwingTrading #MarketStructure #PriceAction #VolumeAnalysis #RSI #Breakout #Finance #Investing
EURGBP W43 FRGNT Forecast -Q4 | W43 | Y25|📅 Q4 | W43 | Y25|
📊 EURGBP W43 FRGNT Forecast
🔍 Analysis Approach:
I’m applying Smart Money Concepts, focusing on:
Identifying Points of Interest on the Higher Time Frames (HTFs) 🕰️
Using those POIs to define a clear trading range 📐
Refining those zones on Lower Time Frames (LTFs) 🔎
Waiting for a Break of Structure (BoS) for confirmation ✅
This method allows me to stay precise, disciplined, and aligned with the market narrative, rather than chasing price.
💡 My Motto:
"Capital management, discipline, and consistency in your trading edge."
A positive risk-to-reward ratio, paired with a high win rate, is the backbone of any solid trading plan 📈🔐
⚠️ Losses?
They’re part of the mathematical game of trading 🎲
They don’t define you — they’re necessary, they happen, and we move forward 📊➡️
🙏 I appreciate you taking the time to review my Daily Forecast.
Stay sharp, stay consistent, and protect your capital
— FRNGT 🚀
FX:EURGBP

Buy Plan — Rabigh Refining & Petrochemical Co.🟢 Buy Plan — Rabigh Refining & Petrochemical Co.
Bias: Bullish — breakout confirmed above the previous consolidation range.
Preferred Entry Zone:
Wait for a pullback into the grey demand zone (≈7.3 – 7.8).
Look for rejection candles or a bullish market structure shift on the Daily timeframe from this zone.
Entry Confirmation:
Bullish engulfing candle on Daily or
Break of short-term bearish swing high + FVG formation
Stop Loss:
Below the grey zone (around 6.9 or under the last swing low).
Targets:
Target 1: 10.60
Target 2: 14.67 (HTF target)
Invalidation:
A daily close below 6.9 cancels the bullish setup — stay flat.
Mindset:
Be patient for price to retrace; don’t chase the breakout candle. Let the market come to your zone first.

GBPUSD W43 FRGNT Forecast -Q4 | W43 | Y25|📅 Q4 | W43 | Y25|
📊 GBPUSD W43 FRGNT Forecast
🔍 Analysis Approach:
I’m applying Smart Money Concepts, focusing on:
Identifying Points of Interest on the Higher Time Frames (HTFs) 🕰️
Using those POIs to define a clear trading range 📐
Refining those zones on Lower Time Frames (LTFs) 🔎
Waiting for a Break of Structure (BoS) for confirmation ✅
This method allows me to stay precise, disciplined, and aligned with the market narrative, rather than chasing price.
💡 My Motto:
"Capital management, discipline, and consistency in your trading edge."
A positive risk-to-reward ratio, paired with a high win rate, is the backbone of any solid trading plan 📈🔐
⚠️ Losses?
They’re part of the mathematical game of trading 🎲
They don’t define you — they’re necessary, they happen, and we move forward 📊➡️
🙏 I appreciate you taking the time to review my Daily Forecast.
Stay sharp, stay consistent, and protect your capital
— FRNGT 🚀
FX:GBPUSD

Buyer’s Alert Plan — PAK ELEKTRON LTD (PAEL | W)🟢 Buyer’s Alert Plan — PAK ELEKTRON LTD (PAEL | W)
Wait for price to reach the Area of Interest (below 44).
No buying before this zone is tapped — patience is key.
Watch for a Daily Market Structure Shift (MSS).
Look for a clear break of the last bearish swing high on the daily timeframe. That confirms buyers stepping in.
Confirm with Candle Behavior.
Two bullish rejections from the zone, or
A bullish FVG formation with volume support.
Entry Zone: Between 38–44, after MSS confirmation.
Stop Loss: Below the swing low inside the area of interest.
Target: 55 first, then 62 if momentum continues.
Invalidation:
Any weekly close below 35.19 invalidates the bullish setup — stay out.

EURUSD W43 FRGNT Forecast -Q4 | W43 | Y25|📅 Q4 | W43 | Y25|
📊 EURUSD W43 FRGNT Forecast
🔍 Analysis Approach:
I’m applying Smart Money Concepts, focusing on:
Identifying Points of Interest on the Higher Time Frames (HTFs) 🕰️
Using those POIs to define a clear trading range 📐
Refining those zones on Lower Time Frames (LTFs) 🔎
Waiting for a Break of Structure (BoS) for confirmation ✅
This method allows me to stay precise, disciplined, and aligned with the market narrative, rather than chasing price.
💡 My Motto:
"Capital management, discipline, and consistency in your trading edge."
A positive risk-to-reward ratio, paired with a high win rate, is the backbone of any solid trading plan 📈🔐
⚠️ Losses?
They’re part of the mathematical game of trading 🎲
They don’t define you — they’re necessary, they happen, and we move forward 📊➡️
🙏 I appreciate you taking the time to review my Daily Forecast.
Stay sharp, stay consistent, and protect your capital
— FRNGT 🚀
OANDA:EURUSD

I'm thinking down...waiting on confirmationIt's tough for anyone to work with flat market price action...
Looking at the dominant trend direction (HTF chart), it still suggests down overall.
It's best to apply patience and wait for confirmation
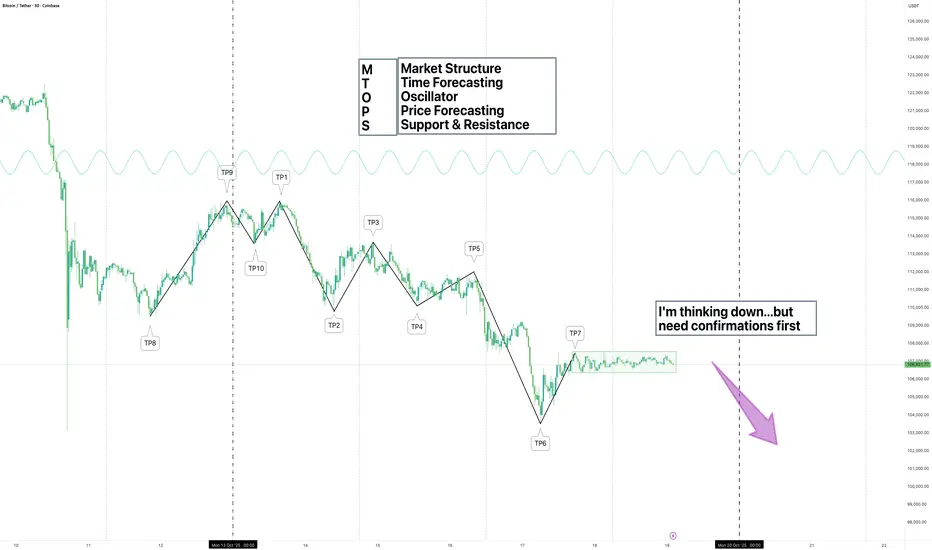
After build up comes a big move. I'm thinking DownBitcoin on the 30-minute chart has shown a period of consolidation, with price building up within a defined range. This type of price action often precedes a significant breakout or breakdown.
This idea rests on the expectation that the buildup of positions will trigger a sharp sell-off once momentum shifts.

MYXIt is silly to think as i have seen that MYX is a scam token, i think all the different part of this, i think MYX it is a very good opportunity, knowing that it has its own exchange, billions run into it last 2 weeks and watching the position that it is right now it makes me think that another big rally it will occur and it could be much bigger than the first one, and i regret i did not bought the first one...
please, do your own research before invest.
this is not financial advice

MASSIVE MOVE FOR ALTCOINS INCOMING GOD CANDLE Classic doji printed only a matter of time before we see a huge leg up on alts
WTI Technical Forecast: Critical Juncture at Multi-Month SupportSPOTCRUDE (WTI) Technical Forecast: Critical Juncture at Multi-Month Support
Analysis as of 18th Oct 2025 (Close: 57.715)
Market Context: Crude oil sits at a pivotal technical level. Geopolitical tensions provide a bullish fundamental backdrop, but the technical picture shows a market at a make-or-break support zone.
Multi-Timeframe Analysis (Top-Down View)
Swing Bias (D1/4H): Bearish Below $59.00
The daily chart paints a concerning picture. Price is trapped below all key EMAs (50 & 200), confirming a bearish trend structure. We are testing a major Wyckoff Accumulation Zone and a potential Bearish Bat Harmonic pattern completion near $57.50. The RSI is in bearish territory but approaching oversold, hinting at potential for a relief rally.
Intraday Bias (1H/30M): Neutral to Cautious Bullish
The 4H and 1H charts show consolidation after a sharp decline. The Ichimoku Cloud is thick resistance overhead, while the Anchored VWAP from the recent high confirms strong selling pressure. A break above the $58.20 level is needed to signal any short-term strength.
Key Chart Patterns & Theories in Play
Elliott Wave: The decline from the highs appears to be a clear 5-wave impulse down, suggesting we are completing Wave 5. This often precedes a significant corrective (A-B-C) rally.
Gann Analysis: The Square of 9 identifies $57.50 as a major harmonic support level. A break below targets $56.00 next.
Head and Shoulders? A large-scale pattern on the weekly chart has met its minimum target. The current price action could be the final leg of this move.
Bull Trap Risk: A swift bounce to $58.50-$59.00 that fails could trap eager bulls before the next leg down.
Actionable Trade Setups
🟢 Swing Trade (Counter-Trend Long)
Entry: $57.40 - $57.70 (Confluence with Harmonic & Gann Support)
Stop Loss: $56.90
Take Profit 1: $59.00
Take Profit 2: $60.00
🔴 Swing Trade (Momentum Short)
Trigger: A decisive 4H close below $57.30.
Entry: On retest of $57.50 as resistance.
Stop Loss: $58.10
Take Profit: $56.00
⚫ Intraday Long (Bounce Play)
Trigger: Bullish reversal candle (e.g., Hammer/Bullish Engulfing) on the 1H chart at $57.50 support.
Entry: On trigger candle close.
Stop Loss: $57.20
Take Profit: $58.40
Key Levels
Resistance 3: $60.00 (Psychological / 50 EMA)
Resistance 2: $59.00 (Ichimoku Cloud Base)
Resistance 1: $58.20 - $58.50 (Immediate Supply Zone)
Support 1: $57.50 - $57.70 (CRITICAL SUPPORT)
Support 2: $56.90 (Breakdown Trigger)
Support 3: $56.00 (Next Gann Target)
Conclusion
WTI is at a critical inflection point. The high-probability play is a bounce from the $57.50 support for a swing towards $59.00. However, a break below this level would signal a resumption of the broader downtrend. Trade the breakout/breakdown with clear confirmation.
Risk Warning: Trading crude oil involves high risk due to volatility and leverage. This analysis is for educational purposes and does not constitute financial advice. Always manage your risk and conduct your own due diligence.

ETH Double Top Breakdown
#Ethereum facing rejection from the $4,083.61 key resistance zone.
Bearish structure forming — potential for lower lows ahead 📉
🟥 Scenario Outlook:
🔁 Possible retest of broken support as resistance
🎯 Major target zone: $2,200 – $2,400
🕳 Mid-term bearish if weekly candle closes below $3,800

4USDTThis meme token, it is looking like accumulating and waiting to make the move, i think it will give 30-40% after getting out the triangle.
lets see the move.
NFA
DYOR

BioMarin Pharmaceutical✅ Strengths
The company has proven revenue growth and is now GAAP positive in recent periods, which is a sign of maturity for a biotech company.
BioMarin Investor Relations
Strong pipeline and significant clinical milestones: e.g. BMN 333 (for achondroplasia), BMN 401 (ENPP1 deficiency) – which if successful could significantly increase the value.
Investing.com
+1
Focus on rare diseases — a market with high prices and often less competition, which can lead to better margins.
Financial stability is relatively good for the sector — available resources, stable revenues, growing base.
⚠️ Weaknesses and risks
Competition: Other companies are developing therapies for the same diseases, which can limit market share and prices.
Investing.com
Dependence on clinical success and approvals: For biotech companies, it's crucial to know whether pipeline drugs will be approved and monetized — the risk is that a failed phase could significantly reduce value.
Valuation: While it looks reasonable on a revenue basis, there's still a long-term risk that growth could slow — for example, if approvals are delayed or the market changes.
Healthcare/Regulations: Biotechs are subject to regulatory risk, changing payment terms and market access.
Limited diversification: The core business is very focused on rare diseases — which is a plus, but also a risk because if one product doesn't deliver expected revenue, the group is exposed.

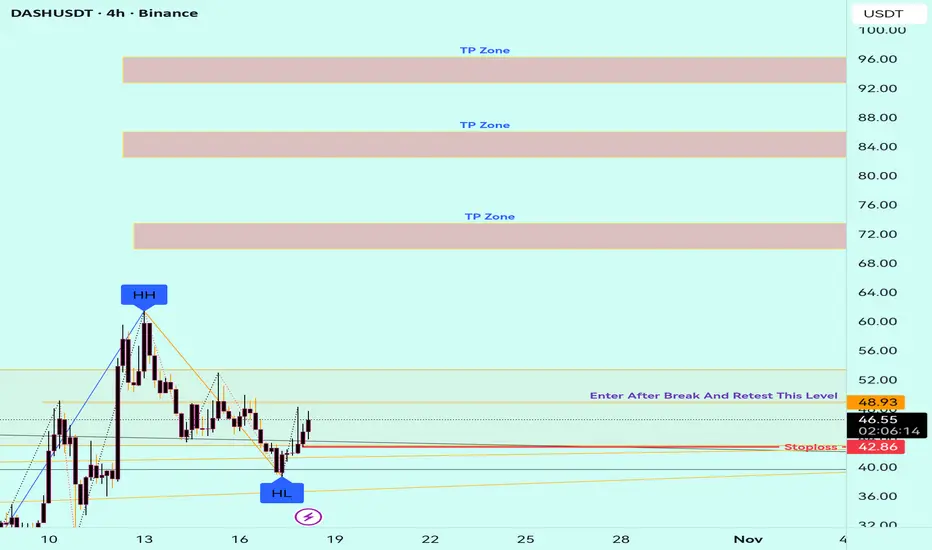
DASH (DASHUSDT) — Technical Breakout Setup & Key Levels
💡 Description:
DASH, one of the early privacy-focused cryptocurrencies, aims to provide fast and low-cost digital payments through its unique two-tier network and masternode system. Despite declining market attention compared to its peak years, DASH continues to maintain strong fundamentals in transaction efficiency and governance decentralization.
In this analysis, I highlight potential breakout zones, trend structure, and dynamic support/resistance areas. Key price levels will determine whether DASH continues its short-term bullish momentum or faces rejection near the upper range. Volume confirmation and RSI divergence are closely monitored for validation.
This setup is for educational and informational purposes only — not financial advice. Always do your own research and manage risk accordingly.
#DASH #DASHUSDT #CryptoAnalysis #PriceAction #TechnicalAnalysis #BreakoutTrading #RSI #ChartPatterns #CryptoTrading #Altcoins #MarketStructure #TraderCommunity #TradingView
Emerging Market ImpactIntroduction
Emerging markets represent countries that are transitioning from developing to developed status, marked by rapid industrialization, growing middle classes, and increasing integration with the global economy. These nations—such as India, Brazil, China, Indonesia, Mexico, South Africa, and Turkey—play a crucial role in shaping global economic trends. Over the past three decades, emerging markets (EMs) have become engines of global growth, accounting for more than half of global GDP in purchasing power parity (PPP) terms. Their impact on trade, investment, innovation, and geopolitics is now undeniable.
The term “emerging market” was popularized by the International Finance Corporation (IFC) in the 1980s to describe economies offering high growth potential but carrying higher risks. Today, the significance of emerging markets has expanded beyond growth potential—they are vital to global supply chains, technological diffusion, and financial market stability. Understanding their impact involves examining their influence on global trade, investment flows, innovation, financial stability, and sustainable development.
1. Economic Growth and Global Output
Emerging markets have become the primary drivers of global economic growth. According to IMF data, EMs and developing economies contribute roughly 60% of global GDP (in PPP terms), up from less than 40% in the early 1990s. China’s meteoric rise is the most notable, transforming from a low-income agricultural nation to the world’s second-largest economy. India, Indonesia, and Vietnam are also rising powerhouses, benefiting from demographic advantages, urbanization, and digital transformation.
The rapid growth of EMs has helped stabilize the global economy, especially during periods of stagnation in advanced economies. For instance, after the 2008 global financial crisis, emerging markets—particularly China and India—led the recovery through infrastructure spending and consumption demand. The expanding middle class in these regions continues to fuel demand for goods, services, and technology, creating a multiplier effect across industries worldwide.
2. Global Trade and Supply Chains
Emerging markets have profoundly reshaped global trade patterns. Many EMs have become manufacturing hubs, supplying goods to developed nations at competitive costs. China’s role as the “world’s factory” is well-documented, but the global supply chain is diversifying. Countries like Vietnam, India, and Mexico are now major alternatives, benefiting from the “China+1” strategy adopted by global corporations to reduce geopolitical and logistical risks.
Emerging markets are not just exporters—they are also major consumers. Rising incomes have led to greater demand for automobiles, electronics, healthcare, and luxury goods. As a result, multinational corporations view EMs as strategic markets rather than just production bases.
Furthermore, emerging markets are increasingly integrating into South-South trade, trading directly with other developing nations. This intra-emerging market trade, supported by regional trade agreements like RCEP (Regional Comprehensive Economic Partnership) and BRICS initiatives, is reshaping global trade flows.
3. Foreign Direct Investment (FDI) and Capital Flows
Emerging markets attract significant foreign direct investment due to their large labor forces, expanding consumer markets, and improving infrastructure. FDI inflows help these economies develop industries, generate employment, and gain access to technology. For example, India’s digital and manufacturing sectors have seen record FDI inflows, while Southeast Asia has become a magnet for electronics and semiconductor investment.
However, EMs are also becoming outward investors. China’s Belt and Road Initiative (BRI) exemplifies how emerging economies are now major sources of capital and infrastructure investment. Middle Eastern nations are also channeling sovereign wealth funds into global ventures, further highlighting the two-way capital movement between emerging and developed markets.
Nevertheless, FDI in EMs comes with volatility risks. Political instability, regulatory uncertainty, and currency fluctuations often deter investors. Capital flight during crises—such as the Asian Financial Crisis (1997) or the pandemic shock (2020)—illustrates the vulnerability of EMs to global sentiment and U.S. monetary policy shifts.
4. Technological Advancement and Digital Transformation
A defining feature of modern emerging markets is their leapfrogging in technology adoption. Unlike developed economies that evolved through gradual innovation cycles, EMs often skip intermediate stages, embracing cutting-edge digital solutions. For example:
India revolutionized digital finance with the Unified Payments Interface (UPI), making mobile payments ubiquitous.
China dominates e-commerce and fintech through giants like Alibaba, Tencent, and Ant Group.
Kenya’s M-Pesa pioneered mobile money systems, influencing global financial inclusion strategies.
Emerging markets have also become major centers of innovation in renewable energy, AI, and biotech. China leads the world in solar and EV manufacturing, while India is advancing in pharmaceuticals and information technology. The diffusion of technology has improved productivity and expanded access to services such as healthcare, education, and banking.
However, digital inequality persists. Many EMs face challenges such as inadequate digital infrastructure, cybersecurity risks, and a shortage of skilled labor. Bridging this gap remains critical for sustainable digital transformation.
5. Financial Market Influence
Emerging markets play a growing role in global financial stability. EM debt and equity markets attract institutional investors seeking higher yields compared to developed economies. The rise of emerging market bonds and ETFs has diversified global portfolios but also increased interconnectedness.
However, EMs remain vulnerable to external shocks, particularly those arising from U.S. Federal Reserve policy changes. Rising interest rates in advanced economies often trigger capital outflows, currency depreciation, and inflationary pressures in EMs. For instance, during the 2013 “taper tantrum,” several emerging currencies plunged as investors withdrew funds amid expectations of tighter U.S. monetary policy.
On the positive side, financial reforms and stronger central banks in many EMs have enhanced resilience. Countries like India, Indonesia, and Brazil have improved foreign exchange reserves, fiscal management, and inflation targeting mechanisms, reducing systemic risk.
6. Role in Global Geopolitics
Emerging markets are reshaping the geopolitical balance of power. The rise of China, India, and Brazil has diluted Western economic dominance and promoted multipolarity. Organizations such as BRICS (Brazil, Russia, India, China, South Africa) and Shanghai Cooperation Organisation (SCO) illustrate efforts to foster South-South cooperation and reduce dependency on Western institutions like the IMF and World Bank.
China’s Belt and Road Initiative (BRI) and India’s International Solar Alliance exemplify how EMs are asserting global leadership roles. Moreover, emerging markets hold significant influence in global energy markets—OPEC members like Saudi Arabia, Nigeria, and Venezuela control major oil supplies, impacting global prices and trade balances.
In international diplomacy, emerging economies demand greater representation in institutions such as the United Nations, G20, and WTO. Their growing influence is prompting reforms in global governance frameworks to reflect the new economic reality.
7. Demographic Dividend and Labor Market Dynamics
Many emerging markets enjoy a demographic advantage, with young and growing populations that drive consumption and labor supply. India, for instance, is expected to have the world’s largest working-age population by 2030. This demographic dividend fuels economic growth through productivity and innovation.
However, the challenge lies in job creation and skill development. Without adequate employment opportunities, the demographic dividend can become a liability, leading to social unrest and economic inequality. Governments in EMs are thus investing heavily in education, vocational training, and entrepreneurship programs to harness the potential of their youth.
In contrast, some emerging markets—like China and Thailand—are now facing aging populations, which may strain public finances and slow growth. The demographic landscape is therefore diverse and evolving across regions.
8. Environmental and Sustainability Impact
Emerging markets have a dual relationship with sustainability. On one hand, rapid industrialization has led to environmental degradation, deforestation, and carbon emissions. On the other hand, EMs are at the forefront of renewable energy transition and green technology adoption.
China, for example, is the world’s largest producer of solar panels, wind turbines, and electric vehicles. India’s renewable energy capacity is growing rapidly, with ambitious goals to achieve net-zero emissions by 2070. The availability of natural resources also positions EMs as key players in the green energy supply chain—especially in lithium, cobalt, and rare earth minerals essential for EVs and batteries.
Sustainable finance initiatives—such as green bonds and ESG investing—are gaining traction in emerging economies, attracting global investors interested in climate-resilient growth.
9. Challenges and Risks
Despite their progress, emerging markets face several structural challenges:
Political Instability – Uncertain governance and corruption can deter investment and disrupt economic progress.
Debt Burden – High public and private debt levels make EMs vulnerable to external shocks.
Currency Volatility – Dependence on foreign capital can cause instability when global conditions tighten.
Infrastructure Gaps – Insufficient transport, energy, and digital infrastructure limit competitiveness.
Income Inequality – Rapid growth often benefits urban elites more than rural populations, widening disparities.
Addressing these vulnerabilities is critical for ensuring long-term sustainable growth.
10. The Future of Emerging Markets
The next decade is likely to be defined by the emergence of a new wave of EM leaders—countries that combine strong governance, digital innovation, and sustainability. Nations like Vietnam, Indonesia, and the Philippines are positioned to follow the growth trajectories of China and India.
Global corporations are diversifying supply chains toward these regions, while technology adoption and green energy initiatives continue to accelerate development. The growth of fintech, e-commerce, and artificial intelligence will deepen financial inclusion and create new economic opportunities.
Furthermore, cooperation among EMs through forums like BRICS+, G20, and regional trade blocs will amplify their collective influence on global decision-making. The long-term impact of emerging markets will thus be not just economic but transformative—reshaping global norms, industries, and governance structures.
Conclusion
The impact of emerging markets on the global economy is profound and far-reaching. They have become engines of growth, innovation hubs, and geopolitical influencers. Their rising share in global GDP, trade, and investment signifies a shift toward a more multipolar and interconnected world.
While challenges such as inequality, debt, and political risk persist, the potential of EMs remains immense. As they embrace digital transformation, sustainability, and stronger governance, emerging markets are poised to define the next phase of global development. The world’s future economic stability, innovation, and prosperity will increasingly depend on how effectively emerging markets harness their potential and navigate their challenges.

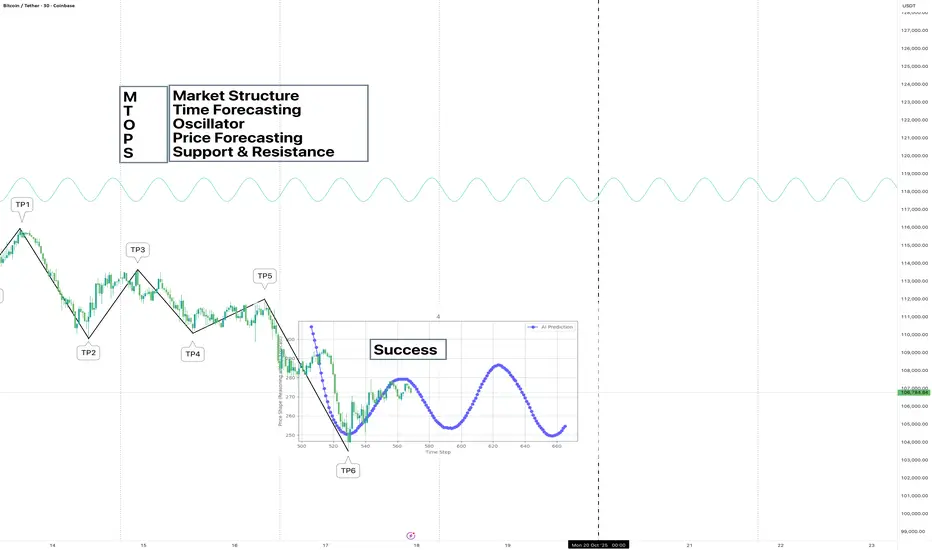
The price action is developing just as the AI forecast predicted9 out of 9 hit rate - high accuracy back to back!
This confirms that the forecast has been accurate again!
USDJPY (Weekly Analysis) + RecapIn today’s USDJPY breakdown, I’m focusing on short setups as price action shows signs of exhaustion at the top. I cover key resistance levels, potential reversal zones, and the intraday targets I’ll be watching as the pair looks set for a pullback. As always, happy trading everyone.

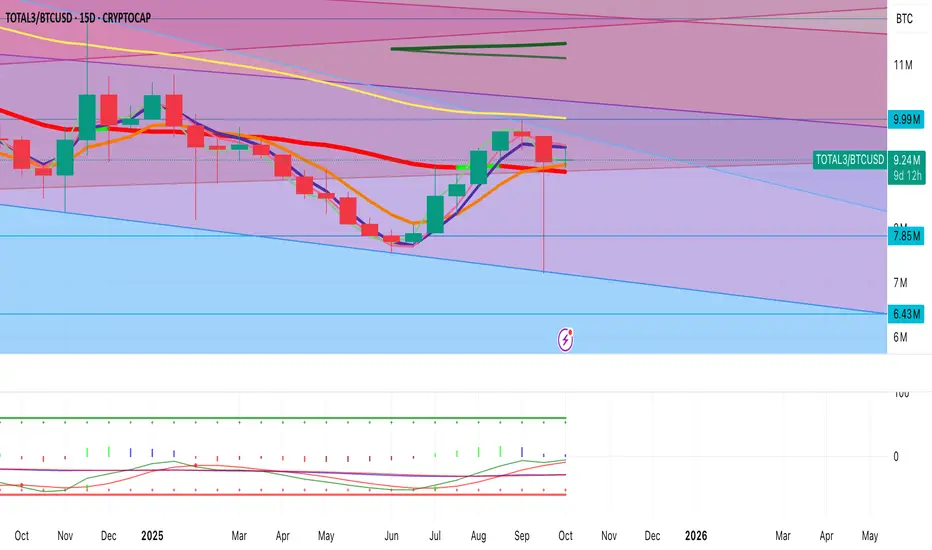
ALT SZN ISN'T OVER ?What the chart is signaling (6-week)
Structure & candles
After a long bleed, the last 3–4 six week candles show higher lows and persistent lower-wick demand classic accumulation versus BTC rather than capitulation.
Current candle is Red and sitting at/just above the short EMAs, attempting its first multi-candle base since the 2023–24 downtrend.
Key levels printed on your chart
Pivot/Midline: ~9.99M (dotted).
Near supports: 7.85M → 6.43M → 4.72M .
Resistance ladder above: 11.84M → 14.62M → 16.69M → 17.5M .
Price is working to reclaim 9.99M and poke 11.84M; a weekly-6 close above that first resistance unlocks the next band.
Moving averages
Price has reclaimed the 6W 8-EMA and is testing the 13/21-EMA cluster (your thin yellow/orange).
The MA (think 50/60 SMA equivalent on 6W) is flattening loss of downside velocity. An H6 close above the fast EMA stack typically precedes a mean-reversion push toward that red MA.
Momentum/oscillator panel (bottom)
Momentum is curling up from deeply compressed/oversold territory with a bullish cross developing.
Price made equal/lower lows while momentum put in higher lows → bullish divergence on a very high timeframe. Those usually take one more candle to “confirm”—which lines up with your ~9–10 day window into the 6W close.
Geometry (Murrey/Gann bands on your chart)
Price has lived in the light-blue lower quadrant for a long stretch and is now pressing the mid-band. In these fan/quarter systems, reclaiming the midline (9.99M) often leads to fast travel to the opposite band (11.84M) because liquidity thins between bands.
Why the next 9–10 days matter
The label on your chart shows “9d 4h” left on the active 6-week candle. High-TF momentum crosses and EMA reclaims only matter at close.
If we close above 9.99M and ideally tag/close near 11.84M, you lock in:
a confirmed bullish divergence,
a multi-EMA reclaim, and
a mid-band recapture.
That combo historically precedes alts-over-BTC outperformance as the next candle begins.
Bullish triggers to watch (checklist)
6W Close ≥ 9.99M (pivot reclaimed).
6W Body closes above the 8/13/21-EMA stack (thin yellow/orange).
Momentum cross up on the 6W panel with histogram/ticks turning positive (your dots turning up and spacing higher).
BTC behavior: consolidation or mild drift lower in BTC.D (dominance) and range-bound BTC price—this is when TOTAL3/BTC rallies.
Probable path if confirmed
Phase 1 (confirmation): Close above 9.99M → quick probe of 11.84M.
Phase 2 (expansion): Acceptance above 11.84M opens a measured move into the next liquidity shelf 14.62M (prior distribution top and fan confluence).
Phase 3 (euphoria test): If momentum keeps trending and BTC stays sideways, a wick into 16.69M is feasible before a pullback to retest 14.62M.
Timing & mechanics of an alt rally
Sequence that often plays out:
BTC impulse stalls →
BTC ranges (vol crush) →
Liquidity rotates into alts →
TOTAL3/BTC breaks its EMA stack →
Fast move band to band.

New Forecast is Out - Slow Market AheadThe AI suggests ranged price action coming in
I'd suggest sitting out until Monday

Highest Accuracy predictions continue to impressIt can be nerve wrecking seeing forecasts come out as I sometimes wonder whether it's going to work out this time...
And yet Again, it does!! Not close to, but bang on to it!
This is new era of trading unfolding. Stay close to the progression
