ETH USDT#ETH CRYPTOCAP:ETH
Ethereum is breaking the upper boundary of its descending channel on the 12H chart💁♂️
A successful breakout could trigger a massive rally with targets at $1,950, $2,120, $2,550 and $2,880🚀
Gann

BTC USDT#BTC CRYPTOCAP:BTC
Bitcoin has surged above GETTEX:87K during holiday trading showing strong bullish momentum on the daily chart🔥
If buyers can hold the price above this level, this will signal a change in the downward structure and start of an uptrend🤓
But it's not just a charts that give hope - market activity too📊
I'd like to highlight the AI narrative - it seems to be coming back into play🤔
Keep an eye on it👀

GOLD (XAUUSD) – Gann Time Cycle Analysis (0° to 360°)From the November 30, 2015 low, we've entered a long-term Gann square cycle.
Each 45° marks a price movement zone, while 360° = full cycle completion.
We're now near 270°–315°, typically the zone of cycle tops.
📅 360° = December 14, 2026
This could mark a long-term time-based high for gold before a macro correction unfolds.
When time and price complete a cycle — a new story begins.
----------------------------------------
🔢 Gann Degree Levels for Gold (from 2015 Low):
0° → $1,046 (Cycle Start)
45° → $1,357 (Initial resistance)
90° → $1,709 (Now support)
135° → $2,102 (Warning zone - passed)
180° → $2,535 (Mid-cycle balance)
225° → $3,008 (Breakout confirmed)
270° → $3,638 (Current region)
315° → $4,317 (Major overextension)
360° → $5,223 (Full cycle top)
⏳ Current price is approaching 270°–315°, historically where long-term tops form.
📅 Cycle completion expected by Dec 14, 2026
#GannAnalysis #TimeCycles #Gold #XAUUSD #MacroForecast

Bitcoin Cash ($BCH) Analysis
The price has bounced strongly from the demand zone between $270 – $295, suggesting the start of a potential bullish wave. A falling wedge pattern has been broken to the upside on the weekly timeframe, which is a strong bullish signal.
Buy Zone:
Support zone between $270 – $295 offers a solid buying opportunity if retested.
Targets:
Target 1: $491
Target 2: $626
Target 3: $758
The bullish outlook remains valid as long as the price holds above the $270 support level.

DXY – Time & Price Analysis via Gann GeometryThe TVC:DXY just broke below the 1×1 descending angle within a Gann weekly square, confirming the end of the bullish cycle initiated around the September 2022 high.
Key observations:
📉 Next time–price supports: 89.91 → 84.95
🕰️ Major timing intersections ahead:
Dec 16, 2024 → marks a quarter cycle completion.
Sep 8, 2025 → opposite timing leg to Sep 2022 high.
RSI is weakening, but price remains a function of time.
If these time zones hold, a reversal window opens.
Otherwise, we're heading deeper into the southern square.
📐 Time governs trend – price obeys.
#Gann #TimeCycles #DXY #USD #TechnicalAnalysis #TradingView

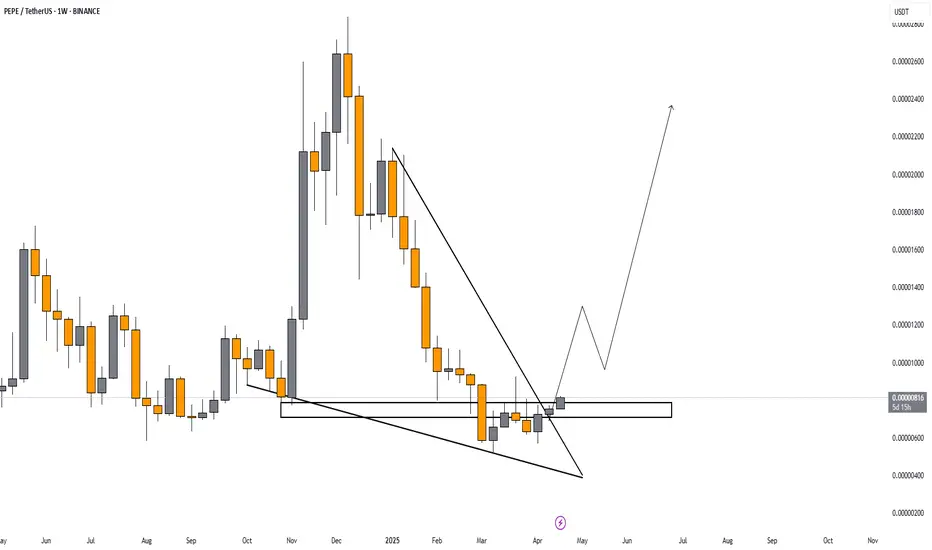
PEPE is waking up from the floor!🚀 CRYPTOCAP:PEPE is waking up from the floor!
Fibonacci Confluence Zone held strong around 0.00000507, showing accumulation at historical support.
Price broke out of a multi-month downtrend and is starting to show bullish structure.
Momentum building with weekly bullish candles and reclaiming key levels.
🎯 Targets:
• 0.00002072
• 0.00002789
Mara Like a Phoenix Reborn #USA Gann's Law of Vibration showing us what's to come.
The vibration has reset and new highs will be made.
On balance volume about to go parabolic.
Implied Volatility follows.
Time to make money.
"Time is the most important factor in determining market movements and by studying the past records of the averages or individual stocks you will be able to prove for yourself that history does repeat and that by knowing the past you can tell the future. There is a definite relation between time and price. Now, by a study of the time periods and time cycles you will learn why tops and bottoms are found at certain times and why resistance levels are so strong at certain times and bottoms and tops hold around them. The most money is made when fast moves and extreme fluctuations occur at the end of major cycles.” - W.D. Gann

April 17 Bitcoin Bybit chart analysisHello
It's a Bitcoinguide.
If you have a "follower"
You can receive comment notifications on real-time travel routes and major sections.
If my analysis is helpful,
Please would like one booster button at the bottom.
This is the Bitcoin 30-minute chart.
Nasdaq indicators will be announced at 9:30 in a little while.
The purple finger section on the left
is connected to the short->long switching section that was performed on the 16th.
* When the blue finger moves,
Bidirectional neutral
Short->long switching strategy or long waiting if it goes down right away.
1. 85,728.6 dollars short position switching / cut-off price when orange resistance line is broken
2. 84,595.8 dollars long position switching / cut-off price when green support line is broken
3. 86,871.5 dollars long position 1st target -> Good 2nd target
Today's 12-hour chart MACD dead cross is an ignoring strategy. Check if the purple support line deviates from the current position,
and from the 1st section of the green support line deviates,
even those who have been holding long positions since yesterday can operate at the same stop loss price.
If the short position entry section at the top comes down without touching,
the 2nd section at the bottom is the final long waiting section (6+12 pattern),
and if the rebound is not good in this section and it is pushed,
it may continue to fall to the 3rd section at the bottom due to the pressure of the 12-hour chart MACD dead cross.
Up to this point, please use my analysis article only for reference and use,
and I hope you operate safely with the principle trading and stop loss price.
Thank you.

AUDUSD SHORT FORECAST Q2 W17 D22 Y25AUDUSD SHORT FORECAST Q2 W17 D22 Y25
SUMMARY
- Weekly 50 exponential moving average
- Daily high rejection
Requirements
- 15' Break of structure short! Non negotiable.
- 15' order block creation to short from once price action pulls back.
🔑 Remember, to participate in trading comes always with a degree of risk, therefore as professional risk managers it remains vital that we stick to our risk management plan as well as our trading strategies.
📈The rest, we leave to the balance of probabilities.
💡Fail to plan. Plan to fail.
🏆It has always been that simple.
❤️Good luck with your trading journey, I shall see you at the very top.
🎯Trade consistent, FRGNT X

Gold (XAU/USD): A Healthy Pullback Ahead?
Gold has rallied impressively, pushing through key Fibonacci levels and reaching the 1.0 extension around $3,429. As seen in the chart, a retracement could be on the horizon before any further upside.
The red projection outlines a potential dip—possibly toward the 0.5 ($2,523) or 0.618 ($2,737) Fibonacci levels—before bulls step back in to drive price higher.
This type of corrective move is often part of a healthy uptrend. It allows the market to reset, shake out short-term traders, and build a stronger foundation for the next push—potentially toward $4,550 (1.618) or even $6,363 (2.618).
Key retracement zones to watch:
0.5 – $2,523
0.618 – $2,737
0.786 – $3,041
If gold finds support at any of these levels, it could signal a strong continuation of the bull run.
What’s your take—temporary correction or deeper reversal?
#Gold #XAUUSD #TechnicalAnalysis #Fibonacci #Commodities #MarketOutlook #GoldForecast

EURUSD SHORT FORECAST Q2 W17 D23 Y25 - CONTINUEDEURUSD SHORT FORECAST Q2 W17 D23 Y25
Summary
- Weekly Order Block
- Daily Order Block
- 15' Order Block
- Break of 15' structure
Requirements
- Setup A) Continued 15' breaks of structure. Price action pull back to point of interest.
- Setup B) Lower time frame break of structure via current 15' order block for immediate short.
- Setup C) Tap entry post break of structure
FRGNT X
🔑 Remember, to participate in trading comes always with a degree of risk, therefore as professional risk managers it remains vital that we stick to our risk management plan as well as our trading strategies.
📈The rest, we leave to the balance of probabilities.
💡Fail to plan. Plan to fail.
🏆It has always been that simple.
❤️Good luck with your trading journey, I shall see you at the very top.
🎯Trade consistent, FRGNT X

EURGBP SHORT FORECAST Q2 W17 D3 Y25EURGBP SHORT FORECAST Q2 W17 D23 Y25
Summary
- Weekly Orderblock
- 15' Orderblock
Requirements
- Setup A) Await 15' breaks of structure - Pull back short from created 15' order block
- Setup B) Lowertime frame break of structure via current available 15' order block
- Setup C) Break and retest via 15' order block created upon the break of structure.
🔑 Remember, to participate in trading comes always with a degree of risk, therefore as professional risk managers it remains vital that we stick to our risk management plan as well as our trading strategies.
📈The rest, we leave to the balance of probabilities.
💡Fail to plan. Plan to fail.
🏆It has always been that simple.
❤️Good luck with your trading journey, I shall see you at the very top.
🎯Trade consistent, FRGNT X

XAU/USD Price Action Update – April 22, 2025📊XAU/USD Price Action Update – April 22, 2025
🔹Current Price: 3,480.53
🔹Timeframe: 15M
📌Key Demand Zones (Support):
🟢3452–3452 – Minor Imbalance Fill Zone (could trigger short-term reaction)
🟢3441–3444 – Strong Demand Zone (aligned with 0.618 Fib retracement)
🟢3412–3419 – Higher Timeframe Bullish Origin (potential reversal zone)
📌Fibonacci Retracement Levels:
🔸0.236 – 3,475.32
🔸0.382 – 3,466.54
🔸0.5 – 3,456.21
🔸0.618 – 3,445.88
📈Bullish Outlook:
Price is retracing after a strong bullish impulse and may react at the Fib levels, especially around the 0.618 zone aligned with demand. Bullish continuation possible if price forms a higher low and confirms with bullish engulfing or BOS.
📉Bearish Outlook:
If price fails to hold above 3452 or breaks 3441 aggressively, a deeper pullback toward 3412–3419 could occur. Look for bearish confirmation candles and signs of weak buyers.
⚡Trade Setup Tip:
✅Watch for entry confirmation at demand zones
✅Use confluences like Fib levels, structure, and reaction wicks
✅Maintain disciplined risk management
#XAUUSD #GoldAnalysis #ForexTrading #SmartMoneyConcepts #PriceAction #TechnicalAnalysis #FXF #fxforever #SupplyAndDemand #FibonacciLevels #IntradayTrading #MarketUpdate #GoldScalping

EURUSD SHORT FORECAST Q2 W17 D23 Y25EURUSD SHORT FORECAST Q2 W17 D23 Y25
Summary
- Weekly Order Block
- Daily Order Block
- 15' Order Block
- Break of 15' structure
Requirements
- Setup A) Continued 15' breaks of structure. Price action pull back to point of interest.
- Setup B) Lower time frame break of structure via current 15' order block for immediate short.
FRGNT X
IG - JCFRGNT

GBP/JPY AnalysisThe pound is about to rise to the levels shown on the chart according to the fractal. As a precaution, please place the stop loss below the last bottom.

GBPUSD SHORT FORECAST Q2 W17 D23 Y25GBPUSD SHORT FORECAST Q2 W17 D23 Y25
SUMMARY
- Weekly order block
- Daily order block
- Price action bullish in current point of interest.
REQUIREMNTS
- Setup A) Substantial 15' break of structure, creating 15' order block to short from on the pull back.
- Setup C) Lower time frame break of structure without initial 15' break of structure.
- Candle stick formation confluences.
FRGNT X
IG - JCFRGNT

New peak of $3,520! Waiting for gold price to reach.
New peak of $3,520! Six major events this week detonated gold prices, waiting for gold prices to hit
📌 Driving events
1. Geopolitical black swans fly frequently
The tariff war between China, the United States and Europe has escalated comprehensively. The United States has imposed a 104% tariff on China (involving rare earths, semiconductors and other fields), and the European Union has implemented a 21 billion euro retaliatory tariff. The World Bank predicts that global GDP growth may fall by 1.8%. The situation in the Middle East continues to deteriorate. After the breakdown of the US-Iran nuclear negotiations, Israel launched an air strike on Iran's nuclear facilities, pushing gold to rise by more than 3% in a single day. Historical data shows that the average increase in gold during geopolitical crises can reach more than 20%.
2. The Federal Reserve may change its coach
US President Donald Trump once again criticized Federal Reserve Chairman Jerome Powell, exacerbating concerns about the independence of the central bank, which has exacerbated uncertainty. Reports that the US government is exploring legal means to remove Powell will only deepen market uneasiness and enhance the attractiveness of gold as a tool to hedge policy and economic instability risks.
3. Global central bank gold purchases hit a record high
In 2024, global central bank gold reserves reached 4,974 tons, and China increased its holdings to 73.7 million ounces for 20 consecutive months (accounting for 4.9%). From January to April 2025, the central bank's net gold purchases exceeded 420 tons, accounting for more than 25% of the annual demand. After China's insurance funds enter the market, it is expected that 255 tons of new demand will be added each year.
4. Gold ETF funds are pouring in
In the first quarter, global gold ETF funds inflow exceeded US$5 billion, and SPDR's daily inflow reached 226.5 tons (a three-year high). The asset management scale of domestic gold ETFs exceeded 101 billion yuan, and the holdings increased to 138 tons. The holdings of post-00 investors surged by 300%.
5. Inflation and stagflation expectations are rising
The US CPI rose 3.5% year-on-year in March, and the core PCE price index hit a 32-year high. The risk of economic "stagflation" strengthened the anti-inflation properties of gold. Citigroup's model shows that if inflation is higher than 3% for a long time, the probability of gold price breaking through $3,500 is over 60%.
6. Technical breakthrough triggers resonance
After spot gold broke through the key resistance level of $3,250, it triggered programmatic buying, and speculative long positions accounted for 67%. COMEX gold futures open interest surged 18%, and the premium of the main Shanghai gold contract expanded to 5 yuan/gram, reflecting the strong bullish sentiment in the market.
📊Comment Analysis
Geopolitical tensions, rising prices, trade tensions, gold prices benefit
💰Strategy Package
Long positions:
Actively participate at 3480-90 points, profit target above 3510-20 points
Short positions:
Actively participate at 3510-00 points, profit target below 3475-65 points
⭐️ Note: Labaron hopes that traders can properly manage their funds
- Choose the number of lots that matches your funds
- Profit is 4-7% of the fund account
- Stop loss is 1-3% of the fund account

USDZAR-BUY strategy 9 horuly chart Regression channelThe pair has reached my preferred BUYING level and I feel due to USDX oversold status and also extremely overbought GOLD, this pair should benefit upwards strongly over time.
Strategy BUY @ 18.6150-18.6650 and take profit near 18.9575 for now.

Nifty Futures Intraday Trend Analysis for April 22, 2025The primary trend remains bullish as Nifty Futures continues to trade above the Sine Wave. However, Market Timing is indicating a bearish signal, which is further confirmed by the MastersCycleSignal indicator. If the price moves lower, the first support level is at 23,875, followed by a stronger support at 23,628 (Sine Wave level).
This is my personal view. Traders are advised to rely on their technical analysis and always trade with a Stop-Loss.

EUR/USD Analysis: Weekly & Daily Timeframes
In this analysis, I explored the EUR/USD pair, identifying significant patterns and potential trade opportunities. The weekly timeframe shows a strong support level, while the daily chart highlights short-term resistance. Combining these insights with the DXY index, we can better understand market dynamics.

22 April important level trading zone #Nifty50 #option trading
99% working trading plan
👉Gap up open 24238 above & 15m hold after positive trade target 24508,
👉Gap up open 24008 below 15 m not break upside after nigetive trade target 24008, 23853
👉Gap down open 24008 above 15m hold after positive trade target 24238 , 24508
👉Gap down open 24008 below 15 m not break upside after nigetive trade target 23853, 23653
💫big gapdown open 23853 above hold 1st positive trade view
💫big Gapup opening 24508 below nigetive trade view
📌 Trade plan for education purpose I'm not responsible your trade
More education follow & support me

EURGBP SHORT FORECAST Q2 W17 D22 Y25EURGBP SHORT FORECAST Q2 W17 D22 Y25
Summary
- Weekly Orderblock
- 15' Orderblock
Requirements
- Setup A) Await 15' breaks of structure - Pull back short from created 15' order block
- Setup B) Lowertime frame break of structure via current available 15' order block
FRGNT X
IG - JCFRGNT

USDCHF LONG FORECAST Q2 W17 D22 Y25USDCHF LONG FORECAST Q2 W17 D22 Y25
Summary
- Weekly order block
- Daily order block
- Price is currently bearish
Requirements
- Wait for a comprehensive bullish turn around in price action
- 15' break of structure
USDCHF LONG FORECAST Q2 W17 D22 Y25
FRGNT X
IG - JCFRGNT
