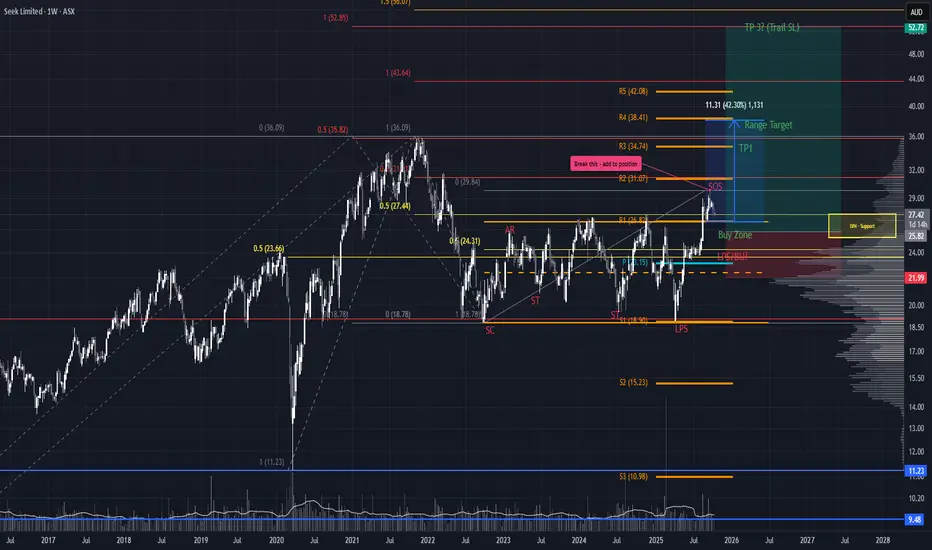
3-Year Breakout with LVN PrecisionSEEK has broken out of a multi-year range and is now testing the upper boundary to gauge buyer commitment. This is a critical zone. Price action here will reveal whether markup is ready to accelerate or pause for a reload.
Trade Scenario
Begin scaling in as price has reached the top of a Low Volume Node. This zone typically lacks price acceptance, so there is a strong chance of a brief dip before continuation. If price does pull back, monitor the buy zone for a second entry/scale in opportunity.
Risk management remains essential. Since a higher low has not yet formed, the stop loss should sit below the Last Point of Support. Once a new higher low is confirmed, the stop can be moved accordingly to lock in structure.
Targets
Initial target sits just below the all-time high
For extended upside, trail the stop loss using newly formed swing lows to capture continuation
Gann
Risks and opportunities exist at the same time, continue to buyGold Technical Analysis
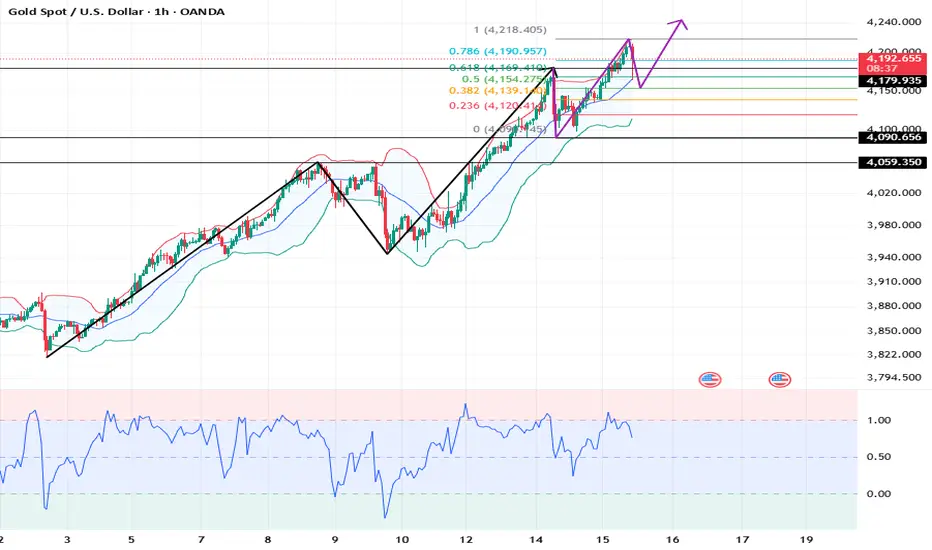
Daily Resistance: 4200, Support: 3945
4-Hour Resistance: 4220, Support: 4090
1-Hour Resistance: 4220, Support: 4180
Gold prices have already broken through the 4200 mark today, effectively erasing any bearish concerns. Yesterday, I was hoping for a pullback to 4060, offering a better entry point, but the rally was too strong, and the pullback stalled around 4100.
From the current structure, gold has found support at 4180 and 4150. If it stalls there today, you can still buy in. The only caveat is not to set a stop-loss that's too small, but don't cancel it either. Doing so can easily lead to false breakouts, as has been the case with recent large and rapid movements.
Although gold remains in a bull market, as prices continue to rise, sudden and rapid intraday declines like Tuesday's will only become more frequent and more severe. All we can do is continue to follow the upward trend while remaining vigilant and prepared to react to any potential corrections.
Trading today, we continue to prioritize buying on dips, focusing on support levels around 4180-4150.
BUY: near 4180
BUY: near 4150
GBPJPYGBPJPY
- Fair Value Gap
- Ascending Triangle as an corrective pattern in Long Time Frame
- Break of Structure
- Demand Zone
- Order Block

CRV Long 10/15/2025 To the moon?Price can go back to 0.5 in which I will enter a third time. Al these today I will leave runners (25) running to the moon?
All my trades posted and viewed free live in link in profile.

#SUI/USDT Bullish scenario#SUI
The price is moving within a descending channel on the 1-hour frame, adhering well to it, and is heading for a strong breakout and retest.
We have a bearish trend on the RSI indicator that is about to be broken and retested, which supports the upward breakout.
There is a major support area in green at 2.61, representing a strong support point.
We are heading for consolidation above the 100 moving average.
Entry price: 2.81
First target: 2.96
Second target: 3.11
Third target: 3.30
Don't forget a simple matter: capital management.
When you reach the first target, save some money and then change your stop-loss order to an entry order.
For inquiries, please leave a comment.
Thank you.

TAO LONG AI 10/15/2025Volume profile shows low activity there, meaning if price drops, it could fill quickly and bounce back.
Large holders may take profits near resistance zones (e.g. ~$403). If price cannot break and hold above such levels, momentum may stall

Titular Viral SNX LONG I10/15/25My entry target — aligns with previous demand zone + low volume area (LVA). Posted 10/15/2025. All trades At link in profile.

BTC/USDTENTRY:113000_111000
SL:109750
TP:117000
****Please manage your capital. There is no liability for your trading.****
Have a profitable day

EURUSD Daily FRGNT Forecast -Q4 | W42 | D15 | Y25|📅 Q4 | W42 | D15 | Y25|
📊 EURUSD Daily FRGNT Forecast
🔍 Analysis Approach:
I’m applying Smart Money Concepts, focusing on:
Identifying Points of Interest on the Higher Time Frames (HTFs) 🕰️
Using those POIs to define a clear trading range 📐
Refining those zones on Lower Time Frames (LTFs) 🔎
Waiting for a Break of Structure (BoS) for confirmation ✅
This method allows me to stay precise, disciplined, and aligned with the market narrative, rather than chasing price.
💡 My Motto:
"Capital management, discipline, and consistency in your trading edge."
A positive risk-to-reward ratio, paired with a high win rate, is the backbone of any solid trading plan 📈🔐
⚠️ Losses?
They’re part of the mathematical game of trading 🎲
They don’t define you — they’re necessary, they happen, and we move forward 📊➡️
🙏 I appreciate you taking the time to review my Daily Forecast.
Stay sharp, stay consistent, and protect your capital
— FRNGT 🚀
FX:EURUSD

7 out of 7, back-to-back accuracy. Power!Since last week Monday I thought to share my AI forecasts with the public using Bitcoin 30min chart as my chart of choice.
It's taken 8 years of growth to be able to get here, and it feels like I have finally made it
I say this as yesterday my nerves were letting doubt in, thinking that this next forecast would be the one that didn't work out... instead it's brought 7 out of 7, back-to-back accuracy. Power!

GBPUSD Daily FRGNT Forecast -Q4 | W42 | D15 | Y25|📅 Q4 | W42 | D15 | Y25|
📊 GBPUSD Daily FRGNT Forecast
🔍 Analysis Approach:
I’m applying Smart Money Concepts, focusing on:
Identifying Points of Interest on the Higher Time Frames (HTFs) 🕰️
Using those POIs to define a clear trading range 📐
Refining those zones on Lower Time Frames (LTFs) 🔎
Waiting for a Break of Structure (BoS) for confirmation ✅
This method allows me to stay precise, disciplined, and aligned with the market narrative, rather than chasing price.
💡 My Motto:
"Capital management, discipline, and consistency in your trading edge."
A positive risk-to-reward ratio, paired with a high win rate, is the backbone of any solid trading plan 📈🔐
⚠️ Losses?
They’re part of the mathematical game of trading 🎲
They don’t define you — they’re necessary, they happen, and we move forward 📊➡️
🙏 I appreciate you taking the time to review my Daily Forecast.
Stay sharp, stay consistent, and protect your capital
— FRNGT 🚀
FX:GBPUSD

EURUSD Daily FRGNT Forecast -Q4 | W42 | D14 | Y25|📅 Q4 | W42 | D14 | Y25|
📊 EURUSD Daily FRGNT Forecast
🔍 Analysis Approach:
I’m applying Smart Money Concepts, focusing on:
Identifying Points of Interest on the Higher Time Frames (HTFs) 🕰️
Using those POIs to define a clear trading range 📐
Refining those zones on Lower Time Frames (LTFs) 🔎
Waiting for a Break of Structure (BoS) for confirmation ✅
This method allows me to stay precise, disciplined, and aligned with the market narrative, rather than chasing price.
💡 My Motto:
"Capital management, discipline, and consistency in your trading edge."
A positive risk-to-reward ratio, paired with a high win rate, is the backbone of any solid trading plan 📈🔐
⚠️ Losses?
They’re part of the mathematical game of trading 🎲
They don’t define you — they’re necessary, they happen, and we move forward 📊➡️
🙏 I appreciate you taking the time to review my Daily Forecast.
Stay sharp, stay consistent, and protect your capital
— FRNGT 🚀
FX:EURUSD

GBPUSD Daily FRGNT Forecast -Q4 | W42 | D14 | Y25|📅 Q4 | W42 | D14 | Y25|
📊 GBPUSD Daily FRGNT Forecast
🔍 Analysis Approach:
I’m applying Smart Money Concepts, focusing on:
Identifying Points of Interest on the Higher Time Frames (HTFs) 🕰️
Using those POIs to define a clear trading range 📐
Refining those zones on Lower Time Frames (LTFs) 🔎
Waiting for a Break of Structure (BoS) for confirmation ✅
This method allows me to stay precise, disciplined, and aligned with the market narrative, rather than chasing price.
💡 My Motto:
"Capital management, discipline, and consistency in your trading edge."
A positive risk-to-reward ratio, paired with a high win rate, is the backbone of any solid trading plan 📈🔐
⚠️ Losses?
They’re part of the mathematical game of trading 🎲
They don’t define you — they’re necessary, they happen, and we move forward 📊➡️
🙏 I appreciate you taking the time to review my Daily Forecast.
Stay sharp, stay consistent, and protect your capital
— FRNGT 🚀
FX:GBPUSD

Impact of Central Bank Policies on Global Indices1. Interest Rate Decisions and Stock Market Valuations
One of the most direct ways central banks affect global indices is through interest rate policy. When a central bank such as the U.S. Federal Reserve, European Central Bank (ECB), or Bank of Japan changes benchmark interest rates, it impacts corporate profitability and investor sentiment.
Rate cuts make borrowing cheaper, stimulating business expansion and consumer spending. This boosts earnings expectations, leading to higher stock prices and rising indices such as the S&P 500 or FTSE 100.
Rate hikes, on the other hand, increase borrowing costs, reduce spending, and pressure profit margins, leading to a bearish sentiment across global markets.
Thus, the direction of central bank rates often sets the tone for short- to medium-term movements in global indices.
2. Quantitative Easing (QE) and Liquidity Injection
During economic downturns, central banks often implement Quantitative Easing (QE)—the purchase of government and corporate bonds to inject liquidity into the financial system.
This policy increases the money supply, lowers long-term interest rates, and encourages investment in riskier assets like equities.
For example, the Federal Reserve’s QE programs after the 2008 financial crisis and during the COVID-19 pandemic led to massive rallies in global indices such as the NASDAQ, Dow Jones, and MSCI World Index.
Increased liquidity often pushes investors toward stocks, resulting in higher valuations and stronger index performance globally.
3. Tapering and Liquidity Withdrawal
Conversely, when central banks begin tapering QE or reducing asset purchases, it signals a tightening monetary stance. Markets perceive this as a withdrawal of easy money, often leading to volatility.
The “Taper Tantrum” of 2013, when the Federal Reserve hinted at slowing its bond purchases, caused global bond yields to spike and emerging market indices to decline sharply.
Tapering reduces the availability of cheap capital, which can deflate overvalued markets and cause corrections across global indices.
4. Currency Exchange Rate Impacts
Central bank actions significantly influence foreign exchange rates, which in turn affect multinational companies and stock market indices.
For instance, a strong U.S. dollar resulting from higher Federal Reserve interest rates can hurt U.S. exporters, leading to declines in indices such as the Dow Jones and S&P 500.
Conversely, a weaker yen due to the Bank of Japan’s accommodative policy benefits Japanese exporters, pushing the Nikkei 225 higher.
Exchange rate movements impact global trade competitiveness, profits, and valuations—key factors in index performance.
5. Inflation Control and Market Stability
A central bank’s mandate often includes maintaining price stability. When inflation rises beyond targets, banks respond by tightening policy (raising rates or reducing liquidity).
High inflation reduces purchasing power and increases input costs for companies, which negatively impacts profit margins and stock valuations.
For example, aggressive rate hikes by the Federal Reserve in 2022–2023 to combat inflation led to declines in major indices like the NASDAQ Composite and S&P 500.
Conversely, successful inflation management fosters confidence, encouraging investors to re-enter equity markets.
Thus, inflation control directly affects both short-term volatility and long-term market stability.
6. Impact on Bond Yields and Equity Valuation Models
Central bank policy decisions influence bond yields, which are critical to equity valuation models.
When central banks lower rates, bond yields fall, and the discount rate used in valuing future corporate earnings decreases. This leads to higher present values of future cash flows, making equities appear more attractive.
In contrast, rising yields due to policy tightening make bonds more competitive with stocks, often prompting a rotation from equities to fixed income.
This dynamic is visible across global indices, where valuation multiples (like P/E ratios) expand or contract depending on central bank yield policies.
7. Investor Sentiment and Global Risk Appetite
Central bank communication—through forward guidance and policy statements—greatly influences investor sentiment and global risk appetite.
Dovish statements (indicating a preference for low rates and economic support) often boost investor confidence and lead to index rallies.
Hawkish tones (signaling tightening or rate hikes) can trigger sell-offs as investors anticipate slower growth.
Markets often react more to the tone and outlook of central bank meetings than to the actual rate changes. The Federal Reserve’s or ECB’s policy stance thus sets the mood for global equity performance.
8. Global Spillover Effects and Policy Synchronization
In today’s interconnected world, central bank actions have global spillover effects.
For instance, when the U.S. Federal Reserve raises rates, capital often flows from emerging markets to the U.S. in search of higher returns. This leads to depreciation of emerging market currencies and declines in their stock indices.
On the other hand, synchronized easing policies—as seen during the 2020 pandemic—can drive global liquidity surges and push indices across continents to record highs.
Thus, the coordination (or lack thereof) among major central banks—Fed, ECB, BoJ, and PBoC—affects not just domestic markets but global equity trends.
9. Sectoral Impacts within Indices
Central bank policies impact different sectors of an economy unevenly, influencing the composition of index performance.
Financial sector stocks (banks and insurers) generally benefit from higher interest rates as they improve lending margins.
Technology and growth stocks, however, tend to perform better in low-rate environments where borrowing is cheap and future growth is highly valued.
Therefore, changes in monetary policy can shift the leadership within global indices, with cyclical or defensive sectors taking turns depending on policy stance.
10. Long-Term Structural Implications
Finally, central bank policies have long-term structural effects on market valuation, risk perception, and investor behavior.
Prolonged periods of ultra-low interest rates can lead to asset bubbles, excessive leverage, and distortions in capital allocation.
On the other hand, consistent and transparent policy frameworks strengthen financial stability, foster sustainable growth, and create confidence in long-term investments.
For example, the credibility of the U.S. Federal Reserve’s inflation targeting has historically anchored investor trust, supporting steady growth in indices like the S&P 500 over decades.
Thus, beyond short-term volatility, central bank credibility shapes the very foundation of global financial markets.
Conclusion
The impact of central bank policies on global indices is profound and multifaceted. From influencing interest rates and liquidity to shaping investor psychology and cross-border capital flows, central banks are the key architects of modern financial stability. Their actions ripple through bond, currency, and equity markets—driving both short-term volatility and long-term trends.
Ultimately, understanding central bank policy decisions is essential for investors, traders, and analysts seeking to interpret the movement of global indices. In an interconnected global economy, the pulse of equity markets beats in rhythm with central bank policy shifts—making monetary policy one of the most powerful forces in global finance.

BTC Short WITH A BONUS 10/14/25-10/18/25 BTC Follow entries or will not W
TP1: 112500
TP2: 111000
TP3: 109800
TP4: 108500
Bonus Create your own entries DIY Crypto.
ASTER SHORT
SL: 1.54
TP1: 1.42
TP2: 1.38
TP3: 1.30

Aster Short Before Bounce 10/15/25Aster this little risky i have been building trade so it isn't as risky. Announced trade 2 days ago for those that wanted to profit when everyone thought Aster woudl never be at theis level again. Short into green candles.

ZWheat shortFront-month December wheat (ZWZ25) is trading near 499¢/bu, hovering around a five-year low as record Russian exports and strong global supply continue to weigh on prices.
Technical readings across major platforms, including TradingView, still lean “Sell”, with momentum staying negative after recent support levels failed.
Regression data from ZW1! also suggests that large traders remain net short, keeping institutional bias to the downside.

$NVTS to.....Navitas ( NASDAQ:NVTS ) is just getting started! The partnership with NVIDIA to power the future of AI data centers is a massive catalyst. Their GaN tech is critical for the AI power revolution. Don't be surprised when this one leaves the single digits in the dust. The path to $150 has begun. 🚀 #NVTS #NVIDIA #AI #Investing #GaN

USDJPY Daily Analysis (short) 15/10In today’s USDJPY breakdown, I’m focusing on short setups as price action shows signs of exhaustion at the top. I cover key resistance levels, potential reversal zones, and the intraday targets I’ll be watching as the pair looks set for a pullback. As always, happy trading everyone.

Next AI Forecast is outIt appears we are going to have some ranged action coming in
It's about correct timing when this happens.
Make sure to open and close your trades on confirmed turning points

Setting up the Bitcoin market from scratchIt's been a long day of intense focus, so the video is a bit boring
If you have the patience you'll learn some very valuable steps on how to correctly set up and forecast on a market.
I also touch on Sinewave and Oscillator tricks that might help your forecasts

BTC BUY Possible !Entered @12400$
BTC/USD Wave Update:
If a correction happens !
Bitcoin is completing wave (4) correction within the 113,200–112,700 support zone. If this level holds, a bullish wave (5) rally toward 116,500–117,000 is expected. A break below 112,700 invalidates the setup. Overall short-term trend remains bullish with minor retracement before continuation. COINBASE:BTCUSD

ETHEREUM - Buy Zone 3930 - 3990 Market Trend: Ethereum is in a bullish trend, with waves (i), (ii), and (iii) of an Elliott Wave cycle already completed.
Short-Term Price Movement: The market is expected to correct in wave (iv), testing the $3,960–$3,880 support zone.
Buy again if the price touch again the level 3930-3990 and reverse.
confirm only!!!
if stays above $3,880, wave (v) is projected to target the $4,400–$4,500 zone.
COINBASE:ETHUSD
