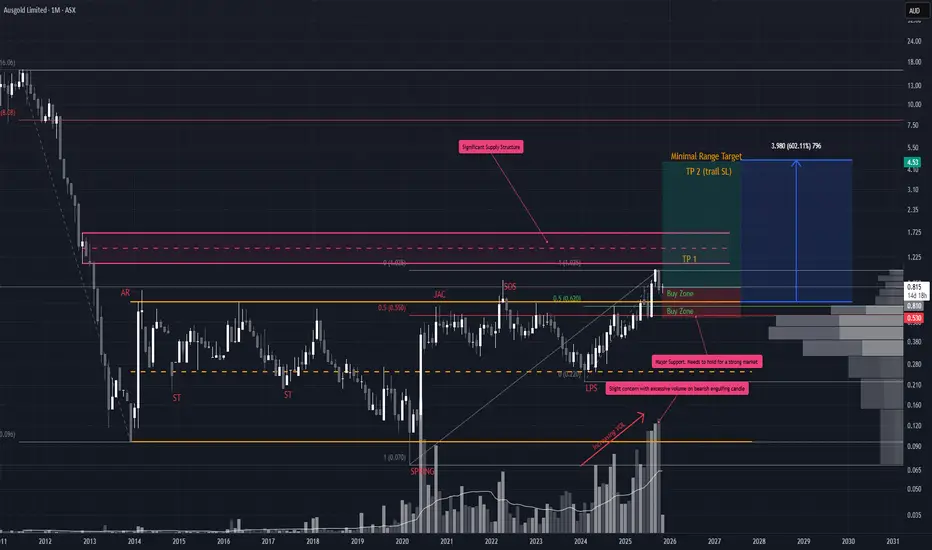
AUC Pulling Into Key AOI
AUC setup is shaping up well. After the initial breakout on expanding volume, price has pulled back ~30% and now retesting the top of the prior range. That’s a healthy retrace, and structurally, the chart still leans bullish.
Entry
You could begin scaling in here, but the more compelling support zone sits closer to ~$0.56. Notably, October closed with heavy volume and a bearish engulfing candle so ideally, we want to see this pullback continue on declining volume with overlapping candles. That would signal absorption rather than distribution.
Take Profit (TP)
• First TP sits around the EQ of the monthly supply structure (already marked).
• Beyond that, there’s minimal overhead resistance, so you can trail stops using higher swing lows as they form.
Stop Loss (SL)
• Since we haven’t seen a new swing low (LPS) yet, the $0.220 LPS remains the logical invalidation point.
• Once a monthly higher low confirms, you can tighten the stop accordingly.
• Until then, risk management is key especially for a small cap stock
Gann
Breakout on M15Short term consolidation in this 15minute wedge before another attempt to all time high? Looking for bullish breakout for a valid set up for some longs on M5. If no confirmation, set up becomes invalid and possibility of deeper pullback possible.

Thyrocare : Institutional accumulation ??Thyrocare : showing big volume bars indicating institutional accumulation.
saucer/round bottom formation.
Need to keep eye n trade deal
Techinical targets shows more than 50% upside potenrioal
Positional call for 3 to 4 months

IFL c wave completionHey people,
Watch the clip.
Waiting for a c wave clip down then reversal signals and bar charts.
Regards,
Zakaria

Gokaldas : News about trade deal Gokaldas : News about trade deal.
Gokaldas in vital player in textile market, most of its revenue comes from USA.
News about trade deal seems positive
targets : 846, 941
SL : 3%
Its not buy/sell recomendation, do your own research.

TCS Hourly Trend AnalysisAs per technical study and price patterns and timing methods, I expect TCS to take a strong bull move towards the resistance of 3273. Increasing volume supports this bull trend till November 17, 2025.
There may be a possibility of profit booking post Nov 17.
This is my personal view based on my analysis. Traders are suggested to conduct own technical studies for entries and exits with proper risk management.

Gold needs to break through 4150-4160 to move higher.This week, gold prices broke free from the previous sluggish range-bound trading pattern, showing a strong upward trend, and market sentiment has clearly shifted to optimism. At the opening of trading on Monday, I clearly pointed out in my analysis that once gold prices effectively broke through the key support zone of 4030-4050, the market would enter an upward channel – and the actual market developments precisely confirmed this judgment. Currently, gold prices are encountering significant resistance around the 4150 level. This level represents a resistance point where prices have repeatedly surged and then retreated in the past, forming a dense resistance zone in terms of technical patterns. If the bulls want to further expand their gains, they must strongly break through the key resistance area of 4150-4160; this range will become the core observation window for subsequent trading.
Strategically, we remain committed to the principle of "buying on dips". Conservative investors can gradually establish long positions in the 4080-4110 range, seizing opportunities during pullbacks; if the price chooses to rise strongly without a deep retracement, then once it stabilizes above 4130, one can decisively go long, following the trend.
The above is my personal analysis and is for discussion and reference only. If you agree with this approach, please like and follow to show your support! It should be emphasized that any strategy is time-sensitive and should not be applied rigidly. It is essential to adjust it flexibly in light of real-time market conditions. I will continue to monitor market changes and update trading notifications in the channel in a timely manner.

Gold maintains its upward trend.Gold continued its upward trend, with the New York closing price holding above the 5-day moving average (MA5). The 10-day and 7-day moving averages (MA10/MA7) remain upward-sloping, and the Bollinger Bands on the 4-hour and hourly charts are also widening upwards, with the price remaining within the upper half of the Bollinger Bands. The moving average system continues its upward trend, and the MACD indicator shows a golden cross. The technical outlook for gold remains bullish, and the trading strategy remains to wait for support levels to buy.
On the upside, watch for resistance at the 0.618 Fibonacci retracement level (4190) and the psychological level of 4200. Overall, barring unforeseen events, the likelihood of gold prices breaking new highs for the remainder of the year is low. A wide-range, back-and-forth movement is expected, but the fundamental bullish trend remains unchanged, and the bull market is expected to continue next year. Therefore, any subsequent dips should be used as buying opportunities. A break below the 4381 high is only a matter of time. Short-term support lies at 4100-4080; buy on dips to these levels is a good entry point. However, avoid hasty purchases after significant short-term gains; a sustained upward trend should be characterized by gradual, stepped increases.
Key Levels:
First Support: 4122, Second Support: 4102, Third Support: 4083
First Resistance: 4160, Second Resistance: 4177, Third Resistance: 4200
Gold Intraday Trading Strategy:
Buy: 4105-4110, SL: 4095, TP: 4125-4135;
Sell: 4185-4190, SL: 4200, TP: 4170-4160;
More Analysis →

Chapter One: What is the Adam Theory?
The Adam Theory is about achieving profits in the market... the principles of profiting in any free market worldwide. The Adam Theory guides you to observe the market in a unique way and instructs you to engage in market operations using a relatively distinctive method. It is the purest, simplest, and easiest method to apply for profiting in market operations... using only the information revealed by the market itself.
The role of the Adam Theory goes beyond this. It also informs traders of the most likely direction the market will take in the future. By employing the predictive techniques of the Adam Theory, traders can estimate and clearly see the path ahead. Then, traders can ask themselves, "Do I want to enter the market?" If the answer is affirmative, they should enter immediately.
The Adam Theory can be applied to any time frame. That is, it can be used on monthly, weekly, daily, or intraday charts. It is a theory based on visual reactions, and a simple candlestick chart can make it very clear without the need for mathematics.
Now, using candlestick charts, return to the question, "Do you want to trade?" If the answer is affirmative, the trader enters the market. The next day, the trader applies the Adam Theory again to discern the most likely path of the market and asks, "Do I still want to trade?" Eventually, the answer will be "no," and the Adam Theory will guide you to exit the market.
When performing the above tasks, the Adam Theory only observes the information revealed by the market itself... never making arbitrary judgments. The Adam Theory is the simplest and purest concept... yet most traders overlook it.
As J. Welles Wilder Jr. stated:
"The Adam Theory is concerned with this question: What are the fundamental principles for profiting in the market?
Or, in other words, how does the Adam Theory complete the following sentence: To succeed in the market, we must ______?
Are there common principles that traders, whether intentionally or unintentionally, apply to win in the market?"
"Please note that theories about how markets operate and develop are different from profiting in the market. The Adam Theory does not primarily discuss the market or how it operates but rather the secret to succeeding in the market. This is a distinction.
The greater the secret, the simpler it is—this is a reasonable statement. This is why the Adam Theory is often overlooked: because it is too simple. The human mind is extremely fond of complexity and difficulty; it likes to challenge itself. As a result, the mind often fails to grasp simple things, asking, 'Is this a great truth? How can it be so absurdly simple?'
The Adam Theory addresses the fundamental truth of things, discussing only what happens. It does not seem novel or complex, but that is its strength. Please note that the Adam Theory does not discuss what should happen or what is impressive. It focuses on one thing only—what truly, factually happens. Everything is simple and not at all difficult to understand.
When thinking about the Adam Theory, the only concern is one thing—what happens? Anything else may be interesting, but it is not important."

Gold Technical Time Outlook – November 12, 2025 Gold Technica Timel Outlook – November 12, 2025
Gold is currently trading around $4,133/oz, showing a mild correction within the ongoing bullish wave.
The structure suggests a retest of the 0.618 Fibonacci support zone near $4,115 before the next impulsive leg higher begins.
🔹 Support zone: $4,115 – $4,105
🔹 Key pivot level: $4,154
🔹 Projected targets:
$4,188 → Fibonacci 1.618 extension
$4,227 – $4,287 → next resistance cluster and wave 3 completion zone
$4,386 → potential final target for wave 5 based on time and price extensions
Time projection:
Bullish momentum is expected to accelerate between November 14–18, supported by both Fibonacci time and price confluence on the 1H chart.
Summary:
As long as price holds above $4,105, the overall trend remains bullish, favoring long setups from retracement areas toward the $4,188 – $4,287 range in the short term.

xauusd BuyThe price had fallen to a crucial support level near $4100 and traders anticipated a rebound.
Risk: To mitigate potential losses, the trade set a strict limit at $4108
Objective: The upward targets for the price were set between $4180- 4138 and $4145
FXOPEN:XAUUSD

#Bitcoin in Buy mode in this support level 12NOV25 _#buy@low #sell@high Simple trading strategy support & resistance
The past few days, I have been posting that #BTC is at a good support level to enter the market. If you go back to my past posts and videos, you can see the support level I am more interested in entering the market at.
#BTC #forex #supportortandresistance #tradinging #swingtradingstrategies #buy #sellll #EURUSD #goldd #niftyy #s&p #etf #qqq #iwm #future #options #longterm
#btc #forex #etf #option #money #earning #dollars #bitcoin,#btc,#spy,#forex,#bitcoin,#supportlevel,#RESISTANCELEVEL,#TESLA,#S&P500,#NVDIA,#APPLE,#AMAZON,#NIFTY,#META,#RSI,#STOCKMARKET,#SHAREMARKET,#GOLD,#OIL,#SILVER,#INTRADAY,#SWINGTRADE,#LONGTERM,#INVESTMENT,#SELL,#BUY,#BID,#ASK,#MARKET,#INVESTORS,#IWM,#OPTION,#FUTURES,#US,#ALIBABA,#CASH,#CASHFLOW

ETH/USDETH/USD TRADE IDEA – @MIYA_BROTHERS
Market is currently trading inside a rising channel, maintaining a bullish market structure.
Expecting a corrective pullback into demand zones before continuation to the upside.
Key Levels to Watch:
Demand Zone 1: 3510 – 3460
Demand Zone 2: 3380 – 3330
Target Zone: 3600 – 3700+
If price forms a higher low inside the channel and shows bullish confirmation (rejection wick / break & retest), we look for long opportunities.
Bias: Bullish Continuation
Confirmation Required: Yes
Not Financial Advice. Personal analysis only.

USD/JPU BUYUSD/JPY TRADE IDEA – @MIYA_BROTHERS
Price is in a bullish structure overall. Expecting a pullback into the demand zone before continuation to the upside.
Buy Zone: 153.560 – 153.300
Stop Loss: 153.010
Target: 154.950+
Wait for bullish confirmation (rejection wick / break & retest / momentum push) before entering.
This is not financial advice. Personal analysis only.

GBPUSD FRGNT Daily Forecast & Pre London Breakdown -Q4 |W46 |D11
📅 Q4 | W46 | D11 | Y25 |
📊 GBPUSD FRGNT Daily Forecast & Pre London Breakdown
🔍 Analysis Approach:
I’m applying Smart Money Concepts, focusing on:
Identifying Points of Interest on the Higher Time Frames (HTFs) 🕰️
Using those POIs to define a clear trading range 📐
Refining those zones on Lower Time Frames (LTFs) 🔎
Waiting for a Break of Structure (BoS) for confirmation ✅
This method allows me to stay precise, disciplined, and aligned with the market narrative, rather than chasing price.
💡 My Motto:
"Capital management, discipline, and consistency in your trading edge."
A positive risk-to-reward ratio, paired with a high win rate, is the backbone of any solid trading plan 📈🔐
⚠️ Losses?
They’re part of the mathematical game of trading 🎲
They don’t define you — they’re necessary, they happen, and we move forward 📊➡️
🙏 I appreciate you taking the time to review my Daily Forecast.
Stay sharp, stay consistent, and protect your capital
— FRNGT 🚀
FX:GBPUSD

GBPUSD FRGNT Daily Forecast Entry Breakdown -Q4 | W46 | D11 | 📅 Q4 | W46 | D11 | Y25 |
📊 GBPUSD FRGNT Daily Forecast Entry Breakdown
🔍 Analysis Approach:
I’m applying Smart Money Concepts, focusing on:
Identifying Points of Interest on the Higher Time Frames (HTFs) 🕰️
Using those POIs to define a clear trading range 📐
Refining those zones on Lower Time Frames (LTFs) 🔎
Waiting for a Break of Structure (BoS) for confirmation ✅
This method allows me to stay precise, disciplined, and aligned with the market narrative, rather than chasing price.
💡 My Motto:
"Capital management, discipline, and consistency in your trading edge."
A positive risk-to-reward ratio, paired with a high win rate, is the backbone of any solid trading plan 📈🔐
⚠️ Losses?
They’re part of the mathematical game of trading 🎲
They don’t define you — they’re necessary, they happen, and we move forward 📊➡️
🙏 I appreciate you taking the time to review my Daily Forecast.
Stay sharp, stay consistent, and protect your capital
— FRNGT 🚀
FX:GBPUSD

XAUUSD: Market Analysis and Strategy for November 11Gold Technical Analysis:
Daily Resistance: 4192, Support: 4030
4-Hour Resistance: 4150, Support: 4080
1-Hour Resistance: 4150, Support: 4125
From a technical perspective, the monthly/weekly charts continue to show a bullish trend in the short term. The daily chart's "rounded bottom" upward pattern is basically confirmed, and the MACD/KDJ indicators provide support for upward momentum. As those who have read my recent analyses know, I have consistently emphasized that a break above 4080-4085 would further trigger bullish sentiment. Going forward, pay attention to the support level where the previous resistance turned into support, and also monitor the continuation of the upward trend. Support is expected around 4085-4080.
Combined with the 1-hour chart, although the upward momentum of the moving averages has slowed somewhat, the overall trend remains unchanged. During the European and American sessions, watch for opportunities to buy if the price tests the support levels around 4125 and 4117.
BUY:4125~4117
BUY:4102near
BUY:4090near
SELL:4155~4162near

Gold Buying Plan.Gold continued its expected bullish trend, rising further after the Asian session opened. The daily chart closed sharply higher, breaking through and firmly establishing itself above the $4100 mark. The 10-day and 7-day moving averages have formed a golden cross and are trending upwards, while the RSI indicator is above the 50 level. On the hourly and 4-hour charts, the Bollinger Bands are widening upwards, with the price trading within the upper half of the band, and the moving average system is also trending upwards. Gold remains bullish!
In the short term, some downward correction is possible, which is normal given Monday's gains of over $100. A short-term technical pullback is reasonable. However, the strength of this correction remains to be seen, as it occurs within a strong uptrend and can unfold in various ways, not necessarily a large price drop, but perhaps a period of sideways consolidation.
If the price quickly completes its technical correction near the short-term support level, then the market may see a period of high-level consolidation or even a second upward move. For support, we're watching the intraday low of 4080 from Monday. If this level holds, the current rebound isn't likely over yet, and we can consider buying on dips near this support level.
Key Levels:
First Support: 4100, Second Support: 4081, Third Support: 4060
First Resistance: 4140, Second Resistance: 4168, Third Resistance: 4192
Gold Intraday Trading Strategy:
Buy: 4090-4095, SL: 4080, TP: 4120-4130;
Sell: 4185-4190, SL: 4200, TP: 4170-4160;
More Analysis →

Go long on gold in line with market trendsThis week saw significant changes in the gold market. After opening, gold prices broke out of their previous prolonged consolidation pattern, strongly breaking through a key resistance area and re-entering a one-sided upward trend. The previous resistance in the 4030-4050 range was completely broken, and the bulls quickly took control, driving prices to continue to climb. As emphasized in the previous analysis, once the gold price breaks through the key technical range of 4030-4050, it will signify the start of a new upward trend. Looking at the actual price action, since the breakout, gold has experienced almost no significant pullback, with strong buying support and a clear shift in market sentiment towards optimism. To date, the price has risen by several hundred dollars, demonstrating strong upward momentum.
Reviewing yesterday's viewpoint, we clearly pointed out that when prices successfully break through key resistance levels, trading strategies should be adjusted accordingly, shifting from observation or short-term trading to trend-following and actively establishing long positions. Currently, gold prices are once again approaching the important resistance area of 4150-4160, which had previously encountered resistance multiple times. This area has formed several interim highs in the past few trading cycles, and is a double pressure zone in terms of market psychology and technical structure. If this price breaks through and holds above this level with significant volume, the upside potential is likely to expand further, making a return to the 4200 level highly probable, and it may even continue to move towards higher targets.
In terms of specific trading strategies, it is recommended to maintain a buy-on-dips approach, seizing entry opportunities during pullbacks. An ideal entry range is 4105 to 4125. Within this range, long positions can be established in batches to control risk while ensuring no loss of the main upward trend. Close monitoring of market movements is crucial, especially the reaction in the 4150-4160 range—if the price recovers quickly after a brief period of resistance with increased volume, it can be considered a breakout signal; conversely, caution is warranted regarding short-term profit-taking volatility.
Overall, this round of gold price increases is not only due to the confirmed technical breakout but also influenced by recent changes in the global macroeconomic environment, including rising inflation expectations, increased geopolitical uncertainty, and increased gold reserves held by some central banks. Until there are signs of a trend reversal, maintaining a bullish mindset and closely following the market rhythm will be the safest approach at present.
The above represents only my personal thoughts. If you find it helpful, please like and follow to show your support! Please note that any strategy is time-sensitive and may change as market conditions evolve. I will notify you in the channel based on the actual market situation!

Silver Buy PlanSilver Buy Plan
I’ll wait for confirmation before taking a buy trade.
Recently, a CISD formed, which may push the price lower. There’s a strong bullish order block sitting much lower, and that zone can act as the base for an upward move.
For now, I’ll just observe the market closely. Once price action aligns with my criteria, I’ll look for a buy setup.
We already have a sweep of the previous low, and my first target will be around the equilibrium or the previous week’s level.

USDCHFUSDCHF
- Bearish Channel as an corrective pattern in Short Time Frame
- Support Level
- RSI - Divergence
- Double Bottom in Long Time Frame
- Completed " 12345 " Impulsive Waves and " ABC " Corrective Waves

Dow Jones Indus (US30)Price has completed a clean sweep of sell-side liquidity and is now showing strong displacement toward the upside. The recent break in structure confirms short-term bullish intent.
If price returns to the fair value gap or discount zone, I’ll look for confirmation to enter in alignment with the intraday bullish flow.
My first target remains the internal liquidity zone, and the potential extended target is the previous day’s high where buy-side liquidity rests.

#LEVER/USDT Potential liquidity sweep and pump#LEVER
The price is moving within an ascending channel on the 1-hour timeframe and is adhering to it well. It is poised to break out strongly and retest the channel.
We have a downtrend line on the RSI indicator that is about to break and retest, which supports the upward move.
There is a key support zone in green at 0.00002185, representing a strong support point.
We have a trend of consolidation above the 100-period moving average.
Entry price: 0.00002250
First target: 0.00002295
Second target: 0.00002350
Third target: 0.00002414
Don't forget a simple money management rule.
Place your stop-loss order below the green support zone.
Once you reach the first target, save some money and then change your stop-loss order to an entry order.
For any questions, please leave a comment.
Thank you.
