DOW JonesUS 30 - DJI Dow Jones
- Bullish Channel as an corrective pattern in Short Time Frame
- Break of Structure
- Demand Zone
- Completed " 1234 " Impulsive Waves
- RSI - Divergence
Gann

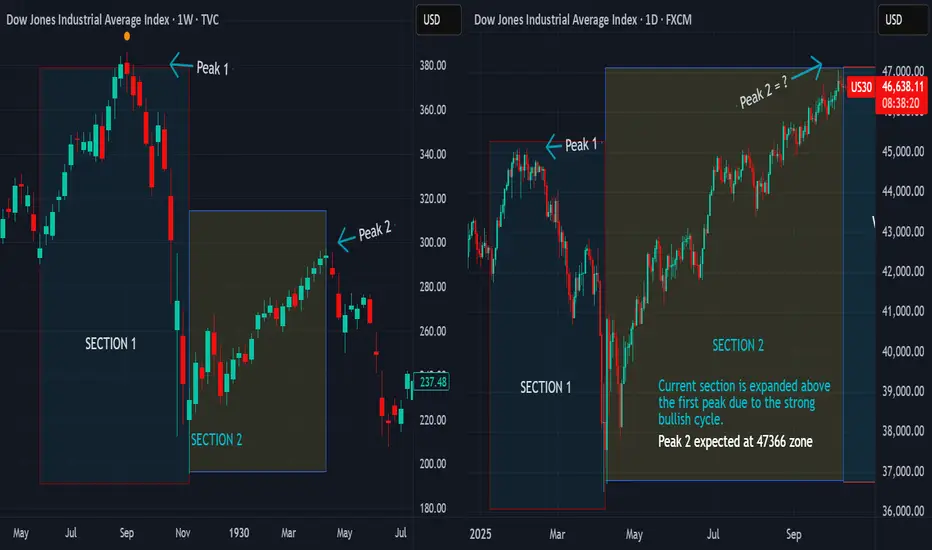
MARKETS AT CROSSROADS... THE STORIES OF TOMMORROWA picture is worth a thousand words.
We are comparing the 7-months cycle currently unravelling with its fractal counterparts that have repeated with striking periodicity in the past.
We will compare the trends that follow the completion of the cycle in each of the fractals.
Fractal 1 - (28/06/1965 - 07/02/1966) compared to (07/04/2025 to present)
Fractal 2 (19/10/1987 - 16/07/1990) compared to present
Fractal 3 (07/10/2002 - 16/10/2007) compared to present
In the last two shots, we have represented the entire 5-year cycle so we could see the entire picture for a clearer view. It is interesting to note that the last 7-months cycle is itself a fractal of the entire 5-year cycle.
There are several of them but we would represent only three to make the illustrations simpler.
FOR THE TRENDS THAT FOLLOW THE COMPLETION OF THESE FRACTALS...
April 1930 - July 1932
Feb 1966 - October 1966
July 1990 - October 1990
October 2007 - March 2009
5 out of 5 the market corrected at completion of this cycle. Also by observation the declines are sharp and the recoveries are massive, starting a second wave of hyper-bullish trends
TWO OCCASSIONS WHERE THE CORRECTION WAS PROLONGED
WHATS AHEAD...?
Markets are running into a correction, between October 2025 to February 2026, we expect wide asset classes and global indices to stage a correction. The correction should be quick and sudden which likely would complete in April 2026. A second wave of sharp bullish trend would follow into 2027. We expect a second correction that could start from Feb/March 2027 making a bottom in October 2027. This bottom will be the base for the next 5-year hyper-bullish trend completing the entire 13-year Cycle from 2020.
Follow and check back for the price levels breakdown
Trade safe and good luck.
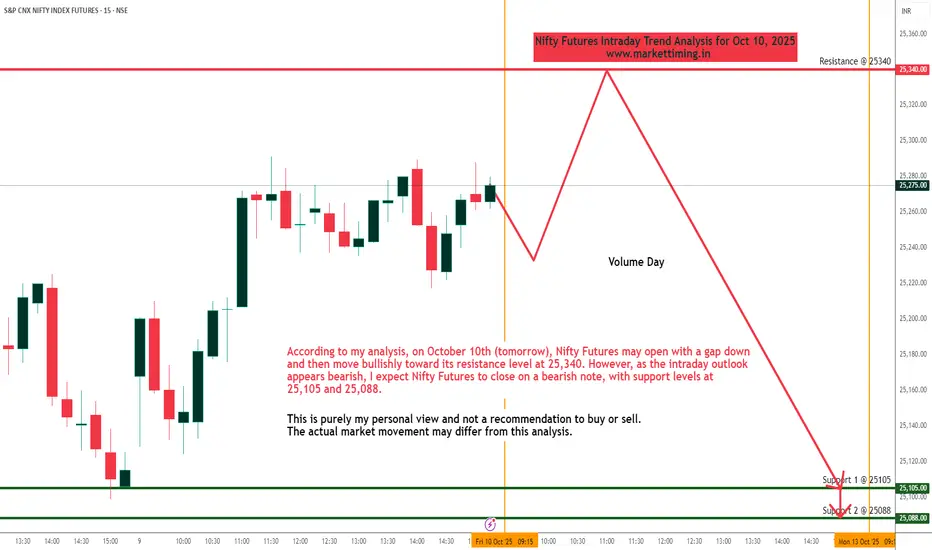
Nifty Futures Intraday Trend Analysis for October 10, 2025According to my analysis, on October 10th (tomorrow), Nifty Futures may open with a gap down and then move bullishly toward its resistance level at 25,340. However, as the intraday outlook appears bearish, I expect Nifty Futures to close on a bearish note, with support levels at 25,105 and 25,088.
This is purely my personal view and not a recommendation to buy or sell. The actual market movement may differ from this analysis.
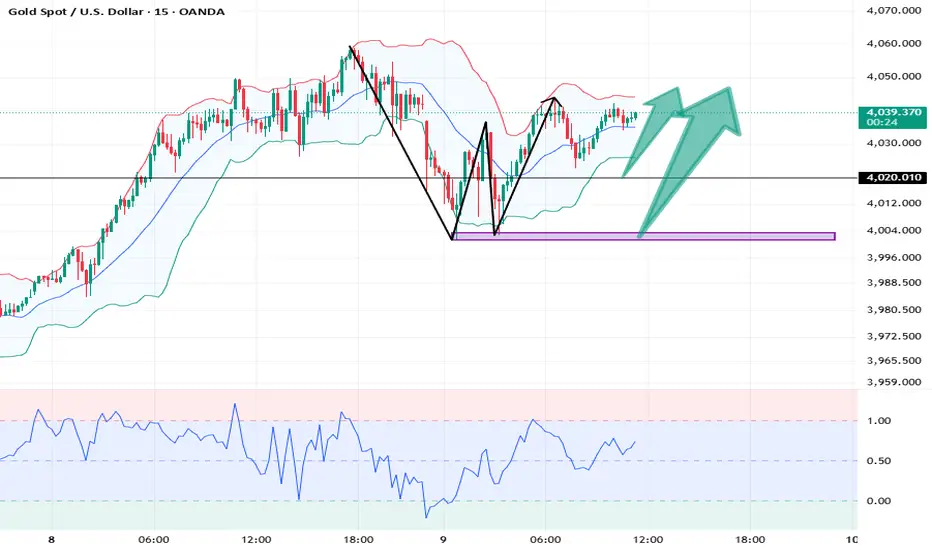
XAUUSD: Market Analysis and Strategy for October 9thGold Technical Analysis
Daily chart resistance: 4080, support: 3885
Four-hour chart resistance: 4060, support: 4020
One-hour chart resistance: 4047, support: 4020
Gold News Analysis: Heightened geopolitical and economic uncertainty, coupled with market expectations of a US interest rate cut, have prompted investors to flock to safe-haven assets. This gold boom is driven by a multi-pronged force. The Federal Reserve's monetary policy shift has been the strongest driver. With the US government shutdown and the release of key economic data stalled, market expectations for a rate cut have intensified. Futures contracts indicate that traders are betting with an over 80% probability that the Fed will announce a 25 basis point rate cut at this month's meeting, followed by another similar cut in December.
Gold Trading Recommendations: Based on the four-hour chart, key support levels remain at 4020 and 4000. Upside pressure is at 4047, with buying opportunities awaiting a pullback to support levels. (Selling is risky, so try a small size.)
Buy: 4020near
Buy: 4000near
Sell: 4047near

Nifty LongLogic
25k has DZ on 60/75 Min TF, along with this W4 of EW, also respected all the conditions.
Now on HTF, we have created HH/HL/HC also. In W5, we should test 25300/500 levels with
RSI divergence. I will exit trade either on above mentioned levels or if the Index has an hourly
close below the previous candle low.

Double Bottoms and Double Tops Providing some education about market shifting shapes alongside live market conditions
Also, I am being taught by the AI mentor whilst is works with the live markets

The Dynamics of the Global Metals MarketIntroduction
The metals market plays a fundamental role in the global economy, serving as the backbone of industrial production, infrastructure development, technological innovation, and trade. From construction and automotive manufacturing to electronics and renewable energy systems, metals such as iron, copper, aluminum, nickel, and precious metals like gold and silver are indispensable. The metals market operates through a complex network of producers, traders, investors, and consumers, driven by global supply-demand dynamics, price fluctuations, and geopolitical influences.
Understanding how the metals market works requires examining the intricate mechanisms that govern mining, refining, pricing, trading, and consumption. This essay explores the structure, participants, and economic functions of the global metals market, with special emphasis on commodity exchanges, price formation, market trends, investment dynamics, and the influence of global factors such as industrialization, technological change, and sustainability transitions.
1. Structure of the Global Metals Market
1.1 Primary and Secondary Metals Markets
The metals market can be broadly categorized into two segments — the primary market, which deals with newly mined and refined metals, and the secondary market, which focuses on recycled or scrap metals.
Primary Metals Market:
The primary market begins with mining operations where raw ores are extracted from the earth. These ores undergo processing and refining to produce pure metals or alloys. The primary market includes large-scale mining corporations such as BHP, Rio Tinto, and Vale, which dominate global production of metals like iron ore, copper, and aluminum.
Secondary Metals Market:
The secondary market handles recycling and reprocessing of scrap metals. It plays a critical role in promoting sustainability and reducing the carbon footprint of the metals industry. For example, recycled aluminum requires only about 5% of the energy needed to produce new aluminum from bauxite ore.
1.2 Classification by Metal Type
Metals are also classified into three categories based on their properties and uses:
Base Metals: Common metals such as copper, aluminum, zinc, lead, and nickel. These are widely used in construction, manufacturing, and energy.
Precious Metals: Metals like gold, silver, platinum, and palladium, valued for rarity, aesthetic appeal, and use as a store of value.
Ferrous and Non-Ferrous Metals: Ferrous metals contain iron (e.g., steel, cast iron), while non-ferrous metals do not (e.g., copper, aluminum, tin). Ferrous metals dominate in heavy industries, while non-ferrous metals are vital in electrical and transportation sectors.
2. Key Participants in the Metals Market
The metals market involves diverse participants with different roles, motivations, and time horizons. These include:
2.1 Producers
Producers are mining and refining companies responsible for the extraction and processing of metal ores. They include global giants like Glencore, Rio Tinto, BHP, and Norilsk Nickel. Producers influence market supply levels, production costs, and long-term investment trends.
2.2 Consumers
Consumers of metals include manufacturing industries such as:
Construction (steel, aluminum)
Automotive (steel, nickel, aluminum)
Electronics (copper, gold, silver)
Energy (copper, nickel, lithium for batteries)
China is the world’s largest consumer of metals, accounting for over 50% of global demand for key industrial metals due to its rapid industrialization and urbanization.
2.3 Traders and Intermediaries
Traders facilitate the buying and selling of metals on global commodity exchanges. They include physical traders (handling actual shipments) and financial traders (speculating through derivatives such as futures and options). Major trading hubs include London, New York, Shanghai, and Singapore.
2.4 Investors and Speculators
Investment funds, hedge funds, and retail investors participate in metals markets for diversification or speculative purposes. They use financial instruments such as exchange-traded funds (ETFs), futures contracts, and options to gain exposure to metal prices.
2.5 Governments and Regulators
Governments play a key role through regulation, taxation, export controls, and strategic reserves. For example, China’s control over rare earth metals impacts global supply chains, while the U.S. maintains a strategic stockpile of critical minerals for defense and technology.
3. Mechanisms of Metal Trading
3.1 Physical Market vs. Paper Market
The metals market operates through two interconnected segments:
Physical Market: Involves the actual buying, selling, and shipment of metals in various forms — ingots, sheets, rods, or concentrates. Pricing is based on spot market rates.
Paper Market: Involves financial contracts such as futures, forwards, and options that represent a promise to deliver or receive a metal at a future date. These are traded on exchanges like the London Metal Exchange (LME), Chicago Mercantile Exchange (CME), and Shanghai Futures Exchange (SHFE).
3.2 Commodity Exchanges
The London Metal Exchange (LME) is the world’s largest market for base metals trading. It sets global benchmark prices for metals such as copper, aluminum, and zinc. Trading occurs through:
Ring trading (open outcry),
Electronic trading, and
Over-the-counter (OTC) contracts.
Each exchange provides transparency, liquidity, and standardized contracts that enable producers, consumers, and investors to hedge against price risks.
3.3 Price Discovery and Benchmarking
Metal prices are determined by global supply and demand but are standardized through benchmark pricing. LME prices often serve as global benchmarks. Prices are influenced by:
Mining output
Industrial demand
Energy costs
Inventory levels
Geopolitical events
Currency fluctuations (especially the U.S. dollar)
4. Price Formation and Market Influences
4.1 Supply-Side Factors
Mining Output and Reserves: Mining disruptions due to strikes, natural disasters, or regulatory issues can reduce supply.
Energy Costs: Metal production is energy-intensive; fluctuations in oil and electricity prices directly affect costs.
Technological Advancements: Innovations in mining and recycling improve efficiency and lower production costs.
4.2 Demand-Side Factors
Industrialization and Infrastructure: Economic growth in developing countries increases demand for steel, copper, and aluminum.
Technology and Electrification: The rise of electric vehicles (EVs) and renewable energy systems has boosted demand for copper, nickel, and lithium.
Consumer Preferences: Shifts toward sustainable and green technologies influence metal consumption patterns.
4.3 Macroeconomic and Financial Factors
Interest Rates and Inflation: Metals often serve as inflation hedges; high inflation or low interest rates drive investment demand.
Currency Movements: Metals are priced in U.S. dollars, so a weaker dollar generally boosts metal prices.
Global Trade Policies: Tariffs, export bans, and sanctions can distort trade flows and pricing.
4.4 Geopolitical and Environmental Influences
Geopolitical Tensions: Conflicts or trade wars can disrupt supply chains. For example, sanctions on Russian nickel and aluminum affected global markets.
Environmental Regulations: Stricter emissions standards and sustainability targets affect mining operations and recycling initiatives.
5. Metals as Investment Assets
5.1 Precious Metals as Safe Havens
Gold and silver are traditional safe-haven assets. During economic uncertainty or financial crises, investors turn to these metals to preserve value. Central banks also hold gold reserves as part of their monetary policy tools.
5.2 Industrial Metals and Economic Growth
Industrial metals such as copper, aluminum, and nickel are considered barometers of global economic health. Rising prices often signal industrial expansion, while declining prices indicate economic slowdown.
5.3 Investment Instruments
Investors can gain exposure to metals through:
Physical bullion and coins
Exchange-Traded Funds (ETFs)
Mining company stocks
Futures and options
Commodity index funds
5.4 Hedging and Risk Management
Manufacturers and producers use metal derivatives to hedge against price fluctuations. For example, an airline company may hedge aluminum prices to stabilize aircraft production costs.
6. Sustainability and the Future of Metals
6.1 Green Transition and Critical Minerals
The global shift toward renewable energy and electric vehicles has created unprecedented demand for critical minerals such as lithium, cobalt, nickel, and rare earth elements. These metals are vital for batteries, solar panels, and wind turbines.
6.2 Circular Economy and Recycling
Recycling metals reduces environmental impact, lowers production costs, and supports the circular economy. Technological advances in metal recovery are making recycling increasingly efficient and profitable.
6.3 ESG and Responsible Mining
Environmental, Social, and Governance (ESG) principles are reshaping the metals industry. Investors now demand transparency on carbon emissions, labor practices, and biodiversity impacts. Companies failing to meet ESG standards face reputational and financial risks.
6.4 Technological Innovations
Automation and AI in mining enhance safety and efficiency.
Blockchain technology is improving supply chain traceability.
Hydrogen-based steel production promises low-carbon alternatives to traditional blast furnaces.
7. Case Studies in the Metals Market
7.1 Copper Market Dynamics
Copper is known as “Dr. Copper” because its price movements reflect global economic health. The rise of electric vehicles and renewable infrastructure has significantly increased copper demand. Supply bottlenecks in Chile and Peru, which together account for nearly 40% of world production, often create price volatility.
7.2 Aluminum and Energy Dependence
Aluminum smelting is highly energy-intensive, making it sensitive to electricity prices. Energy crises, such as the one in Europe in 2022, led to major production cuts and higher aluminum prices worldwide.
7.3 Gold and Monetary Policy
Gold prices are heavily influenced by monetary policy, particularly interest rate decisions by the U.S. Federal Reserve. During periods of economic uncertainty, investors move from equities to gold, driving up demand.
7.4 Rare Earth Metals and Geopolitics
China’s dominance in rare earth metal production (over 80% of global supply) gives it strategic leverage in global technology and defense industries. The U.S. and EU have since accelerated efforts to diversify supply sources.
8. Challenges and Risks in the Metals Market
8.1 Price Volatility
The metals market is inherently volatile due to its sensitivity to macroeconomic and geopolitical developments. Sudden price swings can affect profitability for producers and manufacturers.
8.2 Environmental Concerns
Mining and metal processing contribute to deforestation, water pollution, and greenhouse gas emissions. Transitioning to sustainable mining practices is both a challenge and necessity.
8.3 Resource Nationalism
Countries rich in mineral resources often impose export restrictions or higher taxes to retain more value domestically. This can disrupt global supply chains.
8.4 Technological Disruption
Advances in materials science, such as graphene or alternative composites, may reduce reliance on certain metals, altering long-term demand patterns.
9. The Future Outlook of Metals Markets
The coming decades are expected to bring profound shifts in the metals industry:
Electrification and Energy Transition: Demand for copper, lithium, nickel, and cobalt will continue to soar as the world moves toward clean energy systems.
Digitalization: AI, IoT, and blockchain will enhance transparency and efficiency in metal trading and logistics.
Supply Chain Diversification: Countries will seek to reduce dependence on single suppliers, leading to new mining projects in Africa, South America, and Southeast Asia.
Recycling Revolution: Technological innovation in recycling will make secondary metal markets increasingly competitive.
Carbon Neutrality Goals: The push toward net-zero emissions will reshape production methods and pricing structures across the industry.
Conclusion
The metals market is a dynamic and essential component of the global economy. It integrates the forces of production, consumption, finance, and geopolitics into a vast network that underpins industrial and technological progress. Understanding how the metals market works requires a comprehensive view of its structure, participants, pricing mechanisms, and global interdependencies.
As the world transitions toward a sustainable and digital future, the metals market faces both immense challenges and opportunities. The rise of renewable energy, electric mobility, and green technologies will redefine demand for critical minerals. Meanwhile, innovations in recycling, ESG governance, and digital trading platforms promise to make the industry more efficient and transparent.
Ultimately, the metals market is not merely a trading arena but a mirror of human progress — reflecting the evolution of civilization, the rhythm of industrial growth, and the aspirations of a planet striving toward sustainability and prosperity.
Aster Looking to BreakoutAster candles have opened above the arcs on multiple timeframes - The candles need to hold the 78.6% Fib and the ascending support of the Gann 1x1 fib ray to continue the gains - If Aster can break upwards the ultimate target is around $4.20-$4.50 on the 6hr chart - If Aster breaks down here it will look for support around $1.70

DXY, EUR/USD, GBP/USD, and Bitcoin Daily Analysis for 08/10/2025DXY has shown a relative short term retracement which will affect the price delivery for EU, GBP and btc click to find out our next bias

Fakeout, now breakout.Rejected the top resistance fell, then broke.. only up from here. Target potential between nov 11 to December 11.. minimum 11,500..

the market has shifted above the comfort zone of this forecastit's been a good run of accurate forecasts, this may be the first one that doesn't work out
this could be due to the higher timeframe trying to pull the market up...I'll take another look at it in a few hours
sometimes BTC does some silly things, then jumps back into form. thus I'm going to let this play out before updating pushing out another forecast

Live Analysis and Two Trade Signals for EURUSD - Short Long termWDGann
Trendline
Fibronnaci
EMAs all combined
Two signals in one trade long term and short term live analysis
Farid Premani

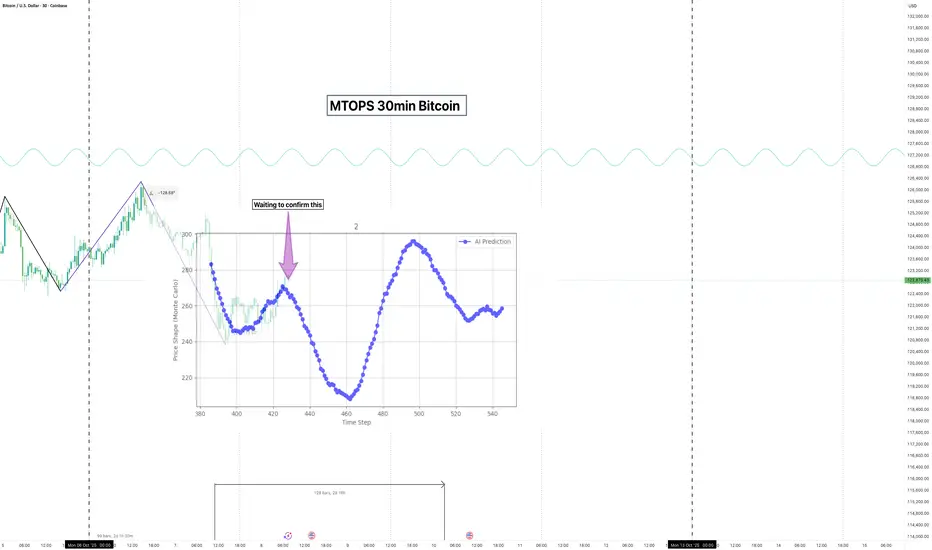
AI FORECAST OUT - waiting on confirmation the base model seems to be on fire, with 5 out of 5 forecasts correct
I am putting this one out early should we get ahead of the curve
As always, keep your trade sizes responsible if following these calls
XAUUSD: October 6 Market Analysis and StrategyGold Technical Analysis
Weekly chart resistance: 4000, support: 3683.
Daily chart resistance: 3950, support: 3819.
Four-hour chart resistance: 3950, support: 3879.
One-hour chart resistance: 3950, support: 3919.
Gold continues its upward trend. This seemingly sudden surge is actually the inevitable result of the combined forces of monetary policy expectations, political risks, and geopolitical conflicts. Gold, as a safe-haven asset, is attracting investors.
Gold Trading Recommendations: Based on the four-hour chart, focus on the effective support levels below, which remain at 3919-3879. Focus on the 3950 level for upward pressure. If the 3919 support fails, the maximum retracement limit is around 3879. In terms of trading, wait for a pullback before looking for support levels to buy.
BUY: 3919near
BUY: 3879near

id10t error on my previous forecast. I was TOO ZOOMED INBeta testing is a teacher. And it taught me to remember the fundamentals when I use this amazing tech
In this instance I was way too zoomed in.
When correcting the market cycle size on my screen, I got to see the forecast that came out on the 6 October was fire. Yup, it showed us that this $5000 drop was coming in.
It's hard to be human lol

Timing Clusters for Bitcoin Based on chart geometry, the vertical timing lines serve for intraday trading.
Ensure the price reacts at a support or resistance level when it hits a timing line.
Take profit on the next candle or at the next S&R level. Place stops on the opposite S&R.
It's the combination of these two factors that leads to higher rates of success.
There is no top for gold, so don’t trade against the trend!Against the backdrop of the continued US government shutdown and no solution in the short term, the international gold price broke through the two major integer thresholds of $3,900 and $4,000 this week. The shutdown has delayed the release of several key economic data points, increasing uncertainty in financial markets and disrupting the Federal Reserve's monetary policy decisions. Despite this, the market generally expects the Fed to implement two interest rate cuts this year. Meanwhile, political turmoil in France and ongoing global geopolitical risks have further fueled investor demand for safe-haven assets.
There are currently no obvious negative factors in the market, and the overall trend of gold is strong. Next, we need to focus on the upcoming non-farm payroll data and the Federal Reserve meeting minutes. These two pieces of information may bring new volatility and uncertainty to the market.
Judging from this round of rising market, it once again confirms the point that has been repeatedly emphasized before: the market always contains multiple possibilities, there is no absolute "peak", but only a constantly evolving trend. In an environment with a clear upward trend, following market direction is the key strategy for achieving stable returns. Avoid contrarian or emotional trading, especially in the current complex and volatile external environment. Trading without clear judgment and discipline can easily lead to unnecessary losses.
Technical analysis shows bullish momentum in both the long and short term. While the $4,000 level was anticipated, its arrival was slightly faster than anticipated. The current trading strategy recommends maintaining a buy-on-dip strategy while maintaining a cautious approach and avoiding blindly chasing higher prices. As the market has not yet fully stabilized, it is recommended to wait and see and intervene only when clear opportunities arise.
The above analysis is personal and for reference only. Subsequent gold strategies will be updated continuously, so please stay tuned.


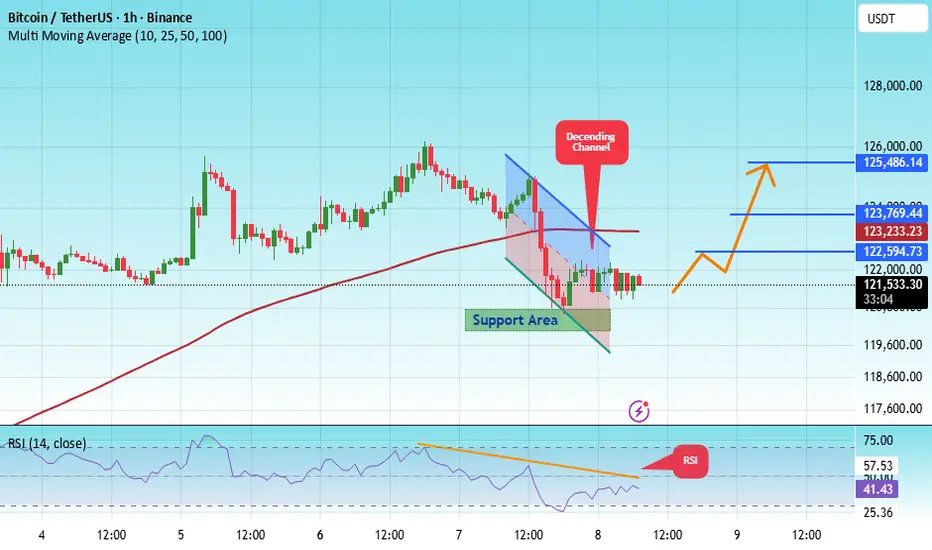
#BTC/USDT bounce from Support, Bullish Momentum Intact#BTC
The price is moving within a descending channel on the 1-hour frame, adhering well to it, and is heading for a strong breakout and retest.
We have a bearish trend on the RSI indicator that is about to be broken and retested, which supports the upward breakout.
There is a major support area in green at 120,500, which represents a strong support point.
We are heading for consolidation above the 100 moving average.
Entry price: 121,666.
First target: 122,600.
Second target: 123,770.
Third target: 125,480.
Don't forget a simple matter: capital management.
When you reach the first target, save some money and then change your stop-loss order to an entry order.
For inquiries, please leave a comment.
Thank you.
#LEVER/USDT Pump Anticipated#LEVER
The price is moving within a descending channel on the 1-hour frame, adhering well to it, and is heading for a strong breakout and retest.
We have a bearish trend on the RSI indicator that is about to be broken and retested, which supports the upward breakout.
There is a major support area in green at 0005705, representing a strong support point.
We are heading for consolidation above the 100 moving average.
Entry price: 0.0006015
First target: 0.0006441
Second target: 0.0006900
Third target: 0.0007600
Don't forget a simple matter: capital management.
When you reach the first target, save some money and then change your stop-loss order to an entry order.
For inquiries, please leave a comment.
Thank you.

EURUSD SELL FORECAST ANALYSISEURUSD SELL FORECAST ANALYSIS - I sent this few days ago showing us where price might want to go to and boom, price just reached the target. You are welcome!

Back-up model did WELL, but Bitcoin disappointed (lol) we got 3 good transitions out of this AI prediction
Where I expected price to rally back up, it instead ranged into a consolidation zone (WEAK!)
I'll load up the next prediction and send that out sometime...
