CFX Ready For Another Leg To The Upside?It has been a while since taking much interest in our favorite crypto projects. After massive gains straight out of the bear market most of that interest has sold off.
Previously we were targeting the 5 cent range and appear to be getting very close.
Current Trading Plan:
Looking at proportional relationships in the price chart to gauge potential moves we can see the average range size seems to be about 400%. After completing a traditional ABC pattern it has moved into our potential accumulation window. Currently looking to accumulate and hold for potential 10x IF the entire market follows.
Gann

BITCOIN - THE BEAR CONTINUES I have been tracking the bearish decline for Bitcoin for about 7 months. We look to be entering into the fireworks moment where it really dumps. The buying opportunity awaits. Unfortunately tho, its only for those who were wise enough to sell the top. My most conservative target has remained $73,500. However, $68,500 - $61,500 now look well within reach. So saving powder for those pull backs seems prudent. Will update upon breaks of $73,500. Elliot Wave, Murrey Math, Kumar Wave being used for this and all of my forecasts. Happy Trading, comments and DMs always welcomed.

Nifty Futures intraday trend analysis on April 7th & 8thAccording to my Trend Analysis, on 7th Nifty Futures is likely to bounce back and the raise will not sustain on April 8th. The levels provided in the chart are calculated without taking Gaps into account. In the first 15mts on 7th April, there is a bullish candle formation. Trade with Stop-Loss.

GOLD-SELL strategy 9 Hourly chart Regression ChannelThe correction went to far to $ 3,068 but feel we will have another go towards $ 30,30 test en route 2,978.
Strategy SELL @ $ 3,110-3,130 and take profit near $ 3,007.

Apple AnalysisThis is the perfect example of price and time squaring. I have used Gann technique , trend & Chart pattern. Then I can see that target will come for sure. And it give a overthrows as we well downside. Be watchful. Enjoy. I have considered one year TF.

DowJones(USA) AnalysisThis is the perfect example of price and time squaring. I have used Gann technique , trend & Chart pattern. Then I can see that target will come for sure. And it give a overthrows as we well downside. Be watchful. Enjoy.

EURUSDDaily broke and closed above the last High, giving more confirmation to the uptrend.
We also have an uptrend on a lower timeframe, we are close to a fundamental key level of 1.12

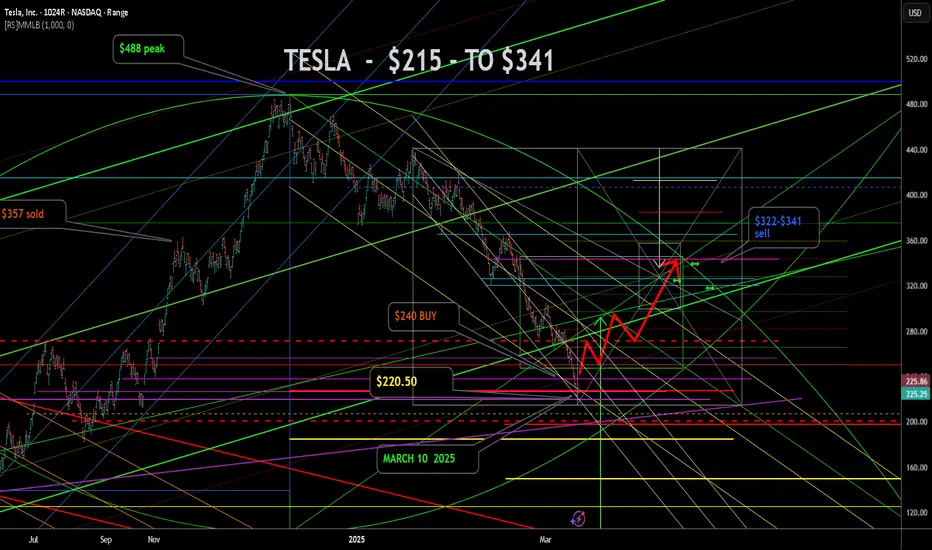
TESLA - THE CLIMB BACK TO $341 This is a pretty tough call to make right here. And I may get humbled. But the charts say to me - Kumar, there was a short term low today. And the next point of exhaustion is $341. Lets see what happens. This chart is likely a mess to most, but harmonious art work to me. Elliot, Murrey and Kumar being used for the analysis. Comments always welcome. Happy Trading.
TSLA - A false start? UPDATE : Tesla is unfortunately not starting on the right foot. The price action since the low is NOT impulsive to use an Elliot Wave term. So this is very unlikely to be the low. I will be selling my $265 calls near $255 price levels. And then patiently wait to see if we drift down for the true wave 5 down to $187. Additionally, the Murrey Frame 1/8ths line is also down there, as well a the Red dashed P line from the last break out. So..... if this take is wrong, and we manage to leave the channel gate move above $260 I will update. Until then its prayers to offload these longs profitably, and reset lower. Comments always welcome. And remember, trading is hard work, Sometimes we fish for a long time to catch the tastiest fish in the sea. Bona Fortuna!

UNH: Corrective wave coming to an endAfter the steep selloff for UNH, it has seen a significant bounce to the previous resistance level - this was aided by the fact that UNH because a popular tarriff counter trade, with money pouring in to what has been considered a safe haven in times of trade war turbulence. There space to run some more but its likely that UNH will run out of steam soon and retest support levels at ~480 and ~450.

Last attempt in seeking short!Still currenty seeking shorts on gbpusd as long as the market doesnt break above 1.34

#SUI/USDT#SUI
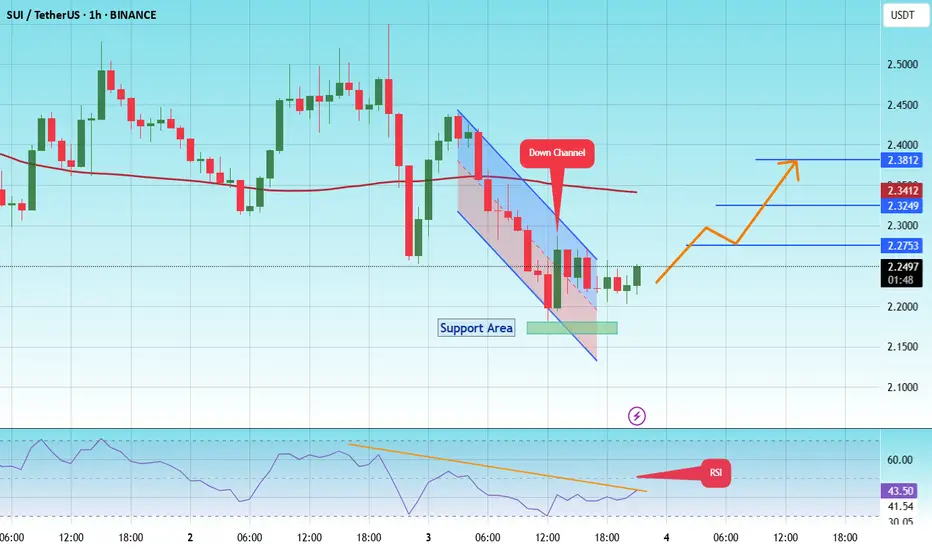
The price is moving in a descending channel on the 1-hour frame and is expected to continue upward.
We have a trend to stabilize above the 100 moving average once again.
We have a downtrend on the RSI indicator, supporting the upward move with a breakout.
We have a support area at the lower boundary of the channel at 2.17.
Entry price: 2.24
First target: 2.27
Second target: 2.32
Third target: 2.38
Apple Analysis(Target)I have analyzed Apple Inc using the Gann technique, trend analysis & waves. I have found that it is in immense down trend. And target is apple. Apple is more weak after the tariff announcement.

Agape ATP's $24 Billion Breakthrough! In a market landscape clouded by macroeconomic uncertainty and weakening sentiment, Agape ATP Corporation (NASDAQ: ATPC) has emerged as a countercyclical outlier with its recent announcement of two landmark Sales and Purchase Agreements (SPAs) worth approximately USD 24 billion. Signed with Swiss One Oil & Gas AG, these agreements mark a bold step forward for ATPC, setting the stage for an ambitious entry into the refined fuels distribution market on a global scale.
The SPAs follow a successful Initial Corporate Purchase Order (ICPO) completed in February 2025, which served as a proving ground for initial trial shipments. Under the terms of the agreements, ATPC will initially supply 200,000 metric tonnes of EN590 10PPM diesel and 2 million barrels of Jet Fuel A1 in March 2025. Following successful execution of this validation phase, the contracts are structured to scale rapidly to weekly deliveries of 500,000 metric tonnes of diesel and 2 million barrels of Jet Fuel A1 — an exponential increase that underscores the strategic ambition of both parties.
All deliveries will be conducted using Free on Board (FOB) procedures at major international ports, with product quality certified by SGS or equivalent agencies in accordance with ASTM/IP standards. This not only enhances transparency and credibility but also signals ATPC's commitment to international compliance and operational rigour.
What makes this deal truly transformative is the sheer scale of the undertaking. If executed to full potential, weekly deliveries of 2 million barrels of jet fuel would translate into an annual supply of roughly 104 million barrels — equivalent to around 2% of total annual U.S. jet fuel consumption. Such volume would position ATPC as a serious contender within the global energy trade ecosystem, shifting its profile from a relatively obscure player to a recognisable force in refined fuel logistics and supply.
The structural staging of the agreement — trial, validation, then full-scale execution — reveals a commercially astute strategy. It reduces upfront risk and capital exposure while providing room for operational ramp-up and systems optimisation. However, the magnitude of the weekly delivery requirements suggests that ATPC must urgently enhance its logistical capabilities, secure dependable supply sources, and establish robust quality assurance and compliance frameworks.
From a financial standpoint, the implications are staggering. The USD 24 billion value of the agreements stands in stark contrast to ATPC's current market capitalisation of just USD 5.17 million — a disconnect representing a multiple of over 4,600 times. While such disparity is not uncommon in early-stage high-growth stories, it highlights the importance of scrutinising the company’s readiness to scale operationally and financially.
Under FOB terms, ATPC will bear the cost of acquiring and transporting the fuel to the port of loading, thereby requiring significant working capital. Timely financing and cash flow management will be paramount, especially as delivery volume scales. Questions surrounding margin structure, procurement reliability, and commodity price hedging strategies will need to be addressed to fully appreciate the risk-return profile of this venture.
Yet, amid broader market softness and investor caution, ATPC’s bold strategic execution stands out. If the company successfully navigates the complex logistics, financial demands, and operational scale-up, this agreement has the potential to redefine its financial trajectory and long-term shareholder value.
In an era where execution is everything, Agape ATP’s audacious move could very well prove prescient. Investors will be watching closely — not just for signs of progress, but for proof of delivery.
Article inspired by Stock Titan.

EURGBP Market Structure Analysis on 4 Hour Timeframe4H swing is bullish => current is pullback
M15 swing is bearish.
Currently giving CHoCH reversal signal.
We can look for buying opportunities in this area.
More carefully, we wait for the price to break the top to confirm the 15-minute reversal frame.

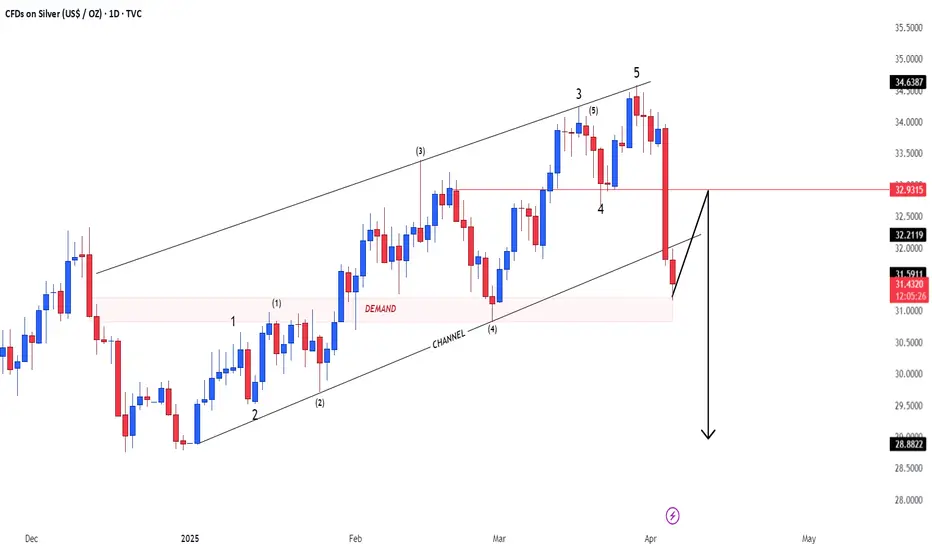
SilverXAGUSD
- Rising Wedge in Long Time Frame
- Break of Structure
- Demand Zone
- Completed " 12345 " Impulsive Waves
- Order Block
Lets place a trade together. Leap Competition, Lets GoIn this video we chat about an array of topics
If you would like to see how to open a trade for the Leap Competition, learn how I know where price is going to next and get some advice on Risk:Reward Ratios...this video blah blah blah ;)

SUIUSD I Weekly CLS, Key level - OB I Model 2, Multiple targetsHey Traders!!
Feel free to share your thoughts, charts, and questions in the comments below—I'm about fostering constructive, positive discussions!
🧩 What is CLS?
CLS represents the "smart money" across all markets. It brings together the capital from the largest investment and central banks, boasting a daily volume of over 6.5 trillion.
✅By understanding how CLS operates—its specific modes and timings—you gain a powerful edge with more precise entries and well-defined targets.
🛡️Follow me and take a closer look at Models 1 and 2.
These models are key to unlocking the market's potential and can guide you toward smarter trading decisions.
📍Remember, no strategy offers a 100%-win rate—trading is a journey of constant learning and improvement. While our approaches often yield strong profits, occasional setbacks are part of the process. Embrace every experience as an opportunity to refine your skills and grow.
Wishing you continued success on your trading journey. May this educational post inspire you to become an even better trader!
“Adapt what is useful, reject what is useless, and add what is specifically your own.”
David Perk ⚔


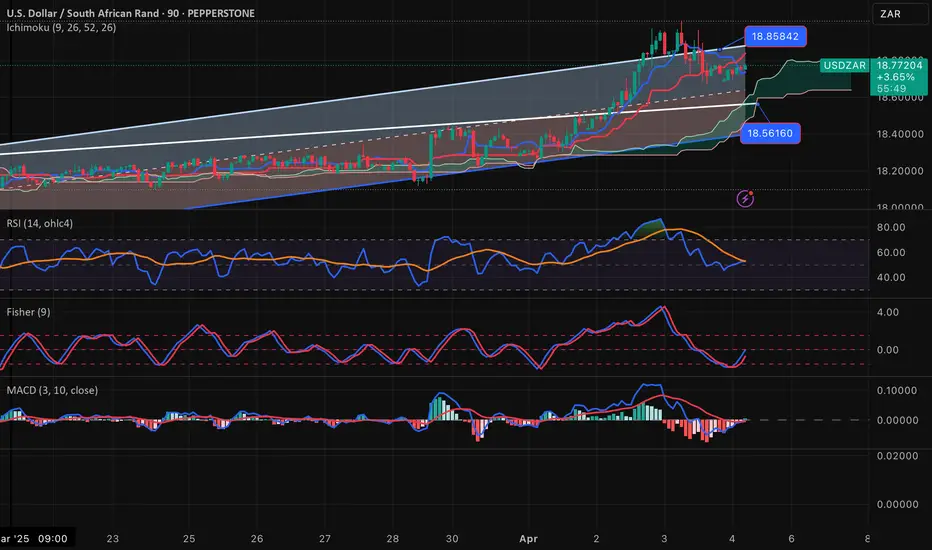
USDZAR-BUY strategy 90 Min chart Regression ChannelThe pair corrected from the lofty heights, and now we are settling around the 18.7250 -18.7500 area. I feel that we are positioning to re-test 19.00 area.
Strategy BUY @ 18.7250-18.7550 and take profit near 18.9950.
AUDUSD POTENTIAL LONG POSITION Q2 W14 Y25 FRIDAY 4TH APRIL 2025AUDUSD POTENTIAL LONG POSITION Q2 W14 Y25 FRIDAY 4TH APRIL 2025
Could well be the only position to provide fun coupons on a successful week of trading.
The concept is quite simple but does lack a few of our favourite confluences. If this was the beginning of the week, we would perhaps wait for a 15' break of structure but this takes away the Tokyo range fill confluences.
We require a tap into the 15' order block, followed by a bullish move from the point of interest. This in turn we wish to leave behind a void and order block creation. In the same breath, we require lower time frame breaks of structure since the break of 15' would not then give us enough time on an NFP Friday for price action to pull back to the low point of interest and a move long.
Lets see how it plays.
FRGNT x

Gold (XAU/USD) Technical Analysis – April 4, 2025Gold (XAU/USD) Technical Analysis – April 4, 2025 🏆
🔹 Current Price: 3,104.660
🔹 Timeframe: 15M
📌 Key Support Levels (Demand Zones):
🟢 3076 – 3079 – Minor Support
🟢 3062 – 3065 – Best Buying Area
🟢 3053 – 3055 – Strong Support Zone
📌 Key Resistance Levels (Supply Zones):
🔴 3144 – 3147 – Best Selling Area
📈 Bullish Scenario:
Gold is consolidating and could push higher if it breaks key resistance levels.
A breakout above 3,144 may signal a move towards higher price targets.
📉 Bearish Scenario:
If Gold fails to hold above 3,100, a pullback toward the 3062 – 3055 demand zone may present buying opportunities.
⚡ Trading Tip:
✅ Look for bullish confirmation near demand zones before entering long positions.
✅ Watch for price action and rejection near 3144 – 3147 for possible reversal trades.
✅ Apply proper risk management with stop losses.
#FXFOREVER #XAUUSD #Gold #TechnicalAnalysis #SmartMoney #PriceAction #Trading

USDJPY POTENTIAL LONG UPON Q2 W14 Y25 FRIDAY 4TH APRIL 2025USDJPY POTENTIAL LONG UPON Q2 W14 Y25
Weekly Orderblock long
Higher time frame Exponential moving averages pulling price action
We do however need to see clear breaks of structure on the 15' to really prove that price is ready to turn around this early into the weekly order block.
With larger higher time frame order blocks, there will always be the concern that so many voids within are below. why does my speculation favour a pull back deeper before then looking long.
For those reason, we await breaks of internal structure below looking to risk capital.
More to come on this.
FRGNT X
