Role of High-Frequency Trading in Exploiting Time Zone Gaps1. Introduction
High-Frequency Trading (HFT) is a sophisticated form of algorithmic trading that leverages ultra-fast execution speeds, advanced algorithms, and low-latency market data to capitalize on tiny price movements in financial markets. In today’s globally interconnected financial markets, time zone differences across major exchanges create temporary pricing inefficiencies. These gaps between the closing of one market and the opening of another—or the delayed reactions to economic news—present opportunities for HFT firms to exploit discrepancies for profit.
HFT is often viewed with a combination of awe and skepticism because it operates at speeds inaccessible to human traders and can influence market liquidity, volatility, and price discovery. Time zone arbitrage is a natural extension of HFT strategies, enabling firms to capitalize on price gaps that exist due to temporal dislocations between geographically separated markets.
This paper explores the mechanics, strategies, technological infrastructure, advantages, risks, and regulatory considerations associated with using HFT to exploit time zone gaps.
2. Understanding Time Zone Gaps in Global Markets
2.1 Definition of Time Zone Gaps
Time zone gaps arise when markets in different regions operate during non-overlapping hours. For instance:
The New York Stock Exchange (NYSE) closes at 4:00 PM EST.
The Tokyo Stock Exchange (TSE) opens at 9:00 AM JST, which is 8:00 PM EST.
During this gap, price movements in the U.S. may not yet be reflected in the Asian market, creating temporary mispricings. Similarly, European markets often open hours after the U.S. closes, leaving overnight news and macroeconomic developments unpriced until the next session.
2.2 Causes of Time Zone Gaps
Asynchronous Market Hours: Major financial centers—New York, London, Tokyo, Hong Kong, Sydney—operate in different time zones, leading to intervals when some markets are closed while others are active.
Delayed Reaction to News: Corporate earnings, geopolitical events, and macroeconomic announcements in one region may take hours to influence other markets.
Market Fragmentation: Different exchanges and liquidity pools may respond differently to the same event, creating temporary arbitrage opportunities.
2.3 Implications for Trading
Price gaps often emerge at the opening of a market relative to the previous session’s close in another region.
HFT firms aim to predict or quickly react to these gaps, capturing profits before the broader market adjusts.
These gaps can exist in equities, derivatives, ETFs, FX, and commodities.
3. High-Frequency Trading: An Overview
3.1 Definition and Key Characteristics
HFT is a type of algorithmic trading that uses powerful computers and complex algorithms to execute large numbers of trades at extremely high speeds. Key characteristics include:
Ultra-Low Latency: Milliseconds or microseconds matter; every fraction of a second can mean a competitive edge.
Algorithmic Decision-Making: Strategies are pre-programmed and self-executing.
High Trade Volume: Small profits per trade multiplied over thousands of trades can be highly lucrative.
Co-location: Servers are located physically close to exchange servers to minimize transmission delays.
3.2 Common HFT Strategies
Market Making: Posting buy and sell orders to capture bid-ask spreads.
Statistical Arbitrage: Exploiting statistical relationships between correlated assets.
Event-Driven Trading: Reacting instantly to news releases, earnings announcements, or economic data.
Latency Arbitrage: Exploiting time delays between the dissemination of market data across venues.
Time zone gaps are particularly suited for latency arbitrage and event-driven trading, where HFT firms act on information before the rest of the market fully absorbs it.
4. Exploiting Time Zone Gaps through HFT
4.1 Mechanics of Time Zone Arbitrage
Time zone arbitrage involves taking advantage of price differences that exist between markets due to temporal misalignment. HFT firms often employ:
Cross-Market Monitoring: Continuous tracking of markets in different time zones.
Predictive Modeling: Algorithms forecast opening prices based on prior session trends and news events.
Rapid Execution: Once a gap is identified, HFT algorithms execute trades in milliseconds to profit from temporary mispricings.
For example:
If the S&P 500 closes sharply higher, HFT systems may anticipate a correlated gap up in European indices before European markets open.
By placing orders just before the market opens, HFT firms can capture profits before human traders react.
4.2 Example Scenarios
Equities: U.S. market closes at 4 PM EST; Asian markets open with a lag. HFT algorithms analyze closing trends, overnight news, and macroeconomic releases to forecast opening moves in Asian indices.
FX Market: Currency markets operate 24/5 but exhibit varying liquidity across regions. HFT can exploit overnight USD/JPY gaps based on U.S. economic releases.
ETFs and ADRs: American Depository Receipts (ADRs) often trade at prices misaligned with their home market shares during time zone gaps. HFT can exploit these mismatches.
4.3 Technology Enablers
Low-Latency Networks: Microwave and fiber-optic links connect exchanges across continents for near-instantaneous data transfer.
High-Speed Data Analytics: Algorithms parse financial news, social media, and economic indicators in real-time.
Co-location Services: Hosting servers close to exchange servers reduces latency by milliseconds.
AI & Machine Learning: Models identify complex patterns and correlations that humans cannot discern.
5. Advantages of HFT in Time Zone Arbitrage
5.1 Speed and Precision
HFT executes trades faster than human traders, allowing firms to capture opportunities that exist for milliseconds to seconds.
5.2 Market Liquidity
HFT often adds liquidity, narrowing bid-ask spreads and improving market efficiency. By trading across multiple time zones, HFT can stabilize prices in otherwise thinly traded sessions.
5.3 Risk Management
Advanced algorithms allow for dynamic risk assessment and hedging in real-time, minimizing exposure in volatile periods.
5.4 Arbitrage Profits
Time zone gaps create predictable inefficiencies. HFT leverages these inefficiencies for consistent, albeit small, profits per trade that scale with volume.
6. Risks and Challenges
6.1 Market Volatility
Rapid HFT trading can amplify price swings during opening sessions, particularly when reacting to gaps or unexpected news.
6.2 Latency Competition
The race for the fastest execution is intense; even microsecond differences can determine profitability. Firms invest heavily in technology to maintain an edge.
6.3 Regulatory Scrutiny
HFT practices are closely monitored by regulators to prevent market manipulation or unfair advantages.
Practices like “spoofing” or excessive order cancellations in exploiting time gaps are illegal.
6.4 Systemic Risk
Heavy reliance on automated strategies across global markets introduces systemic risks; a failure in one algorithm could cascade through multiple time zones.
7. Regulatory and Ethical Considerations
7.1 Market Fairness
Regulators aim to ensure that HFT does not undermine market integrity or disadvantage retail investors. Time zone arbitrage must not cross into manipulative territory.
7.2 Reporting and Transparency
Exchanges often require HFT firms to report high volumes of activity and adhere to risk management standards.
Some jurisdictions impose minimum resting times for orders to reduce predatory trading in illiquid periods.
7.3 Cross-Border Implications
Time zone arbitrage often involves trading in multiple regulatory jurisdictions, creating legal complexities and compliance burdens.
8. Case Studies and Real-World Examples
U.S.–Europe Equity Arbitrage: HFT firms monitor closing prices in the S&P 500 and trade on correlated European indices at opening.
ADR Arbitrage: Discrepancies between ADRs and underlying foreign stocks allow HFT to capture instant profits.
Currency Arbitrage: Overnight U.S. economic announcements influence Asia-Pacific FX markets; HFT reacts faster than traditional market participants.
These cases illustrate how HFT transforms time zone gaps from dormant inefficiencies into profit-generating opportunities.
9. Future Trends
9.1 AI-Enhanced HFT
Artificial intelligence will increasingly enable predictive trading across time zones, anticipating market moves before they occur.
9.2 Global Market Synchronization
With increased connectivity, HFT may reduce the duration and magnitude of time zone gaps, forcing firms to innovate new strategies.
9.3 Regulatory Evolution
As HFT continues to exploit cross-border gaps, regulators are likely to implement stricter oversight, especially on latency arbitrage and cross-market manipulation.
9.4 Quantum Computing
Emerging technologies like quantum computing may redefine the speed and complexity of HFT, further reducing time lag inefficiencies globally.
10. Conclusion
High-Frequency Trading has fundamentally altered the landscape of global financial markets. Time zone gaps—once simply natural delays between regional market operations—are now actively exploited by HFT strategies to capture profits in milliseconds. By leveraging technology, algorithms, and advanced analytics, HFT firms capitalize on these inefficiencies, improving liquidity, accelerating price discovery, and enhancing market efficiency.
However, these advantages come with challenges: heightened competition, regulatory scrutiny, systemic risks, and ethical considerations. As markets continue to globalize and technology evolves, the interplay between HFT and time zone gaps will remain a critical area of study for traders, regulators, and policymakers alike.
Gann
Introduction to Broker & Platform Selection1. Understanding Brokers: Types and Roles
1.1 Definition of a Broker
A broker is a financial intermediary that facilitates transactions between investors and the financial markets. Brokers provide access to exchanges, execute buy and sell orders, and often provide additional services like research, advisory, risk management tools, and portfolio tracking.
1.2 Types of Brokers
Brokers are broadly classified into the following categories:
Full-Service Brokers
Full-service brokers offer a wide range of services, including market research, personalized advice, portfolio management, tax guidance, and wealth planning. Examples include Morgan Stanley, Merrill Lynch, and ICICI Securities.
Advantages:
Access to expert research and recommendations
Comprehensive account management
Suitable for long-term investors and high-net-worth individuals
Disadvantages:
Higher fees and commissions
Less control over trading decisions
Discount Brokers
Discount brokers primarily focus on order execution at lower costs, without providing extensive advisory services. Examples include Zerodha, Upstox, Robinhood, and Interactive Brokers.
Advantages:
Low commissions and trading costs
Suitable for active traders and self-directed investors
High-speed platforms for intraday and algorithmic trading
Disadvantages:
Minimal research support
Limited personal guidance
Online/Direct Market Access (DMA) Brokers
DMA brokers provide direct access to market liquidity, enabling faster execution and advanced trading tools. They are ideal for professional and high-frequency traders.
Advantages:
Real-time market access
Low latency execution for intraday trading
Advanced charting, API access, and automation
Disadvantages:
Steep learning curve
High platform cost or minimum capital requirements
Hybrid Brokers
Hybrid brokers combine features of full-service and discount brokers, offering optional advisory services while keeping trading costs low.
2. Understanding Trading Platforms
A trading platform is the software provided by a broker that allows investors and traders to place orders, analyze markets, monitor positions, and manage risk. The platform serves as the gateway between the trader and the exchange.
2.1 Types of Trading Platforms
Web-Based Platforms
Accessible via browsers, these platforms require no installation and are suitable for casual traders. Examples include Zerodha Kite Web, Upstox Web.
Desktop Platforms
Installed on PCs, these platforms offer faster execution, advanced charting tools, and customizability. Examples: MetaTrader 4/5, NinjaTrader.
Mobile Platforms
Apps for smartphones and tablets allow trading on-the-go. Key features include alerts, order execution, and portfolio monitoring. Examples: Robinhood App, Zerodha Kite App.
Algorithmic and API-Based Platforms
Designed for professional traders and HFT (High-Frequency Trading), these platforms support automated trading, direct market access, and integration with custom trading algorithms.
3. Key Factors in Broker Selection
Choosing the right broker is a multi-dimensional decision. Investors and traders should evaluate brokers across several critical parameters:
3.1 Regulatory Compliance and Safety
Brokers must be regulated by reputable authorities (e.g., SEBI in India, SEC and FINRA in the U.S., FCA in the U.K.).
Check for investor protection schemes, segregation of client funds, and history of regulatory actions.
Security of funds and data protection is paramount, especially for online and mobile platforms.
3.2 Cost Structure and Fees
Commissions: Flat per trade vs. percentage of trade value.
Spreads: Difference between buy and sell prices, important for forex and derivatives trading.
Hidden Charges: Account maintenance fees, withdrawal fees, inactivity fees.
Comparison of costs is essential for long-term profitability, particularly for high-frequency traders.
3.3 Range of Tradable Assets
Ensure the broker provides access to the markets you intend to trade: equities, options, futures, commodities, ETFs, forex, or cryptocurrencies.
Diversification requires multiple asset classes, while specialized traders may focus on a single segment.
3.4 Trading Platform Features
Order Types: Market, limit, stop-loss, bracket orders, etc.
Execution Speed: Critical for intraday and scalping strategies.
Analytical Tools: Technical indicators, charting, market scanners, backtesting capabilities.
Customization: Ability to set alerts, custom layouts, and automated strategies.
3.5 Research and Educational Support
Full-service brokers typically offer in-depth market research, sector analysis, and trading recommendations.
Discount brokers may provide basic news feeds, charting, and webinars.
Educational resources are crucial for beginners and intermediate traders to make informed decisions.
3.6 Customer Support and Service
Efficient and responsive support is essential for resolving technical issues, withdrawal requests, and trade disputes.
Channels: Live chat, phone, email, and in-person support.
Reviews and testimonials can indicate real-world service quality.
3.7 Reputation and Track Record
Longevity in the market and user reviews are good indicators of reliability.
Look for brokers with minimal complaints, transparent business practices, and robust technology infrastructure.
4. Platform Selection Considerations
While brokers facilitate trading, the platform itself determines execution efficiency, usability, and trading success.
4.1 Usability and User Experience
A clean, intuitive interface reduces errors during fast-paced trading.
Personalizable dashboards for watchlists, portfolio summaries, and order books improve efficiency.
4.2 Speed and Reliability
Execution speed is critical, especially for day traders and scalpers.
Platforms must handle high traffic without crashes, particularly during volatile market sessions.
4.3 Technical Tools and Indicators
Advanced charting, trend analysis, risk management tools, and backtesting functionalities enhance decision-making.
Access to Level II market depth, heat maps, and order flow analysis can give an edge to professional traders.
4.4 Automation and Algorithmic Trading
Support for trading bots, scripts, and APIs can help automate strategies and improve efficiency.
Integration with third-party software, like TradingView or Python-based strategies, provides flexibility.
4.5 Mobile Access and Alerts
Alerts for price movements, news, and portfolio changes enable proactive decision-making.
Mobile trading apps should mirror desktop functionality without compromising speed or reliability.
5. Matching Broker and Platform to Trading Style
Different trading styles have different requirements:
Long-Term Investors
Focus on reliability, low fees for holding positions, research support, and wealth management.
Full-service brokers may be ideal.
Swing Traders
Require moderately advanced charting, news access, and efficient order execution.
Discount brokers with robust platforms are sufficient.
Intraday and Scalpers
Need lightning-fast execution, multiple order types, direct market access, and advanced analytics.
Specialized trading platforms with low latency are preferred.
Algorithmic and HFT Traders
Prioritize API access, execution speed, and data feed quality.
DMA or institutional-grade platforms are essential.
6. Practical Steps for Selecting a Broker and Platform
6.1 Identify Your Goals
Define investment objectives: long-term growth, short-term trading, income generation, or speculative trading.
6.2 Shortlist Brokers
Based on regulatory compliance, asset availability, fees, and platform quality.
Use online reviews, broker comparison tools, and professional recommendations.
6.3 Demo and Trial Accounts
Most brokers offer simulated accounts to test platforms without risking capital.
Evaluate usability, speed, order types, and support during trials.
6.4 Evaluate Costs vs. Benefits
Weigh commission savings against features, research support, and execution reliability.
Sometimes paying slightly higher fees for superior service and tools is more profitable.
6.5 Check Customer Support and Reliability
Engage with support before opening an account to gauge responsiveness.
Verify uptime guarantees, server reliability, and contingency measures for technical failures.
6.6 Make a Gradual Transition
Start with small capital to assess real-world performance.
Monitor execution speed, platform stability, and ease of fund withdrawal.
7. Red Flags to Avoid
Unregulated Brokers: Risk of fraud, mismanagement, or sudden closure.
Hidden Fees: Ensure transparency in all charges and account maintenance costs.
Poor Technology: Frequent platform crashes or delayed execution.
Limited Asset Access: Brokers offering fewer instruments may restrict diversification.
Weak Customer Support: Critical during emergencies like system outages or market volatility.
8. Future Trends in Broker and Platform Selection
Integration with AI and Analytics
AI-driven trade recommendations, predictive analytics, and market sentiment analysis.
Social and Copy Trading
Platforms enabling traders to mirror strategies of experienced investors.
Blockchain and Tokenized Assets
Brokers offering access to digital assets and tokenized securities.
Mobile-First Platforms
Enhanced mobile trading experiences with full desktop functionality.
Regulatory Evolution
Increasing investor protection and compliance requirements globally.
Conclusion
Selecting the right broker and trading platform is a foundational decision that influences every aspect of trading and investing. While low costs and flashy features are attractive, the ultimate choice should align with individual trading style, objectives, and risk tolerance. By carefully evaluating regulatory compliance, execution quality, platform capabilities, research support, and cost structures, traders and investors can create a robust foundation for sustainable profitability. A well-chosen broker-platform combination not only facilitates seamless access to markets but also enhances efficiency, decision-making, and long-term success.
Nifty Ocktober TDX Levels -Nifty commenced October with a bullish Marubozu candlestick.
Similarly, September also opened with a bullish Marubozu, which was followed by a fourteen-day rally of 1,000 points. We will observe whether a similar trend persists this October.
The market demonstrated strong resilience in September, remaining above the bullish zone despite significant geopolitical challenges. India’s current economic data continues to provide solid fundamental support.
If this higher low formation is maintained, it could pave the way for a higher high target. Market participants should consider positioning accordingly, as clarity is expected by next Monday.
Please monitor these key levels to remain aligned with market movements, especially in such volatile conditions where analysis and forecasts can change rapidly.

GBPUSD Daily Forecast -Q4 | W40 | D2 | Y25|📅 Q4 | W40 | D2 | Y25|
📊 GBPUSD Daily Forecast
🔍 Analysis Approach:
I’m applying Smart Money Concepts, focusing on:
Identifying Points of Interest on the Higher Time Frames (HTFs) 🕰️
Using those POIs to define a clear trading range 📐
Refining those zones on Lower Time Frames (LTFs) 🔎
Waiting for a Break of Structure (BoS) for confirmation ✅
This method allows me to stay precise, disciplined, and aligned with the market narrative, rather than chasing price.
💡 My Motto:
"Capital management, discipline, and consistency in your trading edge."
A positive risk-to-reward ratio, paired with a high win rate, is the backbone of any solid trading plan 📈🔐
⚠️ Losses?
They’re part of the mathematical game of trading 🎲
They don’t define you — they’re necessary, they happen, and we move forward 📊➡️
🙏 I appreciate you taking the time to review my Daily Forecast.
Stay sharp, stay consistent, and protect your capital
— FRNGT 🚀
FX:GBPUSD

EURGBP Daily Forecast -Q4 | W40 | D2 | Y25| SET UP OF THE DAY📅 Q4 | W40 | D2 | Y25|
📊 EURGBP Daily Forecast
🔍 Analysis Approach:
I’m applying Smart Money Concepts, focusing on:
Identifying Points of Interest on the Higher Time Frames (HTFs) 🕰️
Using those POIs to define a clear trading range 📐
Refining those zones on Lower Time Frames (LTFs) 🔎
Waiting for a Break of Structure (BoS) for confirmation ✅
This method allows me to stay precise, disciplined, and aligned with the market narrative, rather than chasing price.
💡 My Motto:
"Capital management, discipline, and consistency in your trading edge."
A positive risk-to-reward ratio, paired with a high win rate, is the backbone of any solid trading plan 📈🔐
⚠️ Losses?
They’re part of the mathematical game of trading 🎲
They don’t define you — they’re necessary, they happen, and we move forward 📊➡️
🙏 I appreciate you taking the time to review my Daily Forecast.
Stay sharp, stay consistent, and protect your capital
— FRNGT 🚀
FX:EURGBP

The science of hindsight I didn't sleep easy last night at the AI back-up model getting the forecast wrong (the dip bit)
So after a 'ah-ha', I rushed over to the trade computer and saw that the primary AI model actually DID GET IT RIGHT, it was human error that missed it.
My confidence is restored, the King of the AI models defends it's thrown

The secret to winning in gold trading! About your mindset!This article does not cover strategies. For trading, please refer to the previous article.
Gold Trading Mindset: Gold trading mindset is a key factor in determining trading success or failure. Here are some key points and tips about gold trading mindset to help you better navigate market fluctuations:
Overcoming Greed and Fear
Greed: Avoid chasing rising prices and selling falling. Don't blindly increase your position or delay taking profits due to short-term gold price increases. Set reasonable take-profit targets and lock in profits promptly.
Fear: Avoid panic selling during market declines. If a trade fits your strategy, calmly assess the risks to avoid missing out on rebound opportunities due to short-term fluctuations.
Accepting losses is normal. The gold market is highly volatile and losses are part of the cost of trading. Don't let a single loss get you emotionally upset. Instead, focus on the long-term effectiveness of your overall trading strategy. Strictly implement stop-loss rules and control the scope of losses.
Maintain patience and discipline. The gold market is often in a volatile or trendless state, so you need to wait patiently for clear trading signals. Avoid frequent trading to minimize emotional interference. Develop and strictly adhere to a trading plan, and don't change it arbitrarily due to short-term market fluctuations.
Avoid blindly following the crowd. Don't trade impulsively based on the actions of others or market sentiment. Gold prices are influenced by multiple factors, requiring independent analysis of fundamentals and technicals to form your own judgment.
View market fluctuations rationally. Short-term fluctuations in gold prices may be influenced by geopolitical factors, economic data, and other factors, but long-term trends are determined by supply and demand and macroeconomic trends. Don't be misled by short-term fluctuations and maintain a long-term investment perspective.
Manage your funds effectively to control the risk of individual trades. It is recommended that losses on individual trades should not exceed 1%-2% of your total capital. Operating with a small position can reduce psychological stress and promote a more stable mindset.
Continuously study and review your trading experiences regularly, analyzing the reasons for success and failure. Improve your understanding of the market by studying macroeconomics and technical analysis methods.
Gold trading is not just a battle with the market; it's also a battle with your own emotions. Maintaining a calm and rational mindset, and combining trading strategies with mindset management, is the key to achieving stable profits in long-term trading.
If you find it helpful after reading this article, please like and support it, or share it with other friends. We will update trading strategies and trading skills every day!

ETHUSD NEW OUTLOOK According to H1 analysis ETHUSD market is almost at SUPPORT LEVEL so it is the best opportunity to go long from support level market will be fly from here dont bee greedy use money management
TRADE AT YOUR OWN RISK
REGARD ALBERT

Gold short position wins big, have you followed it?When I issued the signal to short gold, many brothers were skeptical and hesitated to place orders, and some even missed this short order feast. Some friends also left messages saying that I was trading against the trend. I am no longer surprised by these moves, because I have a very clear trading plan, which is also the confidence cultivated from years of trading.
Many brothers don’t understand why I shorted gold. In fact, in the previous point, I have already clearly analyzed the motivation for shorting gold. I will not easily send out a trading signal without absolute certainty. I am not only responsible for my own real money, but also cannot let down those brothers who support me. I am fully prepared before sending out the signal. Brothers who support me, please feel free to follow my steps boldly. I am waiting for you in the channel.
Back to the point. At present, gold short positions are still in a significantly profitable state. Judging from the technical trend, the price of gold has entered a consolidation phase, with the range of fluctuations narrowing significantly and continuing to fluctuate around 3870, indicating that this price range has a strong supporting effect on the gold price. It is recommended to focus on the subsequent movements of this key support level. The trading strategy maintains the previous views and is expected to have room for downward movement in the future. At this stage, we need to remain patient and wait for clear signals.
The following are my personal opinions. If you agree, please like and follow me! If you have better trading ideas, you can also leave a message in the comment section to share them!

AI was right, but didn't expect to be THIS right With each timeframe there are obligations. So if the 1D chart needs to travel along a support line, then that will ripple down to the lower timeframes...which makes it tough for the AI to anticipate, as it is blind to what is happening on the other charts.
Thankfully today I have embedded 4 market structure models which will automatically set up each timeframe (when I get to building the multiple timeframes).
This is siginificant as all the charts need to sync up, and there cant be sloppy information
BS in = BS out, therefore it needs to be built robustly for the AI to have an all seeing effect


My GBP/JPY Trade Plan🧠 Bias: Long (Buy)
I'm watching GBP/JPY as price approaches my POI (196.80 – 197.50), which lines up with key Fibonacci retracement levels (61.8%–75%).
⚙️ Setup Criteria
No entry yet — I need to see a 4H Fair Value Gap (FVG) form within the POI.
Once that FVG forms, I’ll look to enter based on it.
Stop Loss will go below the first candle that creates the FVG, or below the POI — whichever is lower.
Target is the -25% Fib extension at 202.800.
🔍 Key Levels
POI: 196.80 – 197.50
Current Price: 198.27
Target (TP): 202.800
Stop Loss (SL): Below 4H FVG candle or POI (whichever is lower)
✅ Next Steps
Wait for price to enter the POI
Look for a clean 4H FVG formation
Only enter if FVG confirms the setup

EURJPY TRADE IDEA📍 Trade Idea
After the sharp correction from 175.00, I noticed price approaching a key demand zone. The 61.8% Fibonacci retracement (≈171.75) lines up with previous structure support and my marked POI.
I believe this pullback is a retracement within a larger bullish trend, and I’m looking for buyers to step in around the 61.8% Fib to resume the move higher.
🔑 Entry Plan
Entry: 171.75 (61.8% Fib retracement)
Stop Loss: 169.65 (below weekly demand and full retracement)
🎯 Targets
TP1: 174.90 (major supply zone)
TP3: 177.00 (extension target)
📊 Trade Management
Once price hits TP1 (174.90), I will move SL to breakeven.
I will leave the full position running to TP2 unless price action shows strong reversal signals.
✅ Trade Rationale
1.61.8% retracement is a high-probability reversal zone.
2.Confluence with prior demand zone / POI.
3.Clear invalidation below 170.00, making risk defined and clean.
Excellent reward potential toward 177.00

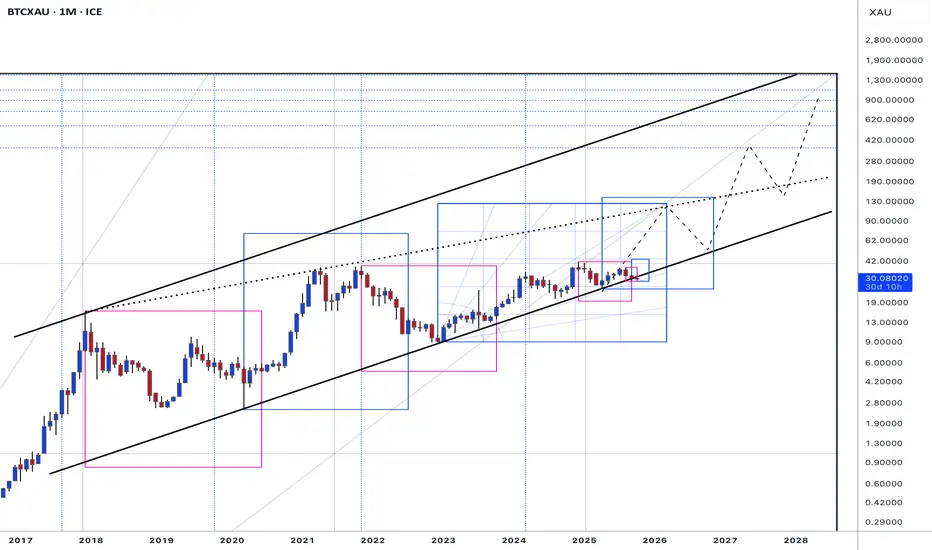
BTCXAU # 001 ( Noting else , Every thing is Clear ! ) Hello dear traders.
First of all thanks for your support and comments.
—————————————————————————-
Still channel is valid and can Finnish monthly Gann Square up to 2028 which is mach with BTCUSDT at 2028 .
In other way Gold is reach to the Weekly Gann Square highest level and need at least 2-3 years correction for Next bull run .
Good luck and safe trades.
PUMP | Technical & Fundamental InsightsDescription:
PUMP has recently shown increased market attention, reflecting growing community interest and speculative momentum. From a fundamental perspective, this asset is highly driven by sentiment, liquidity inflows, and overall market conditions rather than traditional intrinsic value. Monitoring volume spikes and key support/resistance zones is essential for short-term traders.
This analysis highlights both technical structures and underlying catalysts that could influence upcoming price action. Remember that PUMP remains a high-risk asset with strong volatility potential.
⚠️ Disclaimer:
This content is for educational purposes only and does not represent financial advice. Always conduct your own research before making investment decisions.
#PUMP #Crypto #TechnicalAnalysis #Trading #PriceAction #Fundamentals #Altcoins #MarketInsights #RiskManagement

Gold top ?Wanted to look into XAUUSD to see if/when I could short. Cup and handle target is blown cuz that would've been @ 3100. Now looking at $4000 cuz, come on, who isn't, it's gotta be a psychological target/resistance. So I threw a fibonacci ahead of the price from the breakout and retest low, @ 2000, and targeted 4000. Everything lined up pretty well! Got to looking at it and playing with it, and lined up all the key levels in the fib to the chart where we actually got good signs of resistance (on the weekly). Every level is respected with the target set just above current price @ about 3913! Just the 50% is rejected and supported very quickly and almost precisely at $2955 which makes sense leaving a lot of liquidity through the 0.5-0.618 area for a retrace and bounce! Will be looking for some confirmations and still looking to see if we wick to 3950/4000! (I feel like I've noticed gold likes to do the $50's for some reason) Check it out! I do expect some serious volatility once we do reach the top which is why I'm interested in a short and a quick payday! Lol! But the fib does line up, just not quite as perfect, with a start at $1820 and a target of 4500 as well so we'll see !

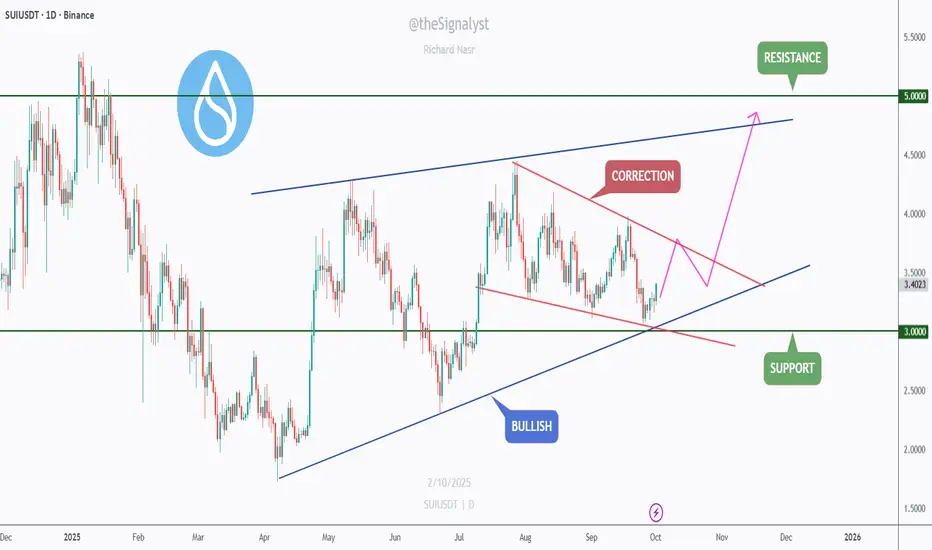
$SUI - Correction within an Uptrend: Eyes on $3.0 → $5.0SUI is respecting a broader rising structure while carving a descending correction (red channel/wedge) on the daily.
Price just bounced from the trendline + $3.00 support, a clean confluence area where bulls typically reload.
Trend context: Macro higher-lows intact (bullish). Micro still corrective until the wedge breaks.
Key levels
Support: $3.00 (structure + rising trendline)
Resistance: $3.55–$3.60 (wedge cap / first hurdle), then $5.00 (major ceiling)
Confluence 🔑
Rising blue trendline + horizontal $3.00 + corrective wedge = high-interest decision zone.
Scenarios
Bullish 📈Hold $3.00 and break above $3.55–$3.60 → momentum extension toward $4.20–$4.50, then the $5.00 range high.
Bearish 📉Daily close below $3.00 → risk of a deeper pullback before the uptrend resumes.
Do you think SUI clears the wedge on this attempt, or does it need one more higher-low above $3 first? 🤔
⚠️ Disclaimer: This is not financial advice. Always do your own research and manage risk properly.
📚 Stick to your trading plan regarding entries, risk, and management.
Good luck! 🍀
All Strategies Are Good; If Managed Properly!
~Richard Nasr
Drop Expectation for EURAUDExpectation drop for EURAUD. Already drop 1st attempt which mean clearing a buy order, and now price approach to drop for 2nd attempt. because at 1st attempt the drop less 'energy', so on the 2nd attempt will take a few time to reaching the target. sorry for bad english.

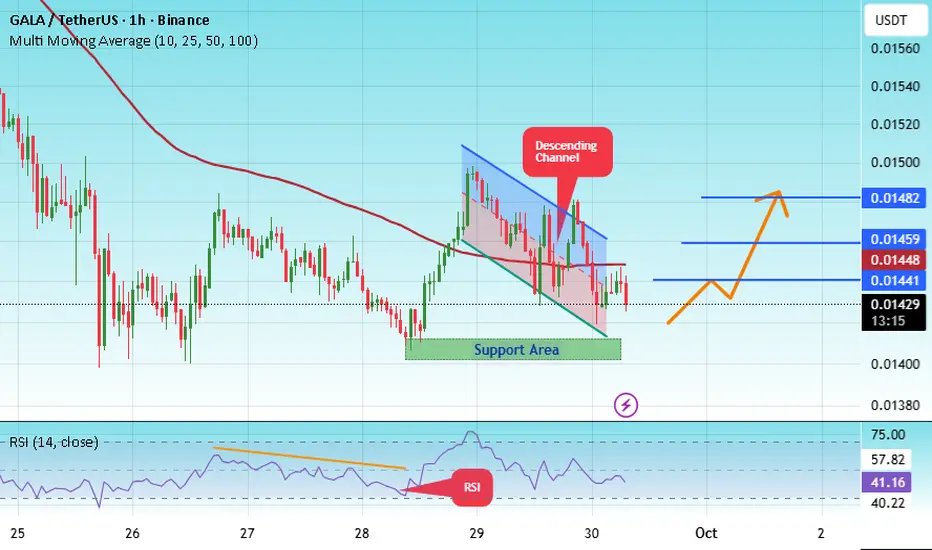
#GALA/USDT — Holding the Last Fortres, Recovery or Final Break
#GALA
The price is moving within a descending channel on the 1-hour frame, adhering well to it, and is heading for a strong breakout and retest.
We have a bearish trend on the RSI indicator that is about to be broken and retested, which supports the upward breakout.
There is a major support area in green at 0.01408, which represents a strong support point.
We are heading for consolidation above the 100 moving average.
Entry price: 0.01426
First target: 0.01440
Second target: 0.01458
Third target: 0.01481
Don't forget a simple matter: capital management.
Wow, looks like our new AI Support model really showed UPThe way it caught the initial little downward swoop caught my attention...
However it showing the place in where it was going to breakout from, man!! Just AWESOME

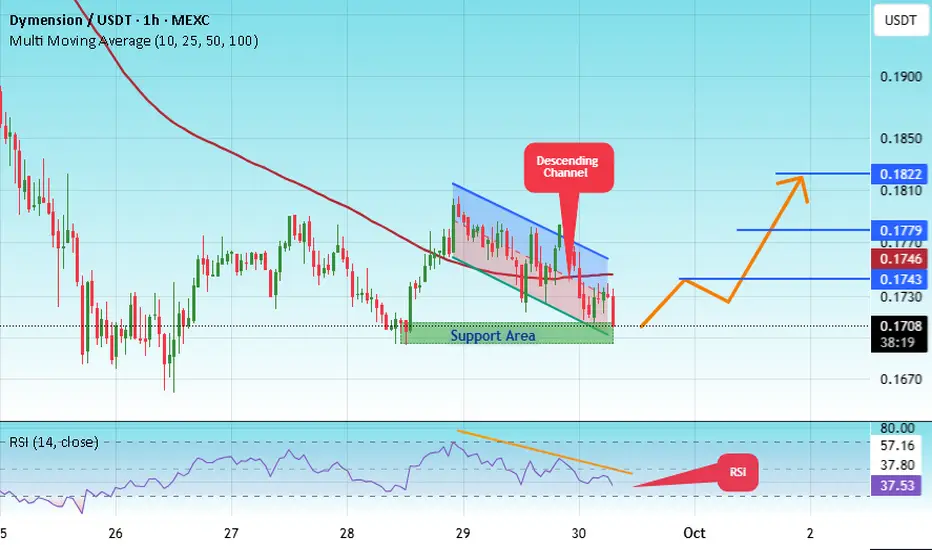
#DYM/USDT — Falling Wedge Formation, Breakout or Breakdown?#DYM
The price is moving within a descending channel on the 1-hour frame, adhering well to it, and is heading for a strong breakout and retest.
We have a bearish trend on the RSI indicator that is about to be broken and retested, which supports the upward breakout.
There is a major support area in green at 0.1700, which represents a strong support point.
We are heading for consolidation above the 100 moving average.
Entry price: 0.1713
First target: 0.1743
Second target: 0.1779
Third target: 0.1822
Don't forget a simple matter: capital management.
When you reach the first target, save some money and then change your stop-loss order to an entry order.
For inquiries, please leave a comment.
Thank you.
Buy Plan – Abdullah Al Othaim Markets Co.📈 Buy Plan – Abdullah Al Othaim Markets Co.
Entry:
Buy on continuation above the breakout zone (blue line).
Stop Loss (SL):
Place SL below the recent support area / consolidation base.
Targets:
First Target → Nearest resistance level
Second Target → Major resistance above
Final Target → Liquidity zone (red dotted line)
Plan Notes:
This is a breakout continuation setup.
Once the first target is reached, move SL to breakeven.
Take partial profits step by step and let remaining position run towards final liquidity zone.
Patience is required as this is a swing setup aiming for higher levels.

Market idea based on the Harmonious Energy Flow (HEF) conceptAt the current stage, we can observe a clear manifestation of buyers’ strength, even though the market conditions are shifting rapidly without any significant price expansion. This creates a state of consolidation, where energy is being accumulated for the next move.
According to the HEF concept, consolidation represents a transitional phase — the market is searching for balance before moving into a new wave of directional flow. My current expectation is the transition towards the breakout moment, when price finally exits this consolidation zone and reveals the true side of strength.
📌 Key focus: monitoring how buyers sustain their advantage within this tight structure, and waiting for the signal of release from balance.
If you find my charting approach interesting, you are very welcome to connect for further discussion. I am open to dialogue and exchange of views.
