#ZEC/USDT Breakout Confirmed - Bullish Rally Loading!#ZEC
The price is moving within a descending channel on the 1-hour frame, adhering well to it, and is heading for a strong breakout and retest.
We have a bearish trend on the RSI indicator that is about to be broken and retested, which supports the upward breakout.
There is a major support area in green at 48.26, representing a strong support point.
For inquiries, please leave a comment.
We are in a consolidation trend above the 100 Moving Average.
Entry price: 52.70
First target: 53.70
Second target: 54.90
Third target: 56.85
Don't forget a simple matter: capital management.
When you reach the first target, save some money and then change your stop-loss order to an entry order.
For inquiries, please leave a comment.
Thank you.
Gann

Sell Opportunity in USDCHF Looking for Sell in Premium Zone with Proper Risk management. This is a Continuation Setup as per Market Structure.

EURUSD BullishGoing for Long Trade with Limit Order in Discount Zone with Proper Risk Management, let's see what Price do next.

EURUSD Daily Forecast -Q4 | W40 | D1 | Y25|📅 Q4 | W40 | D1 | Y25|
📊 EURUSD Daily Forecast
🔍 Analysis Approach:
I’m applying Smart Money Concepts, focusing on:
Identifying Points of Interest on the Higher Time Frames (HTFs) 🕰️
Using those POIs to define a clear trading range 📐
Refining those zones on Lower Time Frames (LTFs) 🔎
Waiting for a Break of Structure (BoS) for confirmation ✅
This method allows me to stay precise, disciplined, and aligned with the market narrative, rather than chasing price.
💡 My Motto:
"Capital management, discipline, and consistency in your trading edge."
A positive risk-to-reward ratio, paired with a high win rate, is the backbone of any solid trading plan 📈🔐
⚠️ Losses?
They’re part of the mathematical game of trading 🎲
They don’t define you — they’re necessary, they happen, and we move forward 📊➡️
🙏 I appreciate you taking the time to review my Daily Forecast.
Stay sharp, stay consistent, and protect your capital
— FRNGT 🚀
FX:EURUSD

Stress testing the latest in Trading-TechIt's taken man 100 years on the financial markets to be able to forecast on this level.
Now that I have the thinking structure of the latest AI models trained, I get to beta test them on live markets.
In this video I explain what it is I am testing and how I apply the predictions
The 30min chart is fast moving in comparison to the higher timeframes, so the structure of the price candles are messier. With that in mind, the AI models are holding strong... lets see if they can keep this up

GBPUSD Daily Forecast -Q4 | W40 | D1 | Y25|📅 Q4 | W40 | D1 | Y25|
📊 GBPUSD Daily Forecast
🔍 Analysis Approach:
I’m applying Smart Money Concepts, focusing on:
Identifying Points of Interest on the Higher Time Frames (HTFs) 🕰️
Using those POIs to define a clear trading range 📐
Refining those zones on Lower Time Frames (LTFs) 🔎
Waiting for a Break of Structure (BoS) for confirmation ✅
This method allows me to stay precise, disciplined, and aligned with the market narrative, rather than chasing price.
💡 My Motto:
"Capital management, discipline, and consistency in your trading edge."
A positive risk-to-reward ratio, paired with a high win rate, is the backbone of any solid trading plan 📈🔐
⚠️ Losses?
They’re part of the mathematical game of trading 🎲
They don’t define you — they’re necessary, they happen, and we move forward 📊➡️
🙏 I appreciate you taking the time to review my Daily Forecast.
Stay sharp, stay consistent, and protect your capital
— FRNGT 🚀
FX:GBPUSD

EDEN better than ONDOCBOE:EDEN Better than LSE:ONDO
🔹 1. Price & Movement
ONDO: $0.8814 (down -0.09%)
EDEN: $0.4177 (up +2.63%)
➡️ EDEN currently looks more bullish in the short term as it is rising, while ONDO is stagnant/slightly down.
🔹 2. Market Cap
ONDO: $2.78 billion
EDEN: $76.80 million
➡️ ONDO is much larger and more established. EDEN is still smaller, making it riskier but also has the potential to provide large returns if it grows successfully.
🔹 3. 24-Hour Volume
ONDO: $173.90 million
EDEN: $652.47 million
➡️ Interestingly, despite EDEN's smaller market cap, its trading volume is higher than ONDO's. This indicates that market sentiment for EDEN is hot and heavily traded.
🔹 4. Supply
ONDO: 3.15B circulating (maximum supply unclear)
EDEN: 183.87M circulating (maximum supply 1B)
➡️ EDEN still has a large supply gap going forward, which could impact token inflation.
➡️ ONDO's maximum supply is unclear, meaning there could be a risk of additional issuance.
🔹 5. Age & Track Record
ONDO: Since January 18, 2024 → almost a year old, proven to be resilient.
EDEN: Just launched September 28, 2025 → still very new, high risk.
🔹 6. CMC Ranking
ONDO: #39 (top tier, relatively safe & stable).
EDEN: #426 (still small, high risk-high reward).
📊 Conclusion
ONDO → Safer, large capitalization, well-established, suitable for investors seeking stability and lower risk.
EDEN → New, small capitalization but high volume, bullish sentiment, suitable for investors willing to take high risks for the potential of large profits.
👉 Strategy:
If you're looking for long-term security, ONDO is better.
If you're speculative and want quick profits, EDEN is more promising, but the risk is high.
#ONDO #EDEN

EDEN Better than ONDOCBOE:EDEN Better than LSE:ONDO
🔹 1. Price & Movement
ONDO: $0.8814 (down -0.09%)
EDEN: $0.4177 (up +2.63%)
➡️ EDEN currently looks more bullish in the short term as it is rising, while ONDO is stagnant/slightly down.
🔹 2. Market Cap
ONDO: $2.78 billion
EDEN: $76.80 million
➡️ ONDO is much larger and more established. EDEN is still smaller, making it riskier but also has the potential to provide large returns if it grows successfully.
🔹 3. 24-Hour Volume
ONDO: $173.90 million
EDEN: $652.47 million
➡️ Interestingly, despite EDEN's smaller market cap, its trading volume is higher than ONDO's. This indicates that market sentiment for EDEN is hot and heavily traded.
🔹 4. Supply
ONDO: 3.15B circulating (maximum supply unclear)
EDEN: 183.87M circulating (maximum supply 1B)
➡️ EDEN still has a large supply gap going forward, which could impact token inflation.
➡️ ONDO's maximum supply is unclear, meaning there could be a risk of additional issuance.
🔹 5. Age & Track Record
ONDO: Since January 18, 2024 → almost a year old, proven to be resilient.
EDEN: Just launched September 28, 2025 → still very new, high risk.
🔹 6. CMC Ranking
ONDO: #39 (top tier, relatively safe & stable).
EDEN: #426 (still small, high risk-high reward).
📊 Conclusion
ONDO → Safer, large capitalization, well-established, suitable for investors seeking stability and lower risk.
EDEN → New, small capitalization but high volume, bullish sentiment, suitable for investors willing to take high risks for the potential of large profits.
👉 Strategy:
If you're looking for long-term security, ONDO is better.
If you're speculative and want quick profits, EDEN is more promising, but the risk is high.
#ONDO #EDEN

$PUMP 50% Gann Retrace - Primed for Next Leg UpBack in on the NYSE:PUMP trade 🚀
Had a full 50% retrace on its CRYPTOCAP:SOL pair which should be enough ammo for the next leg higher.
Need to have several daily closes above the 20MA for confirmation.
*NOTE* I'm only trading SPL pairs rn. This way I can maintain constant exposure to SOL even if my bids do not hit and minimize the downside.

I'm shocked at how good my AI forecasts are. I can't promise they'll always be like this, but as I feel the fails I too want to celebrate the WINS
This is the accuracy serious traders want to make money
(are you impressed yet?)


OPEN EDEN Bullish catalyst
1/ 🚀 Introducing EURONEXT:EDEN — the native token of OpenEden, a platform bringing real-world assets (RWA) like bonds & financial products on-chain.
2/ Why is EURONEXT:EDEN getting bullish attention? Let’s break it down 👇
3/ Utility:
Staking
Governance
Fee discounts
Ecosystem incentives
Potential buyback/burn
4/ Holder Incentives:
The HODLers Bonus (EHBM) redistributes penalties from early claimers → rewards patient holders 💎🙌
5/ Launch Dynamics:
Only ~18% of supply circulating at TGE
Team & investor tokens vested → reduces dumping risk
6/ Community Push:
20M EURONEXT:EDEN airdropped via Binance Wallet 🔥
Bills Points & OpenSeason vault campaigns = strong engagement
7/ Bullish Catalysts:
Scarcity at launch
DeFi integrations (Curve, Pendle)
RWA narrative gaining momentum
8/ Risks:
Future unlocks → supply pressure
RWA regulation hurdles
Execution risk (buybacks, product delivery)
9/ Bottom line:
EURONEXT:EDEN enters the market with strong fundamentals, scarcity, and a bullish narrative. Definitely one to watch in the RWA wave 🌊

ETH Elliott wave analysis 1/10 /2025In my point of view , The wave (IV) is end and we are going to finish the wave (5).The new wave ①, which has surpassed the top of wave (4) with a strong impulse, indicates that the beginning of wave (V) has likely started. Wave (IV) appears to have formed a b-failure flat, where wave C slightly exceeded 132.8%. Based on the Butterfly harmonic pattern from the higher time frame ETH analysis, the target price is projected to be in the range of $5,900–$6,400.
An alternative count is that the recent abc structure may represent waves 1, 2, and 3, with the current correction being only a minor retracement. This scenario requires further observation. However, the overall Elliott Wave structure still suggests that one more upward wave is needed to complete wave (5).

Solana at 200 Support — Bounce Toward 230 or Deeper Drop?At the moment, Solana is in an upward correction but has already reacted from the weekly pivot point at 212 . I expect to see support around the 200 – 202 zone, though a dip to 198 is also possible.
However, if the price gets stuck below 198 and fails to quickly recover above 200 , the scenario with continued downside will become the priority.
For now, I’m looking for a move down into the 200 – 202 area, followed by growth with a new local high and a push toward the first resistance level at 230 .

AI forecast suggests consolidationAfter the big energetic move we just saw, the AI suggests the market needs to catch it's breath
Don't expect too much excitement over the next couple of days

COMP daily on geometry and gann fanare these circles predicting the daily move of comp. the fan on 1/3... will it stop the sideway movement? let s see through november

Plan day 30-sep-2025Related Information:!!!
Trump has signed a proclamation adjusting the import of lumber, sawn wood, and derivative products into the United States. This comes alongside the 100% tariff on branded or patented pharmaceutical imports and the 25% tariff on all heavy-duty truck imports starting October 1, announced last week.
According to the CME Group’s FedWatch Tool, traders are pricing in a 90% probability that the Fed will cut borrowing costs by 25 basis points in October, and nearly a 70% chance of another rate cut in December. This keeps the U.S. dollar under pressure and supports the precious metal.
personal opinion:!!!
Gold price corrected sharply to $3,800 before rebounding to $3,850, aiming for $3,900.
Important price zone to consider : !!!
Resistance zone point: 3800-3850 zone

XAUUSD: Market Analysis and Strategy for September 30thGold Technical Analysis
4-Hour Chart: Resistance Level: 3870, Support Level: 3760
1-Hour Chart: Resistance Level: 3835, Support Level: 3790
30-Minute Chart: Resistance Level: 3822, Support Level: 3800
Technical Analysis: Gold has completed a falling engulfing pattern on the 4-hour chart. The candlestick chart has broken through the short-term moving average, signaling a short-term downward correction. Focus on support around 3785 in the short term. In the New York market, watch for a second decline after a rebound or wait for a drop to support levels to look for buying opportunities. Following the consecutive sharp declines on the hourly chart, further declines are possible, and a step-down pattern is expected. In the New York market, focus on resistance above around 3822/3840 and support below between 3790 and 3770. The short-term bull-bear dividing line is 3822. I recommend selling on rallies.
Possible trading range in the NY market:
SELL: 3818-3822
SELL: 3833-3838
BUY: 3785-3790
BUY: 3765-3760

September 29 Bitcoin Bybit chart analysisHello
It's a Bitcoin Guide.
If you "follow"
You can receive real-time movement paths and comment notifications on major sections.
If my analysis was helpful,
Please click the booster button at the bottom.
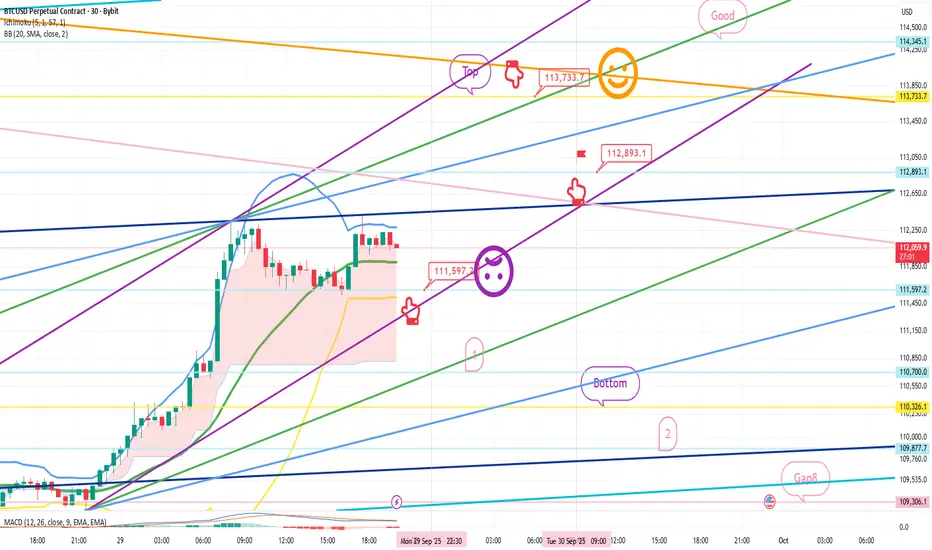
This is a Bitcoin 30-minute chart.
There are no Nasdaq indicators released today.
I developed a strategy based on the rising pattern.
*Red finger movement path:
One-way long position strategy
1. $111,597.2 long position entry point / Stop loss if the purple support line is broken
2. $113,733.7 long position first target -> Good second target
If the strategy is successful, the 112,8K level indicated
can be used as a long position re-entry point.
Up to the first section below, the price is moving sideways to the right.
From the bottom section touch, there's a high probability of a decline to the Gap 8 retracement level.
Please check the bottom support line and section 2 indicated below.
Up to this point,
I ask that you use my analysis for reference only.
I hope you operate safely, with a focus on principled trading and stop-loss orders.
Thank you.
AUDJPY Daily Forecast -Q3 | W40 | D30 | Y25|📅 Q3 | W40 | D30 | Y25|
📊 AUDJPY Daily Forecast
🔍 Analysis Approach:
I’m applying Smart Money Concepts, focusing on:
Identifying Points of Interest on the Higher Time Frames (HTFs) 🕰️
Using those POIs to define a clear trading range 📐
Refining those zones on Lower Time Frames (LTFs) 🔎
Waiting for a Break of Structure (BoS) for confirmation ✅
This method allows me to stay precise, disciplined, and aligned with the market narrative, rather than chasing price.
💡 My Motto:
"Capital management, discipline, and consistency in your trading edge."
A positive risk-to-reward ratio, paired with a high win rate, is the backbone of any solid trading plan 📈🔐
⚠️ Losses?
They’re part of the mathematical game of trading 🎲
They don’t define you — they’re necessary, they happen, and we move forward 📊➡️
🙏 I appreciate you taking the time to review my Daily Forecast.
Stay sharp, stay consistent, and protect your capital
— FRNGT 🚀
FX:AUDJPY

AUDUSD Daily Forecast -Q3 | W40 | D30 | Y25|📅 Q3 | W40 | D30 | Y25|
📊 AUDUSD Daily Forecast
🔍 Analysis Approach:
I’m applying Smart Money Concepts, focusing on:
Identifying Points of Interest on the Higher Time Frames (HTFs) 🕰️
Using those POIs to define a clear trading range 📐
Refining those zones on Lower Time Frames (LTFs) 🔎
Waiting for a Break of Structure (BoS) for confirmation ✅
This method allows me to stay precise, disciplined, and aligned with the market narrative, rather than chasing price.
💡 My Motto:
"Capital management, discipline, and consistency in your trading edge."
A positive risk-to-reward ratio, paired with a high win rate, is the backbone of any solid trading plan 📈🔐
⚠️ Losses?
They’re part of the mathematical game of trading 🎲
They don’t define you — they’re necessary, they happen, and we move forward 📊➡️
🙏 I appreciate you taking the time to review my Daily Forecast.
Stay sharp, stay consistent, and protect your capital
— FRNGT 🚀
FX:AUDUSD

#ETH/USDT : Bounce From Support, Eyes on $ 4128#ETH
The price is moving within a descending channel on the 1-hour frame, adhering well to it, and is heading for a strong breakout and retest.
We have a bearish trend on the RSI indicator that is about to be broken and retested, which supports the upward breakout.
There is a major support area in green at 3950, which represents a strong support point.
We are heading for consolidation above the 100 moving average.
Entry price: 4012.
First target: 4050.
Second target: 4084.
Third target: 4128.
Don't forget a simple matter: capital management.
When you reach the first target, save some money and then change your stop-loss order to an entry order.
For inquiries, please leave a comment.
Thank you.
