The beauty of the Sine WaveWhen using the Sine Wave as a validation to time , it can add the extra bit of information needed for where price would like to turn around at.
To give us the edge, I am making the AI system more robust so that it's easier to use on the TDV charts...
More on that in the next videos
Gann

Q3 | W40 | D30 | Y25| -GBPUSD Daily Forecast📅 Q3 | W40 | D30 | Y25|
📊 GBPUSD Daily Forecast
🔍 Analysis Approach:
I’m applying Smart Money Concepts, focusing on:
Identifying Points of Interest on the Higher Time Frames (HTFs) 🕰️
Using those POIs to define a clear trading range 📐
Refining those zones on Lower Time Frames (LTFs) 🔎
Waiting for a Break of Structure (BoS) for confirmation ✅
This method allows me to stay precise, disciplined, and aligned with the market narrative, rather than chasing price.
💡 My Motto:
"Capital management, discipline, and consistency in your trading edge."
A positive risk-to-reward ratio, paired with a high win rate, is the backbone of any solid trading plan 📈🔐
⚠️ Losses?
They’re part of the mathematical game of trading 🎲
They don’t define you — they’re necessary, they happen, and we move forward 📊➡️
🙏 I appreciate you taking the time to review my Daily Forecast.
Stay sharp, stay consistent, and protect your capital
— FRNGT 🚀
FX:GBPUSD

#Gold is in an important "price" and "time" range, and a correct#Gold is in an important "price" and "time" range, and a correction is not far off in the short term.
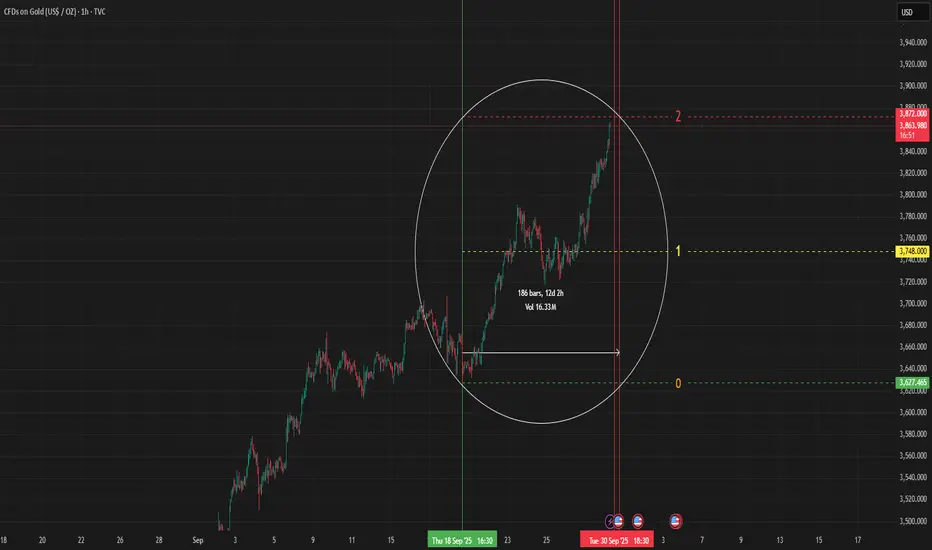
gold levels gold is still hitting all time high we are getting close to the purple level 3860 so here's a couple higher levels


BTC.D Update – Monday 29.09.2025📊 📊 BTC.D Update – Monday 29.09.2025
Alright Members, let’s talk Alts! 🚀
As I mentioned in my last analysis, Bitcoin Dominance started a retracement last week and reached our black line (Arrow #3) perfectly ✅. So far, everything is moving according to plan.
We even saw dominance break below the black area for a moment, but the very next day it reversed right back inside. That tells us one thing 👉 dominance is still in a downtrend.
⚡ Here’s the key:
* If Bitcoin continues its uptrend and BTC.D breaks below our black line (Arrow #4 downside) → this would be a strong bull run signal for ALTS. 🌊
* Until then, expect accumulation near Arrow #3 and distribution near Arrow #4.
👉 My view hasn’t changed: Patience is power. Better to wait for a clear direction before jumping into new trades. The market is setting up something big — timing it right will make all the difference.
Stay sharp, stay motivated, and remember: discipline now = profits later. 💪🔥
Alright Memebrs, let’s talk Alts! 🚀
As I mentioned in my last analysis, Bitcoin Dominance started a retracement last week and reached our black line (Arrow #3) perfectly ✅. So far, everything is moving according to plan.
We even saw dominance break below the black area for a moment, but the very next day it reversed right back inside. That tells us one thing 👉 dominance is still in a downtrend.
⚡ Here’s the key:
* If Bitcoin continues its uptrend and BTC.D breaks below our black line (Arrow #4 downside) → this would be a strong bull run signal for ALTS. 🌊
* Until then, expect accumulation near Arrow #3 and distribution near Arrow #4.
👉 My view hasn’t changed: Patience is power. Better to wait for a clear direction before jumping into new trades. The market is setting up something big — timing it right will make all the difference.
Stay sharp, stay motivated, and remember: discipline now = profits later. 💪🔥

BTC Update – Monday, 29.09.2025🚀 BTC Update – Monday, 29.09.2025 🚀
Bitcoin gave us some real fireworks over the weekend! 🎇 After hunting stop losses on both buy and sell sides, price quickly reversed and pumped back into the zone of indecision.
📌 In my last analysis, I mentioned two key levels:
* 113,460
* 116,310
Last week, BTC broke downside of 113,460, which was the first confirmation of a downtrend wave. But guess what? The market didn’t confirm the breakout – instead, price snapped back up, showing that bulls are still alive and fighting! 🐂🔥
👉 My view remains the same:
* If BTC breaks above the Yellow Line (Arrow #1) → we enter super bullish mode 🟢 and momentum can explode higher.
* If BTC fails to break and gets rejected from there → we could see a drop towards 100K 🔻.
* On the higher time frame, BTC is still in a range between Arrow #1 and Arrow #3. Until one side breaks cleanly, we stay patient and let the market decide the real direction.
💡 Reminder for all traders: Sometimes the best trade is no trade. Let the price confirm – don’t rush. Patience = Profits! 🧘♂️💰
⚡Stay focused, stay motivated, and remember – market shakeouts are designed to test weak hands. Strong hands win in the long run. 💪🔥

correct again :)It's awesome watching the price action follow my predictions like this
it makes me feel the markets aren't real sometimes

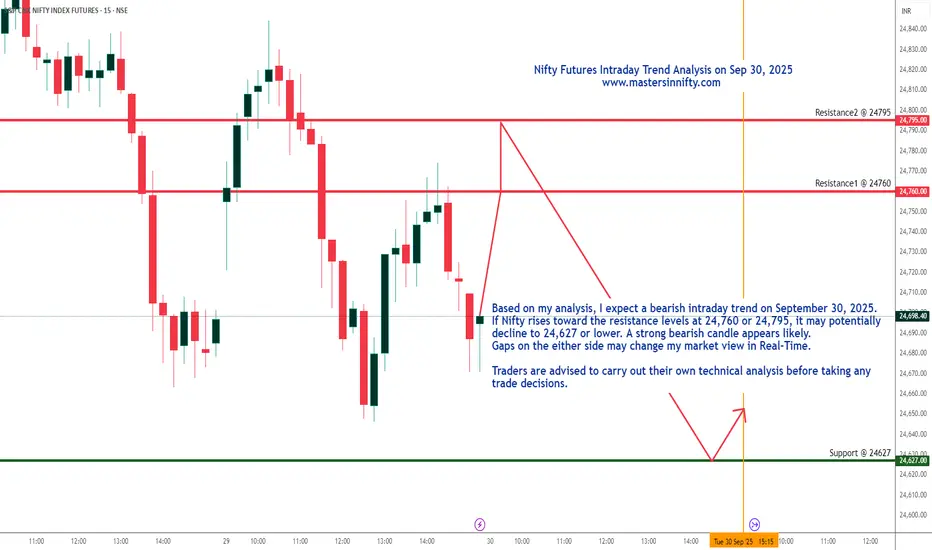
Nifty Futures Intraday Trend analysis on Sept 30, 2025Based on my analysis, I expect a bearish intraday trend on September 30, 2025. If Nifty rises toward the resistance levels at 24,760 or 24,795, it may potentially decline to 24,627 or lower. A strong bearish candle appears likely. Gaps on the either side may change my market view.
Traders are advised to carry out their own technical analysis before taking any trade decisions.
GBPUSD Q3 W40 D29 Y25 – Full Top Down Analysis+3% Return📊 GBPUSD Q3 W40 D29 Y25 – Full Top Down Analysis ✅ +3% Return
📉 Daily: 50 EMA confirming short bias
⏳ 4H: 50 EMA + Order Block in line with structure (LLs & LHs)
🧩 4H → 1H / 15’: Order Block refinement across lower TFs
🔑 1H: Break of Structure (BOS)
⏱ 15’: Order Block reaction → Short entry
🕔 5’: Order Block formed at highs after 15’ short move
⏱ 1’: BOS before retest of 5’ Order Block
🎯 Execution: Sell Limit triggered
💰 Result: 1:3 RRR secured → +3% banked
— FRGNT 🚀
🔍 Analysis Approach:
I’m applying Smart Money Concepts, focusing on:
Identifying Points of Interest on the Higher Time Frames (HTFs) 🕰️
Using those POIs to define a clear trading range 📐
Refining those zones on Lower Time Frames (LTFs) 🔎
Waiting for a Break of Structure (BoS) for confirmation ✅
This method allows me to stay precise, disciplined, and aligned with the market narrative, rather than chasing price.
💡 My Motto:
"Capital management, discipline, and consistency in your trading edge."
A positive risk-to-reward ratio, paired with a high win rate, is the backbone of any solid trading plan 📈🔐
⚠️ Losses?
They’re part of the mathematical game of trading 🎲
They don’t define you — they’re necessary, they happen, and we move forward 📊➡️
🙏 I appreciate you taking the time to review my Daily Forecast.
Stay sharp, stay consistent, and protect your capital
— FRNGT 🚀
FX:GBPUSD

GBPUSD Daily Forecast -Q3 | W40 | D29 | Y25| - Updated📅 Q3 | W40 | D29 | Y25|
📊 GBPUSD Daily Forecast Update
🔍 Analysis Approach:
I’m applying Smart Money Concepts, focusing on:
Identifying Points of Interest on the Higher Time Frames (HTFs) 🕰️
Using those POIs to define a clear trading range 📐
Refining those zones on Lower Time Frames (LTFs) 🔎
Waiting for a Break of Structure (BoS) for confirmation ✅
This method allows me to stay precise, disciplined, and aligned with the market narrative, rather than chasing price.
💡 My Motto:
"Capital management, discipline, and consistency in your trading edge."
A positive risk-to-reward ratio, paired with a high win rate, is the backbone of any solid trading plan 📈🔐
⚠️ Losses?
They’re part of the mathematical game of trading 🎲
They don’t define you — they’re necessary, they happen, and we move forward 📊➡️
🙏 I appreciate you taking the time to review my Daily Forecast.
Stay sharp, stay consistent, and protect your capital
— FRNGT 🚀
FX:GBPUSD

Uptrend? what an interesting start to the week...
This trend didn't create a lower low on the dominant trend chart.
this either means some dodgy price action is going to fly in, or perhaps we've switched over to an uptrend.
I'm going to get to my AI forecasting upgraded to make daily predictions more frequent

Plan day: 29-sep 2025 Related Information:!!!
U.S. inflation, as measured by the Personal Consumption Expenditures (PCE) Price Index, rose to 2.7% year-on-year in August from 2.6% in July, the Bureau of Economic Analysis reported on Friday. The figure was in line with market consensus. Meanwhile, the core PCE Price Index, which excludes volatile food and energy prices, increased 2.9% year-on-year in August, matching both the July pace and analysts’ estimates. On a monthly basis, headline PCE and core PCE rose 0.3% and 0.2%, respectively.
Markets are currently pricing in nearly an 88% probability of a Fed rate cut in October and a 65% chance of an additional cut in December, according to the CME FedWatch Tool. Lower interest rates could reduce the opportunity cost of holding Gold, thereby supporting the non-yielding precious metal.
personal opinion:!!!
Gold extends gains, targeting $3,850.

XAUUSD: Market Analysis and Strategy for September 29thGold is currently rising, so there's no need to speculate on where the top will be; simply follow the trend. After a period of consolidation and building momentum, gold bulls have surged $60, breaking through the $3,800 level. Therefore, the $3,800 level has become strong short-term support for gold, so continue buying on dips around $3,800.
In the long term, the precious metal maintains a favorable bullish outlook. Although the Relative Strength Index (RSI) is high, indicating overbought conditions, this suggests the possibility of market consolidation or a short-term sell-off. Key support for gold lies in the $3,800-$3,810 range. If gold continues to trade above $3,800, it could rise to $3,850. The NY market is focusing on resistance above the $3,830-$3,850 level, while the $3,800-$3,780 support range is under consideration. The short-term bull-bear boundary for gold is $3,800, so I recommend buying on dips!
NY Market Buy Range:
BUY: 3801-3806,
BUY: 3782-3787

NEW CME GAP FILL EXPECTED good day to all, starting off this week with another cme gap , signaling that this week or maybe the next few days the market may face a drop based on the gap that has been created ,
just to let you guys know i will open a short position solely based on the gap and my tp will be on 110110.
stay focused stay sharp.

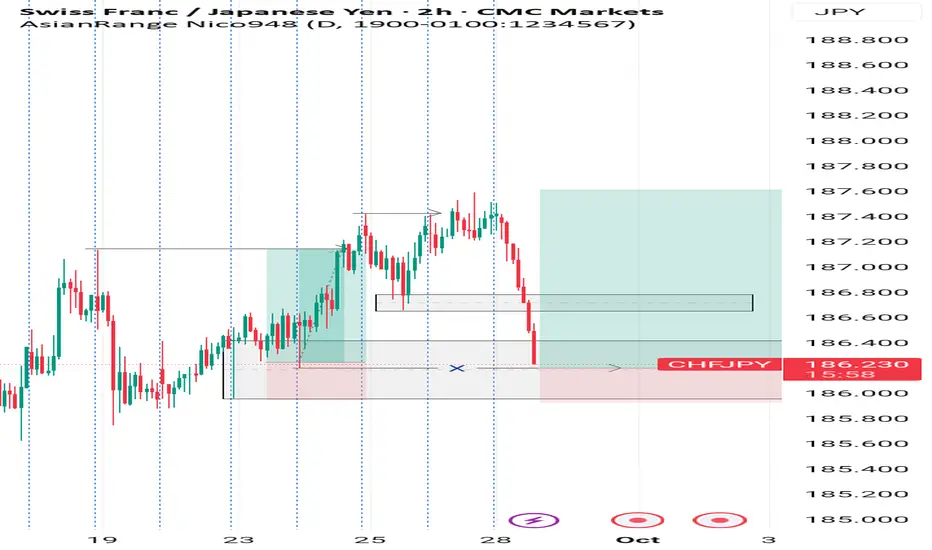
CHFJPY BUYS 1hr timeframeCHFJPY (1HR TF)
No confirmation, no entry ⚠️
Price just swept liquidity below previous lows and is now retracing into a supply/FVG zone.
🔹 Plan:
• Wait for price to tap into the zone (grey box).
• Look for bullish confirmation (CHoCH / engulfing / LTF break).
• Target = liquidity zone
⚠️ Patience = key. Jumping in without confirmation is how you get trapped.
AUDJPY Daily Forecast -Q3 | W40 | D29 | Y25|FX:AUDJPY
📅 Q3 | W40 | D29 | Y25|
📊 AUDJPY Daily Forecast
🔍 Analysis Approach:
I’m applying Smart Money Concepts, focusing on:
Identifying Points of Interest on the Higher Time Frames (HTFs) 🕰️
Using those POIs to define a clear trading range 📐
Refining those zones on Lower Time Frames (LTFs) 🔎
Waiting for a Break of Structure (BoS) for confirmation ✅
This method allows me to stay precise, disciplined, and aligned with the market narrative, rather than chasing price.
💡 My Motto:
"Capital management, discipline, and consistency in your trading edge."
A positive risk-to-reward ratio, paired with a high win rate, is the backbone of any solid trading plan 📈🔐
⚠️ Losses?
They’re part of the mathematical game of trading 🎲
They don’t define you — they’re necessary, they happen, and we move forward 📊➡️
🙏 I appreciate you taking the time to review my Daily Forecast.
Stay sharp, stay consistent, and protect your capital
— FRNGT 🚀

NIFTY Analysis 29 SEPTEMBER, 2025 ,Daily Morning update at 9 amsummarizing the understanding of **Gann Indicators** from your provided content
- Basics of Gann Indicators
1. Gann indicators are based on the idea that **markets rotate from angle to angle**.
2. When one angle is broken, **price moves towards the next angle**.
3. Multiple angles together form a **Gann Fan**.
4. Gann angles analyze **pattern, price, and time** simultaneously.
5. Gann believed the **past, present, and future exist together** on a Gann angle.
Gann Angles vs. Trendlines
6. A **Gann angle** is a diagonal line moving at a **uniform rate of speed**.
7. A **trendline** is drawn by connecting tops-to-tops or bottoms-to-bottoms.
8. Unlike trendlines, Gann angles allow forecasting **where price will be on a future date**.
9. Trendlines require frequent adjustment, making them less reliable for **long-term forecasts**.
10. Gann angles provide **predictive value** by projecting consistent support and resistance levels.
Special Considerations
11. Gann believed **time, price, and market action are interconnected**.
12. Gann angles forecast **support and resistance** levels.
13. **Up-trending angles act as support**, while **down-trending angles act as resistance**.
14. Markets tend to **rotate from one angle to the next** (“rule of all angles”).
15. Combining Gann angles with **retracement levels (like 50%)** strengthens support/resistance zones.
Strength and Weakness of Market
16. The **main Gann angles** are 1x2, 1x1, and 2x1.
17. **1x2 angle** = 1 unit price for every 2 units of time (weaker trend).
18. **1x1 angle** = 1 unit price for 1 unit of time (balanced trend).
19. **2x1 angle** = 2 units price for 1 unit of time (strong trend).
20. Other ratios include 1x8, 1x4, 4x1, 8x1, etc.
Chart Scaling and Interpretation
21. Gann stressed the importance of a **properly scaled chart** (“square charts”).
22. The **1x1 angle** is often referred to as the **45-degree angle**, but only valid with correct scaling.
23. Trading **above 2x1** = strong uptrend; trading **near 1x2** = weaker trend.
24. Trading **below 1x1** = weak or bearish market condition.
25. **Price clusters** (multiple angles converging) represent **strong support or resistance zones**.

Swing Trade Took Long Position in CHFJPY as per Order Flow with Proper Risk Management, Lets see what Price do next

EURGBP Daily Forecast -Q3 | W40 | D29 | Y25|FX:EURGBP
📅 Q3 | W40 | D29 | Y25|
📊 EURGBP Daily Forecast
🔍 Analysis Approach:
I’m applying Smart Money Concepts, focusing on:
Identifying Points of Interest on the Higher Time Frames (HTFs) 🕰️
Using those POIs to define a clear trading range 📐
Refining those zones on Lower Time Frames (LTFs) 🔎
Waiting for a Break of Structure (BoS) for confirmation ✅
This method allows me to stay precise, disciplined, and aligned with the market narrative, rather than chasing price.
💡 My Motto:
"Capital management, discipline, and consistency in your trading edge."
A positive risk-to-reward ratio, paired with a high win rate, is the backbone of any solid trading plan 📈🔐
⚠️ Losses?
They’re part of the mathematical game of trading 🎲
They don’t define you — they’re necessary, they happen, and we move forward 📊➡️
🙏 I appreciate you taking the time to review my Daily Forecast.
Stay sharp, stay consistent, and protect your capital
— FRNGT 🚀
FX:EURGBP

XAUUSD — Base Analysis (D1 focus)Market State
Range: Upper band at fresh highs; prior sideways box ~3,450–3,350 → breakout above
Slope: Uptrend (strong)
Base Bias: Upside continuation even with pullbacks; first, expect the ~3,700 area to hold
Key Levels
Resistance: 3,820 → 3,900 → 4,000 (psychological)
Support: 3,700–3,680 (breakout base) → 3,600 → 3,520–3,480 → 3,420–3,350 (old box top/bottom)
Decision Rules (plain)
D1 close above 3,700 and retest holds ⇒ Upside scenario active
Targets: 3,820 → 3,900 → 4,000
D1 close below 3,700 ⇒ Correction scenario active
Targets: 3,600 → 3,520–3,480 → 3,420–3,350
Working Note
This is a technical price-structure read; for entries, seek break + retest confirmation on H4/M15.
The base bias weakens with sustained trade below 3,700 and subsequent loss of 3,600; it re-strengthens on a D1 close back above 3,820.

BTCUSD — Base Analysis (D1 focus)BTCUSD — Base Analysis (D1 focus)
Market State
Range: 116.5–118k (top) ↔ 110k (bottom)
Slope: Slightly downward
Base Bias: Higher probability of a sweep below 110k first
Key Levels
Resistance: 116.5–118k → 120k → 124k
Support: 110k → 107–105k → 102k → 100k
Decision Rules (plain)
H4/D1 close below 110k ⇒ Downside scenario
Targets: 107–105k → 102k → 100k
H4/D1 close above 116.5k ⇒ Upside scenario
Targets: 120k → 124k
Working Note
This is a technical price-structure read; seek break + retest confirmation on H4/M15 for entries.
The base bias invalidates with a sustained close above 116.5k.

EURUSD Daily Forecast -Q3 | W40 | D29 | Y25|📅 Q3 | W40 | D29 | Y25|
📊 EURUSD Daily Forecast
🔍 Analysis Approach:
I’m applying Smart Money Concepts, focusing on:
Identifying Points of Interest on the Higher Time Frames (HTFs) 🕰️
Using those POIs to define a clear trading range 📐
Refining those zones on Lower Time Frames (LTFs) 🔎
Waiting for a Break of Structure (BoS) for confirmation ✅
This method allows me to stay precise, disciplined, and aligned with the market narrative, rather than chasing price.
💡 My Motto:
"Capital management, discipline, and consistency in your trading edge."
A positive risk-to-reward ratio, paired with a high win rate, is the backbone of any solid trading plan 📈🔐
⚠️ Losses?
They’re part of the mathematical game of trading 🎲
They don’t define you — they’re necessary, they happen, and we move forward 📊➡️
🙏 I appreciate you taking the time to review my Daily Forecast.
Stay sharp, stay consistent, and protect your capital
— FRNGT 🚀
FX:EURUSD
