Gann

After falling below 3260, the downward space opens upYesterday's US ADP data did not make gold rise straight. The gold price only rebounded slightly and then fell straight in the US market. At present, the trend of gold has fallen below the support of 3230. New downward space has been opened. For our short-term investors, we just need to follow the trend!
The first point of the day is that we first focus on the top and bottom conversion position of 3250, and then the high point where the NY market began to fall. In the Asian session, we will follow the trend in short-term operations. When gold rebounds to around 3250, we can find opportunities to short. Pay attention to the long-short watershed of 3280 during the day. As long as gold is still running below 3280, we will maintain a bearish view!
Buying range: 3220-3218, SL: 3208, TP: 3260-3265
Selling range: 3260-3262, SL: 3272, TP: 3230-3220
Key points:
First support level: 3220, second support level: 3210, third support level: 3200
First resistance level: 3260, second resistance level: 3270, third resistance level: 3280
More sharing, free viewing

AUDCHFno description, you can see on chart. if profit it will 100 pips.
“Don't ever make the mistake of believing that market success has to come to you fast. Trade small, stay in the game, persist, and eventually, you'll reach a satisfying level of proficiency.”
― Yvan Byeajee

EURUSDWeekly Still bullish
Daily its on a uptrend
H4 its seems to be building a Head and Shoulders pattern
H1 its very choppy

FMG .....just wait for 12.06Will wait for hunt at 12.06.... Will be great ride considering the 7% dividends for target of 16.9 and 21..... I think it will be good hold..... Please note this is not financial advice, please do you own research.

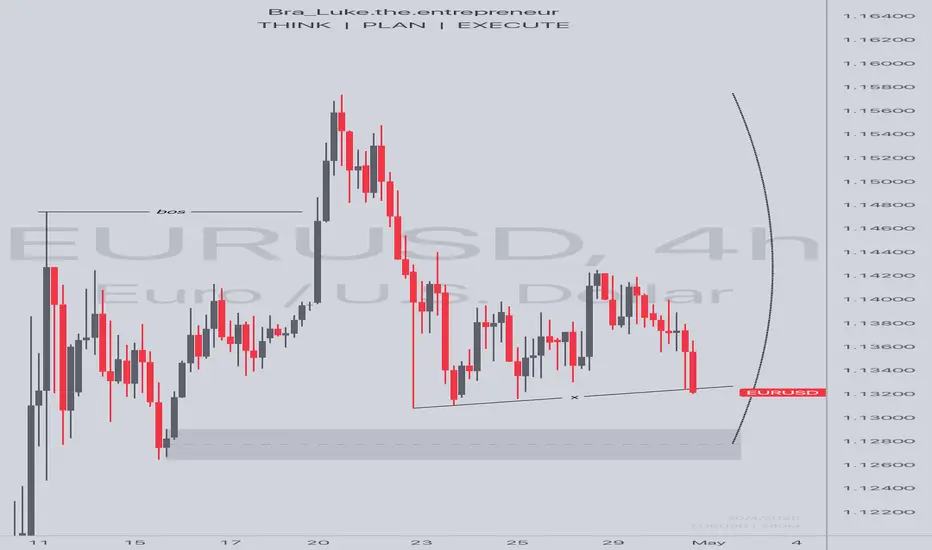
LongPossible buy setup on EU
Previous BOS, relatively equal lows build up above the 4H OB.. so we sit patiently for a clear buys by MS on a lower timeframe
NKE Accumulate in 2025 and new cycle commencementUsing W.D. Gann's Star method, NKE appears to have completed a downward cycle in terms of time, hitting a low of 52.28. The 360-degree angle points to a key support level around 50.19. After trending downward for about 3.45 years, the current price range of 49.8 to 52 looks like an interesting accumulation zone. This could be a potential buying opportunity, with possible selling targets in 2026-2027 around 82 and 115.
Important Note:
I’m just sharing my thoughts here based on this analysis—it’s not financial advice! Please do your own research before making any investment decisions.

GBP/NZD Long Setup🔹 GBP/NZD Long Setup
Price tapped into a clear demand zone and showed signs of rejection and potential reversal. I'm anticipating a bullish move toward the next resistance level.
📍 Entry Zone: Around 2.2440
🛑 Stop Loss: 2.2396
🎯 Target (TP): 2.2619
💡 Risk-Reward Ratio: Over 1:4

DAX: Target Is Down! Short!
My dear friends,
Today we will analyse DAX together☺️
The market is at an inflection zone and price has now reached an area around 22,461.17 where previous reversals or breakouts have occurred.And a price reaction that we are seeing on multiple timeframes here could signal the next move down so we can enter on confirmation, and target the next key level of 22,275.67..Stop-loss is recommended beyond the inflection zone.
❤️Sending you lots of Love and Hugs❤️

GOLD: Move Up Expected! Long!
My dear friends,
Today we will analyse GOLD together☺️
The price is near a wide key level
and the pair is approaching a significant decision level of 3,300.87 Therefore, a strong bullish reaction here could determine the next move up.We will watch for a confirmation candle, and then target the next key level of 3,322.41.Recommend Stop-loss is beyond the current level.
❤️Sending you lots of Love and Hugs❤️

EURUSD: Local Bearish Bias! Short!
My dear friends,
Today we will analyse EURUSD together☺️
The recent price action suggests a shift in mid-term momentum. A break below the current local range around 1.13366 will confirm the new direction downwards with the target being the next key level of 1.13144.and a reconvened placement of a stop-loss beyond the range.
❤️Sending you lots of Love and Hugs❤️

SILVER: Strong Growth Ahead! Long!
My dear friends,
Today we will analyse GOLD together☺️
The in-trend continuation seems likely as the current long-term trend appears to be strong, and price is holding above a key level of 32.688 So a bullish continuation seems plausible, targeting the next high. We should enter on confirmation, and place a stop-loss beyond the recent swing level.
❤️Sending you lots of Love and Hugs❤️

CRV/USDT – 2W Chart Overview
The price is currently consolidating after a prolonged downtrend and shows signs of a potential trend reversal.
The price has broken out of a falling wedge (bullish pattern).
Currently testing the Fibonacci retracement levels — most notably the 0.5 - 0.618 zone, which may act as a pullback entry zone.
📌 Key Buy Zone: Retest of the breakout near the 0.618 Fibonacci level (~0.55 - 0.60) could offer a strategic entry if confirmed by price action.
🎯 Upside Targets:
1st Target: 1.0966 USDT
2nd Target: 1.3328 USDT
3rd Target: 1.6212 USDT
Invalidation: Break below the support zone near 0.45 would invalidate this setup.

#FLOKI gonna see 600 % profit.... at leastIf I'm gonna bet on one coin that can make 600 % profit it will be #FLOKI
best buying areas are
0.000078_0.000076
0.000033_0.000041
Targets are
0.00035
0.00055


GOLD VS BTC: 2026 Like it or not, Bitcoin is behaving like a risk on asset but with the seasonality of a commodity. so there are reasons to compare the pair with its rival Gold to peek into the future, much like people do with the dollar and its fake blockchain derivates. the implications of a brutal 2025 bear market could be really bad for crypto and I seriously doubt that market makers would ever allow that. however, it's clear that they are playing with retail emotions pretty hard since COVID happened. everything is permitted, also a great wealth transfer. especially when nationwide "blackouts" happens in first world countries like Spain and France.

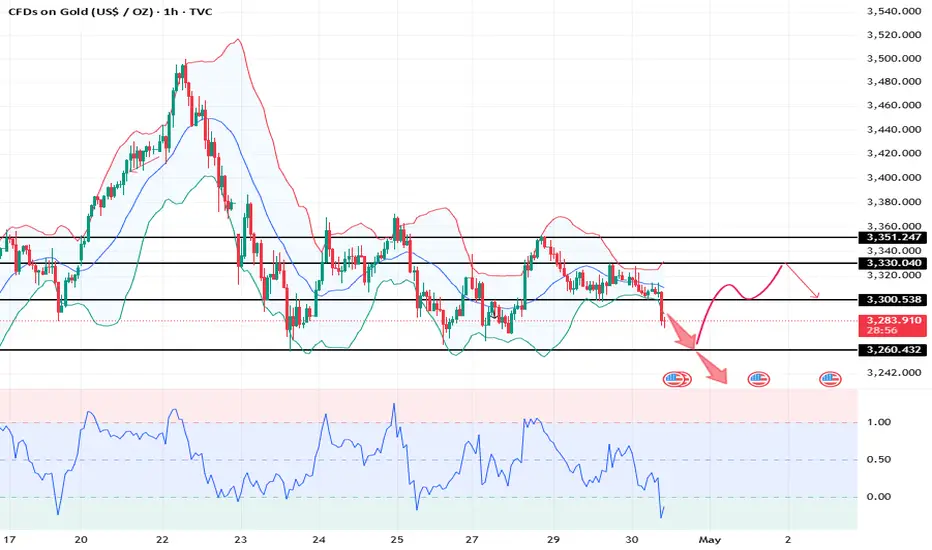
XAUUSD: 30/4 Today’s Market Analysis and StrategyGold technical analysis
The resistance level of the four-hour chart is 3330, and the support level is 3260.
The resistance level of the one-hour chart is 3307, and the support level is 3275.
The resistance level of the 30-minute chart is 3300, and the support level is 3280.
The 4H cycle is a horizontal box operation. This week is a data week. The gold price is greatly affected by the news. Wait for the NFP data on Friday to break the box operation. Due to the recent market fluctuations, the entry position is very critical. For the time being, focus on the previous support of 3300 today. If the US market stands at 3300, it can be bullish to the 3320~3330 area. On the contrary, if it falls below the 4H and daily support of 3260 US dollars, it may touch the monthly support level of 3230~3200.
There are many news about the US market data today. Wait for the data to be released before trading! Avoid losses caused by increased liquidity during the news release.
Trading strategy:
Buy: 3265 SL:3260
Buy: 3300 SL:3295
Sell: 3330 SL:3335
Sell: 3260 SL:3265
Only provide trading direction, specific entry price, SL/TP need to wait for real-time liquidity confirmation
April 29 Bitcoin Bybit chart analysisHello
It's a Bitcoinguide.
If you have a "follower"
You can receive comment notifications on real-time travel routes and major sections.
If my analysis is helpful,
Please would like one booster button at the bottom.
This is the Nasdaq 30-minute chart.
There will be an indicator announcement at 11 o'clock in a little while.
After the 4-hour chart MACD dead cross was imprinted yesterday
Today, two things are clear
*Red finger strong rise or purple finger major rebound.
The main issue was whether the 6-hour chart MACD dead cross occurred
After writing the analysis, looking at the overall movement
The purple finger seems strong today.
Let's apply it to Bitcoin as it is.
This is a 30-minute Bitcoin chart.
At the bottom left, I connected the long position entry point of $93,046 that I entered in the analysis article on the 25th.
Bitcoin and Tether dominance are moving sideways.
Bitcoin is slightly more advantageous in terms of MACD signals or Ichimoku Kinko Hyo,
but it is not strange if one side skyrockets or plummets.
While moving sideways, I was watching Nasdaq,
and I paid attention to the Nasdaq movement.
*Red finger movement path
One-way long position strategy
1. 94242.4 dollar long position entry section / green support line breakaway stop loss price
2. 96005.1 dollar long position 1st target -> Top 2nd target -> Final Good
The 1st section at the top is the rising wave position
If you touch it first, the possibility of success of the strategy increases.
If the strategy is successful, it would be good to use it as the final long position re-entry.
Depending on the adjustment coming out of Nasdaq, it can be pushed up to section 2
Roughly, it is the support line of the Bollinger Band 6-hour chart.
If the rebound fails in Nasdaq
Bottom -> Please note that it can be pushed to section 3.
Up to this point, please use my analysis as a simple reference and use.
Thank you.

GANNSQ9 + LRC + FIBO RETRACEMENTThe price has broken the upper line of the linear regregreesion lines in this chart. It indicates potential reversal of trend. The fibonacci retracement line dram from 394.70 to 198.55 shows important levels for the bulls to reach. The price is already above the 23.6 % and is looking toward 38.2% (273.55) . The GANN square of Nine shows important support and resistance for near term.

BTCI am closely monitoring BTC price action and will look at how it manages on the upcoming NYO. As seen on the chart I have market out my points of interest with the blue lines, take it as my potential entry points. I will be updating my views on BTC as soon as possible.
As you can see, I market out liquidity and potential entry points. As always I will monitor PA closely and provide a possible entry setup when I see it possible.
Remember to trade with mind and not with heart!
I always appreciate a follow, keeps me going :) thanks !!!!

SOLOn CRYPTOCAP:SOL you can see the support zone I mark out. Take them as POI and watch PA closely when it reaches them. When I see a proper confirmation on either of the support levels you see on the chart I will announce it asap and notify you guys about my entry.
Remember to always use a stop loss and proper take profit to eliminate emotions and secure the profits.
Goodluck!
I always appreciate a follow, it keeps me going :) thanks!!!

USDCAD LONG FORECAST Q2 W18 D30 Y25 USDCAD LONG FORECAST Q2 W18 D30 Y25
Professional Risk Managers👋
Welcome back to another FRGNT chart update📈
Diving into some Forex setups using predominantly higher time frame order blocks alongside confirmation breaks of structure.
Let’s see what price action is telling us today!
💡Here are some trade confluences📝
✅Intraday bullish breaks of structure
✅Tokyo ranges to be filled
✅Daily low rejection
✅1' order block identified
🔑 Remember, to participate in trading comes always with a degree of risk, therefore as professional risk managers it remains vital that we stick to our risk management plan as well as our trading strategies.
📈The rest, we leave to the balance of probabilities.
💡Fail to plan. Plan to fail.
🏆It has always been that simple.
❤️Good luck with your trading journey, I shall see you at the very top.
🎯Trade consistent, FRGNT X

GANN SQ9+ INV H&S + FIBO The inverted head and shoulder pattern can be observed in the chart. It is a bullish reversal chart pattern indicating potential shift from downtrend to uptrend. The green horizontal line was the support that was broken with a gap and is the potential target for the bulls to reach. The Fibonacci retracement from 1807 to 1084.05 provide important levels for the bulls to watch for. The GANN Sq9 provide near term support and resistances .
