GBPNZD - Marco Trend Still Up!Hello TradingView Family / Fellow Traders. This is Richard, also known as theSignalyst.
📈GBPNZD has been overall bullish from a macro perspective trading within the rising channels in blue and orange.
Moreover, the green zone is a strong support, structure and demand.
🏹 Thus, the highlighted blue circle is a strong area to look for buy setups as it is the intersection of support and lower orange/blue trendlines acting non-horizontal support.
📚 As per my trading style:
As #GBPNZD approaches the blue circle zone, I will be looking for bullish reversal setups (like a double bottom pattern, trendline break , and so on...)
📚 Always follow your trading plan regarding entry, risk management, and trade management.
Good luck!
All Strategies Are Good; If Managed Properly!
~Rich
Disclosure: I am part of Trade Nation's Influencer program and receive a monthly fee for using their TradingView charts in my analysis.
GBP (British Pound)

Bearish drop off pullback resistance?GBP/JPY has reacted off the pivot and could drop to the 38.2% Fibonacci support.
Pivot: 191.76
1st Support: 189.40
1st Resistance: 193.84
Risk Warning:
Trading Forex and CFDs carries a high level of risk to your capital and you should only trade with money you can afford to lose. Trading Forex and CFDs may not be suitable for all investors, so please ensure that you fully understand the risks involved and seek independent advice if necessary.
Disclaimer:
The above opinions given constitute general market commentary, and do not constitute the opinion or advice of IC Markets or any form of personal or investment advice.
Any opinions, news, research, analyses, prices, other information, or links to third-party sites contained on this website are provided on an "as-is" basis, are intended only to be informative, is not an advice nor a recommendation, nor research, or a record of our trading prices, or an offer of, or solicitation for a transaction in any financial instrument and thus should not be treated as such. The information provided does not involve any specific investment objectives, financial situation and needs of any specific person who may receive it. Please be aware, that past performance is not a reliable indicator of future performance and/or results. Past Performance or Forward-looking scenarios based upon the reasonable beliefs of the third-party provider are not a guarantee of future performance. Actual results may differ materially from those anticipated in forward-looking or past performance statements. IC Markets makes no representation or warranty and assumes no liability as to the accuracy or completeness of the information provided, nor any loss arising from any investment based on a recommendation, forecast or any information supplied by any third-party.

Bitcoin Analysis Anticipated Bullish Rebound Toward $95,000! This 15-minute Bitcoin (BTC/USD) recent price action around key support and resistance zones. After a sharp dip to the lower green support area (~$92,500), the price is showing signs of a bullish reversal. The forecasted trajectory (highlighted in yellow) anticipates a corrective move before resuming an upward climb toward the $95,000 resistance target. Previous consolidation phases and a breakdown from a rising wedge pattern are also noted, suggesting a technical recovery is underway. Traders are watching for confirmation of this bullish setup.

Potentially bullish rise?GBP/NZD has reacted off the support level which is a pullback support and could rise from this level to our take profit.
Entry: 2.2393
Why we like it:
There is a pullback support level.
Stop loss: 2.2190
Why we like it:
There is a pullback support level.
Take profit: 2.2722
Why we like it:
There is a pullback resistance level that aligns with the 50% Fibonacci retracement.
Enjoying your TradingView experience? Review us!
Please be advised that the information presented on TradingView is provided to Vantage (‘Vantage Global Limited’, ‘we’) by a third-party provider (‘Everest Fortune Group’). Please be reminded that you are solely responsible for the trading decisions on your account. There is a very high degree of risk involved in trading. Any information and/or content is intended entirely for research, educational and informational purposes only and does not constitute investment or consultation advice or investment strategy. The information is not tailored to the investment needs of any specific person and therefore does not involve a consideration of any of the investment objectives, financial situation or needs of any viewer that may receive it. Kindly also note that past performance is not a reliable indicator of future results. Actual results may differ materially from those anticipated in forward-looking or past performance statements. We assume no liability as to the accuracy or completeness of any of the information and/or content provided herein and the Company cannot be held responsible for any omission, mistake nor for any loss or damage including without limitation to any loss of profit which may arise from reliance on any information supplied by Everest Fortune Group.

GBPNZD | 4H | SWING TRADEHey there my dear friends;
SIGNAL ALERT
BUY GBPNZD / 2,23220
🟢TP1: 2,23952
🟢TP2: 2,24909
🟢TP3: 2,27946
🔴SL: 2,20905
Enter low lot because it is high risk 🔽
RR / 2,00
Dear friends, your likes are always my biggest source of motivation for me to share analysis. For this reason, I would like to ask each and every one of my followers; please do not miss your likes.
I sincerely thank everyone who supports me with their likes.

GBPCAD - BULLISH MOVEHello Traders !
The GBPCAD broke the resistance level (1.83706 - 1.84150).
This key level becomes new support!
So, I expect a bullish move🚀
Let's wait for a retest...
____________
TARGET: 1.85720🎯

GBPCHF: Bearish Continuation & Short Signal
GBPCHF
- Classic bearish setup
- Our team expects bearish continuation
SUGGESTED TRADE:
Swing Trade
Short GBPCHF
Entry Point - 1.1052
Stop Loss - 1.1120
Take Profit - 1.0921
Our Risk - 1%
Start protection of your profits from lower levels
Disclosure: I am part of Trade Nation's Influencer program and receive a monthly fee for using their TradingView charts in my analysis.
❤️ Please, support our work with like & comment! ❤️

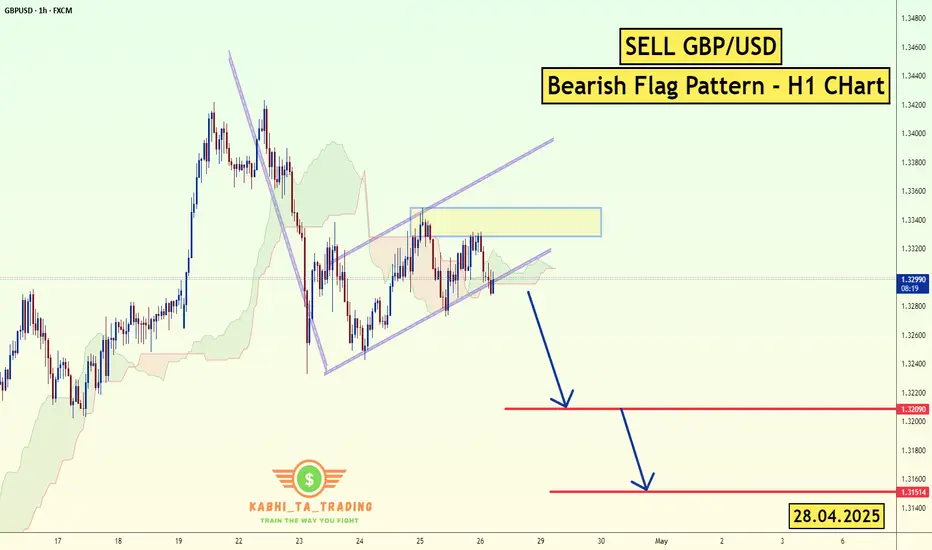
GBP/USD - H1 - Bearish Flag (28.04.2025)FX:GBPUSD The GBP/USD Pair on the H1 timeframe presents a Potential Selling Opportunity due to a recent Formation of a Bearish Flag Pattern. This suggests a shift in momentum towards the downside in the coming hours.
Possible Short Trade:
Entry: Consider Entering A Short Position around Trendline Of The Pattern.
Target Levels:
1st Support – 1.3209
2nd Support – 1.3151
🎁 Please hit the like button and
🎁 Leave a comment to support for My Post !
Your likes and comments are incredibly motivating and will encourage me to share more analysis with you.
Best Regards, KABHI_TA_TRADING
Thank you.
Fundamental Update :
on Monday as the trade tensions between the U.S. and China provided some relief to investors, while a stronger dollar further weighed on prices.
The U.S. dollar TVC:DXY rose 0.2% against a basket of currencies, making bullion more expensive for overseas buyers. TVC:DJI SP:SPX NASDAQ:IXIC also rising .
GBPUSD SELL NOW BUY LATER!Our previous idea played out perfectly once again! Currently, GBPUSD is showing signs of a pullback within a mini bearish trend. However, I still believe the overall structure remains bullish. I'll be watching for buying opportunities once this pullback completes. Stay patient and wait for confirmation!

Bulllish continuation for the Cable?GBP/USD is fallling towards the pivot and could bounce to the pullback resistance.
Pivot: 1.3110
1st Support: 1.3005
1st Resistance: 1.3415
Risk Warning:
Trading Forex and CFDs carries a high level of risk to your capital and you should only trade with money you can afford to lose. Trading Forex and CFDs may not be suitable for all investors, so please ensure that you fully understand the risks involved and seek independent advice if necessary.
Disclaimer:
The above opinions given constitute general market commentary, and do not constitute the opinion or advice of IC Markets or any form of personal or investment advice.
Any opinions, news, research, analyses, prices, other information, or links to third-party sites contained on this website are provided on an "as-is" basis, are intended only to be informative, is not an advice nor a recommendation, nor research, or a record of our trading prices, or an offer of, or solicitation for a transaction in any financial instrument and thus should not be treated as such. The information provided does not involve any specific investment objectives, financial situation and needs of any specific person who may receive it. Please be aware, that past performance is not a reliable indicator of future performance and/or results. Past Performance or Forward-looking scenarios based upon the reasonable beliefs of the third-party provider are not a guarantee of future performance. Actual results may differ materially from those anticipated in forward-looking or past performance statements. IC Markets makes no representation or warranty and assumes no liability as to the accuracy or completeness of the information provided, nor any loss arising from any investment based on a recommendation, forecast or any information supplied by any third-party.

Heading into pullback resistance?GBP/JPY is rising towards the resistance level which is a pullback resistance that lines up with the 71% Fibonacci retracement and the 161.8% Fibonacci extension and could reverse from this level to our take profit.
Entry: 192.34
Why we like it:
There is a pullback resistance that lines up with the 161.8% Fibonacci extension and the 71% Fibonacci retracement.
Stop loss: 194.82
Why we like it:
There is a pullback resistance.
Take profit: 189.96
Why we like it:
There is a pullback support level that aligns with the 38.2% Fibonacci retracement.
Enjoying your TradingView experience? Review us!
Please be advised that the information presented on TradingView is provided to Vantage (‘Vantage Global Limited’, ‘we’) by a third-party provider (‘Everest Fortune Group’). Please be reminded that you are solely responsible for the trading decisions on your account. There is a very high degree of risk involved in trading. Any information and/or content is intended entirely for research, educational and informational purposes only and does not constitute investment or consultation advice or investment strategy. The information is not tailored to the investment needs of any specific person and therefore does not involve a consideration of any of the investment objectives, financial situation or needs of any viewer that may receive it. Kindly also note that past performance is not a reliable indicator of future results. Actual results may differ materially from those anticipated in forward-looking or past performance statements. We assume no liability as to the accuracy or completeness of any of the information and/or content provided herein and the Company cannot be held responsible for any omission, mistake nor for any loss or damage including without limitation to any loss of profit which may arise from reliance on any information supplied by Everest Fortune Group.

GBPUSD 1.50 ?👀 Market Insight – GBP/USD
After a long time, I’ve revisited the currency pairs — and GBP/USD has caught my attention!
The setup is looking strong and is preparing for a move toward the 1.50 benchmark, sooner or later. 📈
Stay tuned — opportunities are lining up!

GBP_CHF CORRECTION AHEAD|SHORT|
✅GBP_CHF has retested a nice key resistance level of 1.1100
And as the pair is already making a bearish pullback
A move down to retest the demand level below at 1.0950 is likely
SHORT🔥
✅Like and subscribe to never miss a new idea!✅
Disclosure: I am part of Trade Nation's Influencer program and receive a monthly fee for using their TradingView charts in my analysis.

GBPUSD - Big Move Setting Up - Elliott Wave AnalysisGBPUSD is currently unfolding a 5-wave impulsive move according to Elliott Wave Theory.
At the moment, we are in Wave 4, which typically corrects against the larger trend.
Key Points:
Wave 2 was a simple correction, so based on alternation, Wave 4 is expected to be more complex (likely an ABC structure).
Wave 4 often retraces to the 38.2% Fibonacci level — in this case, aligning perfectly with a long-term ascending trendline, providing additional confluence for a potential buy zone.
Trade Plan:
- Monitor the ABC correction for completion near the 38.2% retracement.
- Look for bullish confirmation (trendline break, bullish structure shifts, BOS, etc.).
- Entries will be considered after clear signs of bullish pressure.
- Stoploss: Below the lows formed during the Wave 4 correction.
Targets:
First Target: 1.3400 (450 pips)
Second Target: 1.3750 (800 pips)
Summary:
Patience is key during the Wave 4 correction. Once the setup confirms, this could offer a strong risk-reward opportunity within the overall bullish impulsive structure.
See our past GBPUSD setups below:
Swing 1:
Swing 2:
Swing 3:

GBPCHF The Target Is DOWN! SELL!
My dear followers,
This is my opinion on the GBPCHF next move:
The asset is approaching an important pivot point 1.1017
Bias - Bearish
Safe Stop Loss - 1.1089
Technical Indicators: Supper Trend generates a clear short signal while Pivot Point HL is currently determining the overall Bearish trend of the market.
Goal - 1.0879
About Used Indicators:
For more efficient signals, super-trend is used in combination with other indicators like Pivot Points.
Disclosure: I am part of Trade Nation's Influencer program and receive a monthly fee for using their TradingView charts in my analysis.
———————————
WISH YOU ALL LUCK

GBPCHF - Bull No More!Hello TradingView Family / Fellow Traders. This is Richard, also known as theSignalyst.
📈From a medium-term perspective, GBPCHF has been bullish trading within the rising channel marked in blue.
This week, GBPCHF has been approaching the upper bound of its channel.
Moreover, the red zone around $1.115 is a strong support turned resistance.
🏹 Thus, the highlighted red circle is a strong area to look for sell setups as it is the intersection of the upper blue trendline and resistance.
📚 As per my trading style:
As #GBPCHF approaches the red circle zone, I will be looking for bearish reversal setups (like a double top pattern, trendline break , and so on...)
📚 Always follow your trading plan regarding entry, risk management, and trade management.
Good luck!
All Strategies Are Good; If Managed Properly!
~Rich
Disclosure: I am part of Trade Nation's Influencer program and receive a monthly fee for using their TradingView charts in my analysis.

GBPUSD Potential UpsidesHey Traders, in today's trading session we are monitoring GBPUSD for a buying opportunity around 1.32600 zone, GBPUSD is trading in an uptrend and currently is in a correction phase in which it is approaching the trend at 1.32600 support and resistance area.
Trade safe, Joe.

GBP-CHF Will Go Down! Sell!
Hello,Traders!
GBP-CHF is moving upwards
Towards the horizontal resistance
Above around 1.1125 and as the
Pair is overbought we will be
Expecting a local pullback and
A bearish correction
Sell!
Comment and subscribe to help us grow!
Check out other forecasts below too!
Disclosure: I am part of Trade Nation's Influencer program and receive a monthly fee for using their TradingView charts in my analysis.

GBP Rebounds on Retail Sales – But USD Still in Control📌 GBP Bounces on Strong Retail Sales, But USD Strength Keeps Pressure On 💷📉
The British Pound (GBP) rebounded on Friday after UK Retail Sales data surprised to the upside. According to the Office for National Statistics (ONS), retail sales rose by 0.4% in March, beating expectations of a -0.4% decline. On a yearly basis, growth accelerated to 2.6%, outpacing the forecast of 1.8%.
However, despite the positive data, traders remain confident the Bank of England (BoE) may still cut interest rates by 25 bps to 4.25% in the May meeting, due to persistent global uncertainties and softer inflation expectations.
Meanwhile, the US Dollar (USD) gained ground across the board as trade tensions between the US and China appeared to ease. Durable Goods Orders in the US jumped by 9.2% in March — a clear sign of business confidence and policy impact.
📊 Technical Outlook – GBP/USD
GBP/USD briefly recovered from an intraday low of 1.3280 but remains under pressure near key resistance.
On the upside, the psychological barrier at 1.3500 remains a major hurdle.
To the downside, the April 3rd high around 1.3200 now acts as strong support.
💼 Trading Plan
🟢 BUY ZONE:
Entry: 1.32500
SL: 1.32000
TP: 1.33300
🔴 SELL ZONE:
Entry: 1.34180
SL: 1.34700
TP: 1.33500
📌 Stay alert ahead of key BoE guidance and further US-China headlines — volatility may increase as we head into May.

GBPUSD Review - The fall whilst the Brits sleep?In this video I go through a GBPUSD review of Tuesday/Wednesday, Thursday (yesterday), and the possibilities for Friday (today).
Enjoy!
- R2F Trading

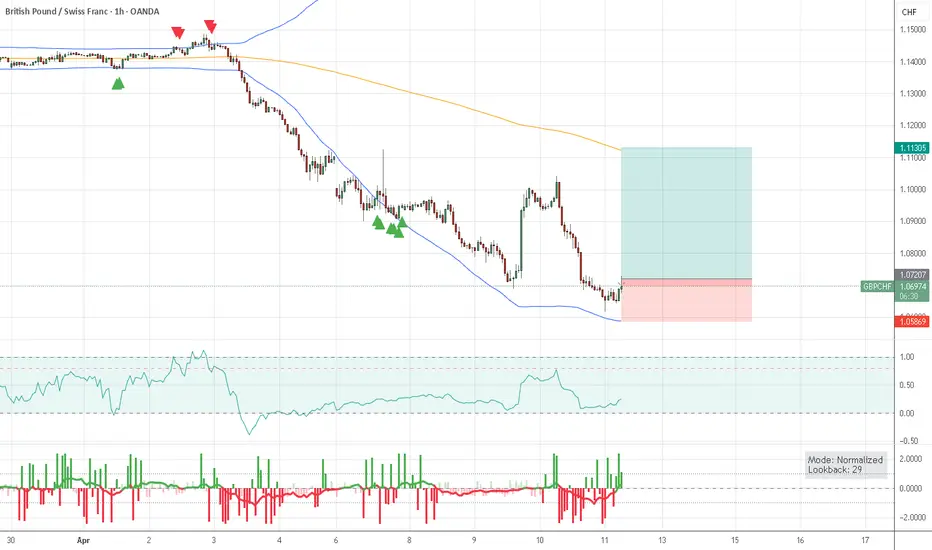
GBPCHF INTRADAY bearish oversold rallyThe GBP/CHF currency pair remains under bearish pressure, in line with the broader downtrend. Recent price movement reflects an oversold rally that stalled near a key resistance level at 1.1120, which previously acted as an intraday consolidation zone.
This level now serves as a crucial pivot. If price fails to break above 1.1120 and faces rejection, it could trigger a continuation of the bearish trend with downside targets at:
1.0690 – Initial support
1.0600 – Medium-term target
1.0460 – Long-term support level
On the flip side, a confirmed breakout and daily close above 1.1120 would invalidate the bearish bias. This would open the door for a recovery toward:
1.1200 – First resistance above the breakout
1.1250 – Key upside target
Conclusion
The bearish bias remains intact below 1.1120, with oversold rallies likely to attract selling interest. A daily close above 1.1120 would be a bullish signal, potentially shifting momentum toward higher resistance levels.
This communication is for informational purposes only and should not be viewed as any form of recommendation as to a particular course of action or as investment advice. It is not intended as an offer or solicitation for the purchase or sale of any financial instrument or as an official confirmation of any transaction. Opinions, estimates and assumptions expressed herein are made as of the date of this communication and are subject to change without notice. This communication has been prepared based upon information, including market prices, data and other information, believed to be reliable; however, Trade Nation does not warrant its completeness or accuracy. All market prices and market data contained in or attached to this communication are indicative and subject to change without notice.

GBP/CHF Finally Above The Res , Long Setup Valid To Get 200 PipsHere is my Analysis on GBP/CHF , We have a clear breakout with daily closure above my previous Res so now i`m looking to buy this pair but i`m waiting the price to go back and retest it and give me a clear bullish price action and then we can buy it and targeting 200 pips .
