Bullish bounce?EUR/GBP is reacting off the pivot and could bounce to the 1st resistance.
Pivot: 0.8337
1st Support: 0.8310
1st Resistance: 0.8377
Risk Warning:
Trading Forex and CFDs carries a high level of risk to your capital and you should only trade with money you can afford to lose. Trading Forex and CFDs may not be suitable for all investors, so please ensure that you fully understand the risks involved and seek independent advice if necessary.
Disclaimer:
The above opinions given constitute general market commentary, and do not constitute the opinion or advice of IC Markets or any form of personal or investment advice.
Any opinions, news, research, analyses, prices, other information, or links to third-party sites contained on this website are provided on an "as-is" basis, are intended only to be informative, is not an advice nor a recommendation, nor research, or a record of our trading prices, or an offer of, or solicitation for a transaction in any financial instrument and thus should not be treated as such. The information provided does not involve any specific investment objectives, financial situation and needs of any specific person who may receive it. Please be aware, that past performance is not a reliable indicator of future performance and/or results. Past Performance or Forward-looking scenarios based upon the reasonable beliefs of the third-party provider are not a guarantee of future performance. Actual results may differ materially from those anticipated in forward-looking or past performance statements. IC Markets makes no representation or warranty and assumes no liability as to the accuracy or completeness of the information provided, nor any loss arising from any investment based on a recommendation, forecast or any information supplied by any third-party.
GBP (British Pound)

GBPUSD GBPUSD Analysis & Signal (1H Timeframe)
📅 Date: March 23, 2025
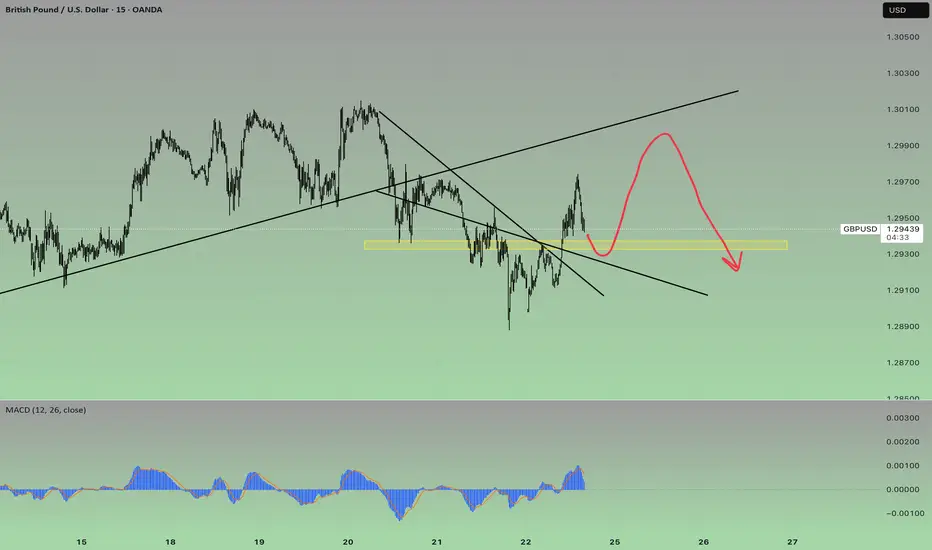
On the GBP/USD chart, the price has reached a key resistance zone around 1.29629 after an uptrend, showing signs of rejection. This resistance aligns with a descending trendline, adding to the selling pressure.
Currently, the price is heading toward the demand zone marked between 1.28613 and 1.28117, which could act as a strong support level.
Signal:
Sell:
📍Entry Point: 1.29114 (current price)
🔴Stop Loss: 1.29629 (above resistance)
🟢Take Profit 1: 1.28613
🟢Take Profit 2: 1.28117
⚠️Risk Management:
With the stop loss set above the resistance, the risk-to-reward ratio (R:R) for this trade is at least 1:2. It’s recommended to risk only 1-2% of your capital on this trade.
📝Note: Before entering the trade, wait for additional confirmations (e.g., reversal candlestick patterns or a break of the zone) and assess market conditions.

Bullish momentum to extend?GBP/JPY is falling towards the support level which is a pullback support and could bounce from this level to our take profit.
Entry: 193.69
Why we like it:
There is a pullback support level.
Stop loss: 193.46
Why we like it:
There is an overlap support level.
Take profit: 197.49
Why we like it:
There is a pullback resistance that lines up with the 61.8% Fibonacci projection.
Enjoying your TradingView experience? Review us!
Please be advised that the information presented on TradingView is provided to Vantage (‘Vantage Global Limited’, ‘we’) by a third-party provider (‘Everest Fortune Group’). Please be reminded that you are solely responsible for the trading decisions on your account. There is a very high degree of risk involved in trading. Any information and/or content is intended entirely for research, educational and informational purposes only and does not constitute investment or consultation advice or investment strategy. The information is not tailored to the investment needs of any specific person and therefore does not involve a consideration of any of the investment objectives, financial situation or needs of any viewer that may receive it. Kindly also note that past performance is not a reliable indicator of future results. Actual results may differ materially from those anticipated in forward-looking or past performance statements. We assume no liability as to the accuracy or completeness of any of the information and/or content provided herein and the Company cannot be held responsible for any omission, mistake nor for any loss or damage including without limitation to any loss of profit which may arise from reliance on any information supplied by Everest Fortune Group.

Bearish drop?GBP/CAD is reacting off the resistance level which is a pullback resistance that lines up with the 50% Fibonacci retracement and could drop from this level to our take profit.
Entry: 1.8582
Why we like it:
There is a pullback resistance level that lines up with the 50% Fibonacci retracement.
Stop loss: 1.8736
Why we like it:
There is a pullback resistance level.
Take profit: 1.8397
Why we like it:
There is a pullback support level.
Enjoying your TradingView experience? Review us!
Please be advised that the information presented on TradingView is provided to Vantage (‘Vantage Global Limited’, ‘we’) by a third-party provider (‘Everest Fortune Group’). Please be reminded that you are solely responsible for the trading decisions on your account. There is a very high degree of risk involved in trading. Any information and/or content is intended entirely for research, educational and informational purposes only and does not constitute investment or consultation advice or investment strategy. The information is not tailored to the investment needs of any specific person and therefore does not involve a consideration of any of the investment objectives, financial situation or needs of any viewer that may receive it. Kindly also note that past performance is not a reliable indicator of future results. Actual results may differ materially from those anticipated in forward-looking or past performance statements. We assume no liability as to the accuracy or completeness of any of the information and/or content provided herein and the Company cannot be held responsible for any omission, mistake nor for any loss or damage including without limitation to any loss of profit which may arise from reliance on any information supplied by Everest Fortune Group.

GBPNZD Sell Limit: Shorting from Key Resistance at 2.2590📉 GBPNZD: Sell Limit Trade Idea (Intraday)
Published: 27/03/2025 16:06 | Expires: 28/03/2025 15:00
Overview
Trading Bias: Mixed and volatile, with a preference to sell into rallies.
Market Context: GBPNZD has been showing short-term volatility, with the RSI trending higher, indicating potential for a temporary move upward before resuming the downtrend.
Trade Details
Entry (Sell Limit): 2.2590
Stop Loss: 2.2650 (-60 pips)
Take Profit: 2.2350 (+240 pips)
Risk/Reward Ratio: 4:1
Key Levels
Resistance Levels:
R1: 2.2590 (Bespoke resistance, preferred entry point)
R2: 2.2620
R3: 2.2680
Support Levels:
S1: 2.2450
S2: 2.2400
S3: 2.2330
Rationale
Preferred Setup: We expect a temporary rally into resistance at 2.2590, providing a favorable entry point to initiate short positions.
Momentum: While RSI indicates higher momentum in the short term, this aligns with a corrective rally rather than a sustained bullish move.
Volatility Risks: Key UK economic events (retail sales figures and national accounts) on 28/03/2025 at 07:00 GMT could trigger significant price swings. Traders should closely monitor these data points.
Disclosure: I am part of Trade Nation's Influencer program and receive a monthly fee for using their TradingView charts in my analysis.

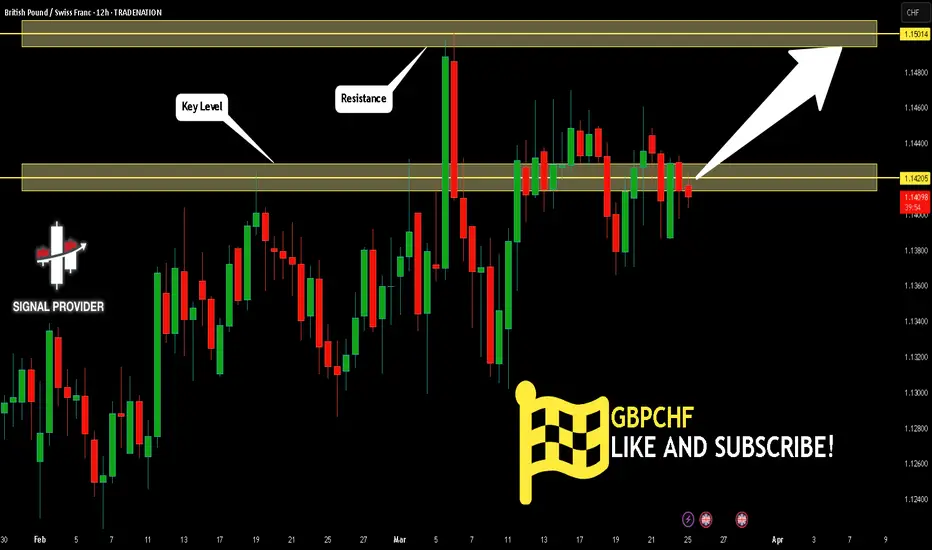
GBPCHF: Bears Will Push
Our strategy, polished by years of trial and error has helped us identify what seems to be a great trading opportunity and we are here to share it with you as the time is ripe for us to sell GBPCHF.
Disclosure: I am part of Trade Nation's Influencer program and receive a monthly fee for using their TradingView charts in my analysis.
❤️ Please, support our work with like & comment! ❤️

GBPCHF INTRADAY coiling energy build up supported at 1.1366The GBP/CHF currency pair shows a bullish sentiment, supported by the prevailing uptrend. Recent intraday price action indicates a bounce back from the rising trendline support zone.
Bullish Scenario:
The key trading level to watch is 1.1366, representing the previous consolidation range. A corrective pullback to this level, followed by a bullish bounce, would likely target upside resistance at 1.1470. Further bullish momentum could see prices reaching 1.1510 and 1.1570 over the longer timeframe.
Bearish Scenario:
On the other hand, a confirmed loss of the 1.1366 support level, accompanied by a daily close below this point, would invalidate the bullish outlook. This would pave the way for a deeper retracement toward 1.1300, with the next support level at 1.1240.
Conclusion:
The prevailing sentiment remains bullish as long as 1.1366 holds as support. Traders should monitor this level for potential bounce signals to confirm continued upside momentum. A decisive break below 1.1366 would signal a shift to a bearish outlook, targeting lower support zones.
This communication is for informational purposes only and should not be viewed as any form of recommendation as to a particular course of action or as investment advice. It is not intended as an offer or solicitation for the purchase or sale of any financial instrument or as an official confirmation of any transaction. Opinions, estimates and assumptions expressed herein are made as of the date of this communication and are subject to change without notice. This communication has been prepared based upon information, including market prices, data and other information, believed to be reliable; however, Trade Nation does not warrant its completeness or accuracy. All market prices and market data contained in or attached to this communication are indicative and subject to change without notice.

GBP_CHF LONG SIGNAL|
✅GBP_CHF is trading in an uptrend
Along the rising support line
Which makes me bullish biased
And the pair is about to retest the rising support
Thus, a rebound and a move up is expected
So we can enter a long trade with
The TP of 1.1410 and SL of 1.1350
LONG🚀
✅Like and subscribe to never miss a new idea!✅
Disclosure: I am part of Trade Nation's Influencer program and receive a monthly fee for using their TradingView charts in my analysis.

Bullish bounce off pullback support?GBP/CAD is reacting off the pivot and could potentially rise to the 61.8% Fibonacci resistance.
Pivot: 1.8373
1st Support: 1.8223
1st Resistance: 1.8532
Risk Warning:
Trading Forex and CFDs carries a high level of risk to your capital and you should only trade with money you can afford to lose. Trading Forex and CFDs may not be suitable for all investors, so please ensure that you fully understand the risks involved and seek independent advice if necessary.
Disclaimer:
The above opinions given constitute general market commentary, and do not constitute the opinion or advice of IC Markets or any form of personal or investment advice.
Any opinions, news, research, analyses, prices, other information, or links to third-party sites contained on this website are provided on an "as-is" basis, are intended only to be informative, is not an advice nor a recommendation, nor research, or a record of our trading prices, or an offer of, or solicitation for a transaction in any financial instrument and thus should not be treated as such. The information provided does not involve any specific investment objectives, financial situation and needs of any specific person who may receive it. Please be aware, that past performance is not a reliable indicator of future performance and/or results. Past Performance or Forward-looking scenarios based upon the reasonable beliefs of the third-party provider are not a guarantee of future performance. Actual results may differ materially from those anticipated in forward-looking or past performance statements. IC Markets makes no representation or warranty and assumes no liability as to the accuracy or completeness of the information provided, nor any loss arising from any investment based on a recommendation, forecast or any information supplied by any third-party.

Bullish bounce off pullback support?GBP/CAD has bounce of the support level which is a pullback support that lines up with the 38.2% Fibonacci retracement and could rise from this level to our take profit.
Entry: 1.8357
Why we like it:
There is a pullback support level that aligns with the 38.2% Fibonacci retracement.
Stop loss: 1.8234
Why we like it:
There is a pullback support level that lines up with the 50% Fibonacci retracement.
Take profit: 1.8512
Why we like it:
There is an overlap resistance level that lines up with the 38.2% Fibonacci retracement.
Enjoying your TradingView experience? Review us!
Please be advised that the information presented on TradingView is provided to Vantage (‘Vantage Global Limited’, ‘we’) by a third-party provider (‘Everest Fortune Group’). Please be reminded that you are solely responsible for the trading decisions on your account. There is a very high degree of risk involved in trading. Any information and/or content is intended entirely for research, educational and informational purposes only and does not constitute investment or consultation advice or investment strategy. The information is not tailored to the investment needs of any specific person and therefore does not involve a consideration of any of the investment objectives, financial situation or needs of any viewer that may receive it. Kindly also note that past performance is not a reliable indicator of future results. Actual results may differ materially from those anticipated in forward-looking or past performance statements. We assume no liability as to the accuracy or completeness of any of the information and/or content provided herein and the Company cannot be held responsible for any omission, mistake nor for any loss or damage including without limitation to any loss of profit which may arise from reliance on any information supplied by Everest Fortune Group.

GBPUSD Is due a correctionThe GBP/USD pair has been in a sustained uptrend for some time, and while I maintain a bullish outlook, a pullback or correction appears likely. Below, I’ve outlined key target levels where I anticipate potential price movements.
I’d love to hear your thoughts—let me know your perspective. If you found this analysis valuable, consider giving it a boost!

GBP/AUD Breakout (25.3.25)The GBP/AUD Pair on the M30 timeframe presents a Potential Selling Opportunity due to a recent Formation of a Trendline Breakout Pattern. This suggests a shift in momentum towards the downside in the coming hours.
Possible Short Trade:
Entry: Consider Entering A Short Position around Trendline Of The Pattern.
Target Levels:
1st Support – 2.0448
2nd Support – 2.0400
🎁 Please hit the like button and
🎁 Leave a comment to support for My Post !
Your likes and comments are incredibly motivating and will encourage me to share more analysis with you.
Best Regards, KABHI_TA_TRADING
Thank you.

EURGBP - BEARISH MOVEHello Traders !
On Tuesday 11 March, The EURGBP reached the resistance level (0.84480 - 0.84322).
The price broke the support level (0.83732 - 0.83840).
This key level becomes new resistance !
So, I predict a bearish move📉
____________
TARGET: 0.83080🎯

SHORT ON GBP/AUDGBP/AUD has the same setup as EUR/AUD from my post yesterday.
I am selling GBP/AUD for the same exact reasons.
Looking to catch 600 pips long term but over 200 pips easily this week!

EURGBP SELLTracking EUR/GBP on the 15-minute timeframe, we see a potential short opportunity from a key supply zone.
Key Zones & Setup:
🟣 Bearish Order Block (Supply Zone): 0.83800 - 0.83830
This area acted as strong resistance, where institutional traders likely positioned sell orders.
Expecting price to push into this zone before reversing lower.
Break of Structure (BOS) on lower timeframes (M5/M1) is needed for confirmation.
🔵 Target Area (Demand Zone): 0.83450
If the supply zone holds, price could drop toward this key demand level.
This zone aligns with previous BOS levels and price reactions.
Trade Plan:
📈 Waiting for price to push into the supply zone (0.83800 - 0.83830).
🔎 Looking for BOS on lower timeframes (M5/M1) before shorting.
✅ Entering a sell position upon confirmation.
🎯 Targeting the 0.83450 demand zone.
⚠️ Stop-loss above 0.83830 to manage risk.
Market Outlook:
If price fails to break structure, we avoid shorts and reassess.
This setup follows smart money concepts (SMC) with a focus on BOS and order blocks.
💬 What do you think? Are you seeing the same setup? 🚀🔥

GBPCHF Will Grow! Long!
Here is our detailed technical review for GBPCHF.
Time Frame: 12h
Current Trend: Bullish
Sentiment: Oversold (based on 7-period RSI)
Forecast: Bullish
The market is trading around a solid horizontal structure 1.142.
The above observations make me that the market will inevitably achieve 1.150 level.
P.S
We determine oversold/overbought condition with RSI indicator.
When it drops below 30 - the market is considered to be oversold.
When it bounces above 70 - the market is considered to be overbought.
Disclosure: I am part of Trade Nation's Influencer program and receive a monthly fee for using their TradingView charts in my analysis.
Like and subscribe and comment my ideas if you enjoy them!
Weekly Analysis for Week 13 2025!Hello fellow traders , my regular and new friends!
Did you managed to get some pips from EURUSD before the mid week reversal ?
Or did you catch some pips from EJ as well?
No? Missed out on it? No worries, check out my trading analysis for next week (week 13) to get some insights and tips for the potential moves in the Forex market!
Do Like and Boost if you have learnt something and enjoyed the content, thank you!
-- Get the right tools and an experienced Guide, you WILL navigate your way out of this "Dangerous Jungle"! --
*********************************************************************
Disclaimers:
The analysis shared through this channel are purely for educational and entertainment purposes only. They are by no means professional advice for individual/s to enter trades for investment or trading purposes.
*********************************************************************

Bearish drop?GBP/CAD is rising towards the pivot and could drop to the 1st support.
Pivot: 1.8518
1st Support: 1.8369
1st Resistance: 1.8635
Risk Warning:
Trading Forex and CFDs carries a high level of risk to your capital and you should only trade with money you can afford to lose. Trading Forex and CFDs may not be suitable for all investors, so please ensure that you fully understand the risks involved and seek independent advice if necessary.
Disclaimer:
The above opinions given constitute general market commentary, and do not constitute the opinion or advice of IC Markets or any form of personal or investment advice.
Any opinions, news, research, analyses, prices, other information, or links to third-party sites contained on this website are provided on an "as-is" basis, are intended only to be informative, is not an advice nor a recommendation, nor research, or a record of our trading prices, or an offer of, or solicitation for a transaction in any financial instrument and thus should not be treated as such. The information provided does not involve any specific investment objectives, financial situation and needs of any specific person who may receive it. Please be aware, that past performance is not a reliable indicator of future performance and/or results. Past Performance or Forward-looking scenarios based upon the reasonable beliefs of the third-party provider are not a guarantee of future performance. Actual results may differ materially from those anticipated in forward-looking or past performance statements. IC Markets makes no representation or warranty and assumes no liability as to the accuracy or completeness of the information provided, nor any loss arising from any investment based on a recommendation, forecast or any information supplied by any third-party.

Pedramfxtrader | GBPUSD BUY We have a specific type of divergence on the 1-hour timeframe ⏳, indicating a potential drop 📉 in the higher timeframe. On the other hand, the lower 15-minute timeframe 🕒 gives us a buying perspective 📈. So, the analysis will be as shown in the image.
#GBPUSD #ForexTrading #PriceAction #ForexSignals #TradingAnalysis 💹
GBPUSD - Chasing the Bulls!!Hello TradingView Family / Fellow Traders. This is Richard, also known as theSignalyst.
📈GBPUSD has been overall bullish trading within the rising channel marked in red.
Moreover, the blue zone is a major daily support.
🏹 Thus, the highlighted blue circle is a strong area to look for buy setups as it is the intersection of daily support zone and lower red trendline acting as a non-horizontal support.
📚 As per my trading style:
As #GBPUSD approaches the blue circle zone, I will be looking for bullish reversal setups (like a double bottom pattern, trendline break , and so on...)
📚 Always follow your trading plan regarding entry, risk management, and trade management.
Good luck!
All Strategies Are Good; If Managed Properly!
~Rich
Disclosure: I am part of Trade Nation's Influencer program and receive a monthly fee for using their TradingView charts in my analysis.

Bullish bounce?GBP/JPY is falling towards the pivot and could bounce to the 1st resistance.
Pivot: 191.16
1st Support: 189.22
1st Resistance: 194.56
Risk Warning:
Trading Forex and CFDs carries a high level of risk to your capital and you should only trade with money you can afford to lose. Trading Forex and CFDs may not be suitable for all investors, so please ensure that you fully understand the risks involved and seek independent advice if necessary.
Disclaimer:
The above opinions given constitute general market commentary, and do not constitute the opinion or advice of IC Markets or any form of personal or investment advice.
Any opinions, news, research, analyses, prices, other information, or links to third-party sites contained on this website are provided on an "as-is" basis, are intended only to be informative, is not an advice nor a recommendation, nor research, or a record of our trading prices, or an offer of, or solicitation for a transaction in any financial instrument and thus should not be treated as such. The information provided does not involve any specific investment objectives, financial situation and needs of any specific person who may receive it. Please be aware, that past performance is not a reliable indicator of future performance and/or results. Past Performance or Forward-looking scenarios based upon the reasonable beliefs of the third-party provider are not a guarantee of future performance. Actual results may differ materially from those anticipated in forward-looking or past performance statements. IC Markets makes no representation or warranty and assumes no liability as to the accuracy or completeness of the information provided, nor any loss arising from any investment based on a recommendation, forecast or any information supplied by any third-party.

GBPCHF Is Going Up! Buy!
Please, check our technical outlook for GBPCHF.
Time Frame: 1D
Current Trend: Bullish
Sentiment: Oversold (based on 7-period RSI)
Forecast: Bullish
The market is approaching a key horizontal level 1.140.
Considering the today's price action, probabilities will be high to see a movement to 1.151.
P.S
We determine oversold/overbought condition with RSI indicator.
When it drops below 30 - the market is considered to be oversold.
When it bounces above 70 - the market is considered to be overbought.
Disclosure: I am part of Trade Nation's Influencer program and receive a monthly fee for using their TradingView charts in my analysis.
Like and subscribe and comment my ideas if you enjoy them!

GBP/CHF BEARS ARE GAINING STRENGTH|SHORT
Hello, Friends!
Previous week’s green candle means that for us the GBP/CHF pair is in the uptrend. And the current movement leg was also up but the resistance line will be hit soon and upper BB band proximity will signal an overbought condition so we will go for a counter-trend short trade with the target being at 1.126.
Disclosure: I am part of Trade Nation's Influencer program and receive a monthly fee for using their TradingView charts in my analysis.
✅LIKE AND COMMENT MY IDEAS✅
