Gbp-jpy

GBPJPY LONG BIAS! (UPDATED!)Hello all!
Hope you are all well!
GJ is still very BULLISH, like projected in January, the pair bought from 157 area, and now i am looking for entries to take LONG positions until we hit 166.
I have marked my POI for you (LTF) where i will monitor 15min and 1h time frame and look to enter a LONG position.
Take care!

GBPJPY 16/02/2023Details on chart - looking for more buys ahead of a never ending weaker Yen compared to a stronger Pound

GBPJPY Potential for Bullish Rise towards overlap resistanceLooking at the H4 chart, my overall bias for GBPJPY is bullish due to the current price being above the Ichimoku cloud , indicating a bullish market. Looking for a pullback buy entry at 159.436, where the overlap support and 50% Fibonacci line is. Stop loss will be at 157.539, where the recent low is. Take profit will be at 164.350, where the overlap resistance and 61.8% Fibonacci line is.
Please be advised that the information presented on TradingView is provided to Vantage (‘Vantage Global Limited’, ‘we’) by a third-party provider (‘Everest Fortune Group’). Please be reminded that you are solely responsible for the trading decisions on your account. There is a very high degree of risk involved in trading. Any information and/or content is intended entirely for research, educational and informational purposes only and does not constitute investment or consultation advice or investment strategy. The information is not tailored to the investment needs of any specific person and therefore does not involve a consideration of any of the investment objectives, financial situation or needs of any viewer that may receive it. Kindly also note that past performance is not a reliable indicator of future results. Actual results may differ materially from those anticipated in forward-looking or past performance statements. We assume no liability as to the accuracy or completeness of any of the information and/or content provided herein and the Company cannot be held responsible for any omission, mistake nor for any loss or damage including without limitation to any loss of profit which may arise from reliance on any information supplied by Everest Fortune Group.

GBPJPY Potential for Bullish Rise | 16th February 2023Looking at the H4 chart, my overall bias for GBPJPY is bullish due to the current price being above the Ichimoku cloud , indicating a bullish market. Looking for a pullback buy entry at 159.715, where the overlap support and 50% Fibonacci line is. Stop loss will be at 157.539, where the recent low is. Take profit will be at 164.350, where the overlap resistance and 61.8% Fibonacci line is.
Any opinions, news, research, analyses, prices, other information, or links to third-party sites contained on this website are provided on an "as-is" basis, as general market commentary, and do not constitute investment advice. The market commentary has not been prepared in accordance with legal requirements designed to promote the independence of investment research, and it is therefore not subject to any prohibition on dealing ahead of dissemination. Although this commentary is not produced by an independent source, FXCM takes all sufficient steps to eliminate or prevent any conflicts of interest arising out of the production and dissemination of this communication. The employees of FXCM commit to acting in the clients' best interests and represent their views without misleading, deceiving, or otherwise impairing the clients' ability to make informed investment decisions. For more information about the FXCM's internal organizational and administrative arrangements for the prevention of conflicts, please refer to the Firms' Managing Conflicts Policy. Please ensure that you read and understand our Full Disclaimer and Liability provision concerning the foregoing Information, which can be accessed on the website.

Joe Gun2Head Trade - Short term top on GBPJPY?Trade Idea: Selling GBPJPY
Reasoning: Resistance on the daily. Small top on the 60min.
Entry Level: 161.15
Take Profit Level : 158.82
Stop Loss: 162.21
Risk/Reward: 2.2:1
Disclaimer – Signal Centre. Please be reminded – you alone are responsible for your trading – both gains and losses. There is a very high degree of risk involved in trading. The technical analysis , like all indicators, strategies, columns, articles and other features accessible on/though this site is for informational purposes only and should not be construed as investment advice by you. Your use of the technical analysis , as would also your use of all mentioned indicators, strategies, columns, articles and all other features, is entirely at your own risk and it is your sole responsibility to evaluate the accuracy, completeness and usefulness (including suitability) of the information. You should assess the risk of any trade with your financial adviser and make your own independent decision(s) regarding any tradable products which may be the subject matter of the technical analysis or any of the said indicators, strategies, columns, articles and all other features.


GBPJPY Potential for Bullish Rise | 15th February 2023Looking at the H4 chart, my overall bias for GBPJPY is bullish due to the current price being above the Ichimoku cloud , indicating a bullish market. Looking for a pullback buy entry at 161.712, where the overlap support is. Stop loss will be at 159.715, where the overlap support is. and 50% Fibonacci line is. Take profit will be at 164.350, where the overlap resistance and 61.8% Fibonacci line is.
Any opinions, news, research, analyses, prices, other information, or links to third-party sites contained on this website are provided on an "as-is" basis, as general market commentary, and do not constitute investment advice. The market commentary has not been prepared in accordance with legal requirements designed to promote the independence of investment research, and it is therefore not subject to any prohibition on dealing ahead of dissemination. Although this commentary is not produced by an independent source, FXCM takes all sufficient steps to eliminate or prevent any conflicts of interest arising out of the production and dissemination of this communication. The employees of FXCM commit to acting in the clients' best interests and represent their views without misleading, deceiving, or otherwise impairing the clients' ability to make informed investment decisions. For more information about the FXCM's internal organizational and administrative arrangements for the prevention of conflicts, please refer to the Firms' Managing Conflicts Policy. Please ensure that you read and understand our Full Disclaimer and Liability provision concerning the foregoing Information, which can be accessed on the website.

GBPJPY LONG BIAS! (UPDATED)Hello all!
Like Projected last week on GJ! Pair MITIGATED my POI shared from last time and moved up towards 166!
I will look to find a new entry for a LONG position when something presents on LTF! For now the Hourly trendline is super BULLISH..
So, safest option is waiting for a POI then monitoring it correctly before executing..
Take care!

GBPJPY - Video Top-Down Analysis!Hello TradingView Family / Fellow Traders. This is Richard, as known as theSignalyst.
Here is a detailed update top-down analysis for GBPJPY.
Which scenario do you think is more likely to happen? and Why?
Always follow your trading plan regarding entry, risk management, and trade management.
Good Luck!.
All Strategies Are Good; If Managed Properly!
~Rich

GbpJpy - Manipulation Point Trading Bias: Long
Market Cycle: 2
Yesterdays analysis has proven to be correct even if we didn't get a pullback and entry...
I'm looking for a pullback and entry from either 159.90 or 159.53 both KL's in terms of round number trading and valid manipulation points in our trading system.

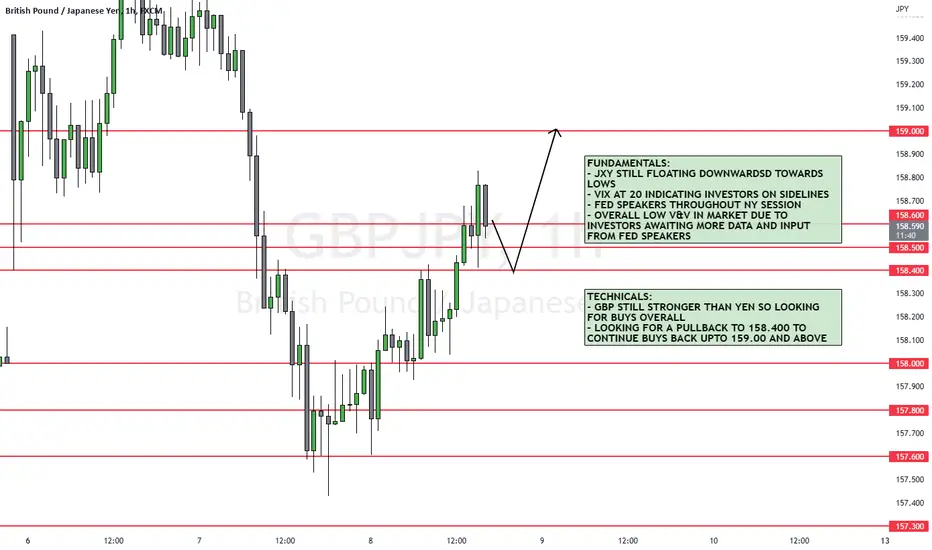
GBPJPY 14/02/2023Details on chart - looking for more buys ahead of a stronger Pound compared to the Yen

GBPJPY Potential for Bullish Rise towards overlap resistanceLooking at the H4 chart, my overall bias for GBPJPY is bullish due to the current price being above the Ichimoku cloud, indicating a bullish market. Looking for a pullback buy entry at 159.436, where the overlap support and 50% Fibonacci line is. Stop loss will be at 157.539, where the recent low is. Take profit will be at 164.350, where the overlap resistance and 61.8% Fibonacci line is.
Please be advised that the information presented on TradingView is provided to Vantage (‘Vantage Global Limited’, ‘we’) by a third-party provider (‘Everest Fortune Group’). Please be reminded that you are solely responsible for the trading decisions on your account. There is a very high degree of risk involved in trading. Any information and/or content is intended entirely for research, educational and informational purposes only and does not constitute investment or consultation advice or investment strategy. The information is not tailored to the investment needs of any specific person and therefore does not involve a consideration of any of the investment objectives, financial situation or needs of any viewer that may receive it. Kindly also note that past performance is not a reliable indicator of future results. Actual results may differ materially from those anticipated in forward-looking or past performance statements. We assume no liability as to the accuracy or completeness of any of the information and/or content provided herein and the Company cannot be held responsible for any omission, mistake nor for any loss or damage including without limitation to any loss of profit which may arise from reliance on any information supplied by Everest Fortune Group.

GBPJPY 13/02/2023Details on chart - looking for more buys ahead of a stronger Pound compared to the Yen

GBPJPY: This pair poised for a drop / BoJ Governor voteWe've seen recent strength from JPY in preparation for the announcement of a new Governor, with nominations expected in the next few days. The currency rose this past week when it was 'leaked' that Kazuo Ueda could become the next Governor, and this could lead to a change in monetary policy.
Anyone following me will note I'm weak on GBP and generally bullish on JPY in my ideas - I don't think BoE have room for hikes that can compete with other majors, BoJ do (and they seem to have managed their economy incredibly well post-pandemic).
BoJ certainly has room for manoeuvre, and I'm expecting strength from the yen this year. With inflation levels higher than target, interest rates low and potentially a new Governor that is no stranger to voting for monetary tightening when needed, the landscape is there for shorting the GBPJPY.
I think this pair is due a big drop, we may see the rise up to 164 to form a rising wedge, but my expectation is a fall before it reaches that point, and a big one at that.

GBPJPY 10/02/2023Details on chart - looking to see if a correction will occur after poor data for GBP, playing the HTF bullish bias

GBPJPY 09/02/2023Details on chart - looking for price to break out of range to continue overall bullish HTF bias

gbpjpy shorts while I can’t guarantee your success as a trader, I can guarantee that if you study and apply the mini-lessons below you will be in a much better position to succeed.

GBPJPY: Excellent sideways opportunityGBPJPY is bearish on the long term as it remains under the 1D MA50 (right chart) with technicals all in red (RSI = 41.765, MACD = -0.860, ADX = 25.857) despite trading within a range since the end of December.
This range is practically what we want right now as the sideways price action offers the best scalping opportunity for at least the next week. The price is approaching S1 where we will long to R1 and reverse to a short. Repeat until either the top of R1 and bottom of S1 break.
## If you like our free content follow our profile to get more daily ideas. ##
## Comments and likes are greatly appreciated. ##

GBPJPY LONG BIAS! (UPDATED!)Hello all!
GBPJPY Top-Down analysis recap..
I am BULLISH on GJ. Reason being is because pair is in low curve on HTF, and it broke the Monthly supply of 163 back in March. So, 184 is the next target for the near future.
On LTF, I am waiting for the POI (Marked in video) to mitigate, from there i will monitor 15 min TF and enter a LONG position!
Enjoy the video!
Take care :)


GBPJPY repricing taking placeGBPJPY has consolidated in the daily chart since the start of the year, following a steep decline in December. The price for GBPJPY keeps bouncing on the major area between 161.800 resistance and 156.300 support on the daily timeframe. There is also a minor consolidation between 161.800 and 160.600. This minor consolidation area is highlighted between the 50-EMA and 20-EMA periods.
Last week the break in the minor consolidation led to a downward move. A noticeable three-bearish candle pattern formed a three-black crow after the break of structure from the minor consolidation. This formation may signal a potential further move to the downside. However, before the week ended last week, the formation of minor support occurred at 157.300, following the pattern formation.
After the price created minor support at 157.300, the price recovered about half of its loss after the breakout at the minor consolidation area. It may tap at 160.600 or the 20-EMA period for a possible retest before a rejection happen. It is also worth noting that the weekly candle does not have a bottom wick which can be considered a Marubozu open. This type of candle could mean that the bulls are in control at the moment, and the price keeps moving without falling, which supports that we may have enough strength for a retest. On the other hand, some believe that a candle without a wick will eventually form one, either at the top or bottom. This could mean that after a retest, there is a possibility of a downward move to create a bottom wick. Historically, a candle closes without a wick is rarely seen in the forex market.
Since GBPJPY is technically in a consolidation period in general, it is hard to say that the current downtrend will continue. But the signal given by the three-black crow formation may hold if the price found itself breaking below this major daily consolidation area between 161.800 and 156.300.
In conclusion, GBPJPY has been consolidating between the price range of 161.800 to 156.300 since the start of the year. A recent minor consolidation between 161.800 and 160.600 was broken, leading to a downward move which created the three-black crow pattern. However, the creation of minor support at 157.300 allowed the price to recover half of its losses. A possible retest at 160.600 or the 20-EMA period is possible, but it is uncertain whether the downtrend will continue. The current trend and the signals given by the three-black crow formation will depend on whether the price breaks below the major daily consolidation area between 161.800 and 156.300.
