GBPUSD - Long from trendline !!Hello traders!
‼️ This is my perspective on GBPUSD.
Technical analysis: Here we are in a bullish market structure from daily timeframe perspective, so I look for a long. My point of interest is rejection from trendline + LZ around level 1.25000.
Like, comment and subscribe to be in touch with my content!
Gbpusdanalysis

GBPUSD - Analysis and Potential Setups (Intraday- 10.02.25)Overall Trend & Context:
The OANDA:GBPUSD pair is in an overall downtrend on the higher time frames and lower time frames are in alignment.
Technical Findings:
Price broke below all EMA's - is now consolidating below.
Keep an eye on LTF supply levels between 1.24635 - 1.24530 (within 4h supply).
Bullish price action appears inherently weaker against the bears.
Potential Scenarios:
For now I will only be considering shorts.
Trade is active at 1.24150.

GBPUSD Bullish Breakout!
HI,Traders !
GBP-USD made a bullish
Breakout of the key horizontal
Level of 1.24997 which is now
A support and as the breakout
Is confirmed we will be expecting
A further bullish move up !
Comment and subscribe to help us grow !

GBP/USD: Selling into the reboundThe setup is similar in EUR/USD & GBP/USD - because of the dollar in both major pairs!
The GBP price is testing the broken uptrend line on the weekly- and could break above it.
On the daily chart, a downtrend line has already broken and so has critical resistance at 1.25, suggesting a break above the weekly uptrend line
Should the breakout follow-through it faces resistance at 1.28 from the December high and 30 week (150 day) moving average.
However, should the breakout fail - it sets up a likely continuation of the longer term downtrend.

GBP/USD Rally: Is 1.28 the Next Target?In my post last week about GBP/USD, I mentioned that as long as the 1.23 support remained intact, the pair could rise toward the 1.26 resistance level and that buying dips below 1.24 could be a good strategy.
Indeed, the pair climbed to 1.26 on Friday, which raises the question—what’s next?
In my view, GBP/USD is likely to continue its ascent, with the next bullish target being the 1.28 resistance zone.
In conclusion, dips around the 1.25 support could present buying opportunities, with invalidation below 1.24 and a target at the 1.28 resistance level.
Disclosure: I am part of Trade Nation's Influencer program and receive a monthly fee for using their TradingView charts in my analyses and educational articles.

GBPUSD Weekly BiasI do anticipate that this price might continue with the bullish momentum, targeting buyside liquidity at 1.281. My optimum entry position will be at 1.2552 (with confirmation from a lower time frame)

GBPUSD is in the Buying Direction after Testing SupportHello Traders
In This Chart GBPUSD HOURLY Forex Forecast By FOREX PLANET
today GBPUSD analysis 👆
🟢This Chart includes_ (GBPUSD market update)
🟢What is The Next Opportunity on GBPUSD Market
🟢how to Enter to the Valid Entry With Assurance Profit
This CHART is For Trader's that Want to Improve Their Technical Analysis Skills and Their Trading By Understanding How To Analyze The Market Using Multiple Timeframes and Understanding The Bigger Picture on the Charts

GbpUsd could continue its reboundAfter breaking above the falling trendline from the end of January, GBP/USD has entered a consolidation phase between 1.23 and 1.25.
Recently, the pair tested the support zone once more and began to rebound.
In my opinion, the upward movement will continue, and we could see a test of the next resistance above 1.26.
In conclusion, I am looking to buy dips below 1.24, with invalidation occurring on a daily close below 1.23.
Disclosure: I am part of Trade Nation's Influencer program and receive a monthly fee for using their TradingView charts in my analysis.

GBP.USD Longs from 1.25600 back upI expect GBP/USD to continue its bullish momentum and push higher. Following the previous break of structure, I am looking for price to mitigate the 2-hour demand zone to maintain this upward trend. If price does not react from this level, I have also identified a 3-hour demand zone as a secondary point of interest.
If price reacts bullishly from either of these zones, my next selling opportunity will be at the refined 1-hour supply zone around 1.26600. Once price reaches this level, I will look for signs of distribution to confirm a potential short setup.
Confluences for GU Buys:
- For price to continue higher, it must mitigate a strong demand zone to gain momentum.
- Liquidity remains above, providing a natural target for price.
- The higher time frame trend is still bullish.
- Clean 2-hour, 3-hour, and 11-hour demand zones are in close proximity.
- DXY has been bearish, which aligns with this bullish GU outlook.
P.S. If price drops instead, I have an extreme discounted zone marked at the 11-hour demand zone at the bottom as a potential long entry.

GBPUSD AnalysisGBPUSD Analysis
The GBP/USD pair has been in a predominantly bearish trend since September of last year, although there have been occasional corrective rallies. Despite these minor pullbacks, the overall direction of the pair has remained downward over the period.
However, I believe that the bearish trend may have concluded. The pair has recently broken through a key structural resistance level, and the candle has closed decisively above this barrier, which is a strong indication of a potential shift in momentum. This breakout suggests a bullish setup could be forming, signaling a possible reversal in the pair's trajectory.
It is important to note that this is my personal analysis and should not be interpreted as financial advice or a trading signal. If you would like to explore my reasoning further, feel free to engage in the comments section, and I would welcome your thoughts on whether the pair is now poised for a bullish move or if the bearish trend may persist.
As always, thorough research and careful risk management are essential before making any trading decisions. Let me know what your perspective is—bullish or bearish—for this pair moving forward.

GBPUSD is in the Buying Direction after Testing SupportHello Traders
In This Chart GBPUSD HOURLY Forex Forecast By FOREX PLANET
today GBPUSD analysis 👆
🟢This Chart includes_ (GBPUSD market update)
🟢What is The Next Opportunity on GBPUSD Market
🟢how to Enter to the Valid Entry With Assurance Profit
This CHART is For Trader's that Want to Improve Their Technical Analysis Skills and Their Trading By Understanding How To Analyze The Market Using Multiple Timeframes and Understanding The Bigger Picture on the Charts

DeGRAM | GBPUSD testing of the channelGBPUSD is under an ascending channel between the trend lines.
The price has reached the lower boundary of the channel and 62% retracement level.
Indicators on small timeframes indicate oversold.
We expect the growth to continue after the retest of the channel boundary is completed with a potential reaching of dynamic support.
-------------------
Share your opinion in the comments and support the idea with a like. Thanks for your support!

GBPUSD DAILY ANALYSIS 14/02/25GBPUSD has been dancing around a key resistance zone of 1.25500, A daily bullish confirmation breakout has just occured, i see price buying strongly to the next level resistance of 1.28100.

GBPUSD resistance retest after upbeat UK GDP dataThe GBPUSD currency pair price action sentiment appears bearish, supported by the longer-term prevailing downtrend. This morning, the GBPUSD currency pair spiked higher towards 1.2500 resistance level. This was a reaction to the upbeat UK GDP data, which showed that the economy expanded at an annual rate of 1.4% in Q4, surpassing the market expectation of 1.1%.
The key trading level is at 1.2550, which is the 25th February swing high. An oversold rally from the current levels and a bearish rejection from the 1.2550 level could target the downside support at 1.2400 followed by 1.2330 and 1.2250 levels over the longer timeframe.
Alternatively, a confirmed breakout above 1.2550 resistance and a daily close above that level would negate the bearish outlook opening the way for further rallies higher and a retest of 1.2600 resistance level followed by 1.2650 and 1.2700.
This communication is for informational purposes only and should not be viewed as any form of recommendation as to a particular course of action or as investment advice. It is not intended as an offer or solicitation for the purchase or sale of any financial instrument or as an official confirmation of any transaction. Opinions, estimates and assumptions expressed herein are made as of the date of this communication and are subject to change without notice. This communication has been prepared based upon information, including market prices, data and other information, believed to be reliable; however, Trade Nation does not warrant its completeness or accuracy. All market prices and market data contained in or attached to this communication are indicative and subject to change without notice.

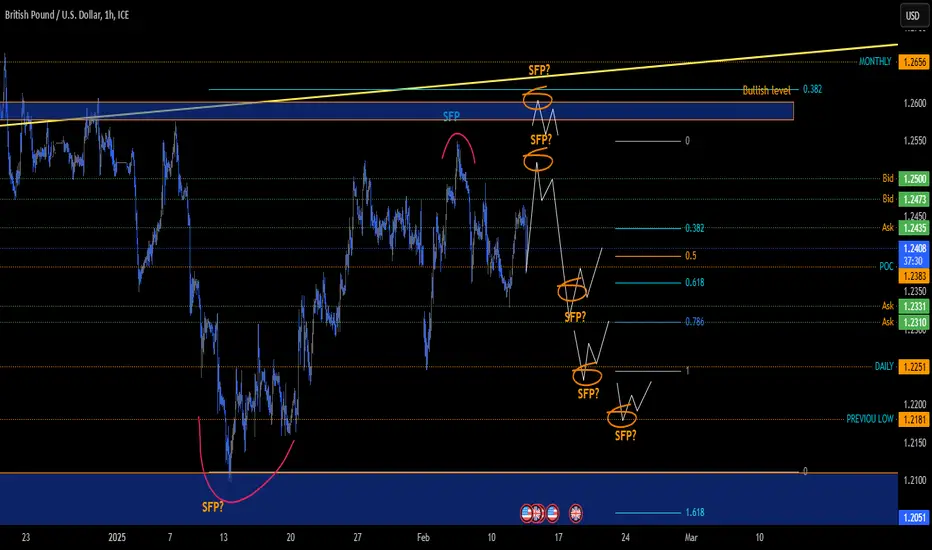
Scenario on GBPUSD 12.2.2025I see the GBPUSD market so that if I were to look for a short, the first one I like is the level for a possible sfp around the price of 1.2520, if the market were to break through the price level, then the next sfp could come into consideration around the resistance of 1.26-1.258, which is also a bulls zone, if I am to take long positions into account, the first one could come at the sfp at the level of 1.231 and the next up to the daily level 1.2251
Market Analysis: GBP/USD RecoversMarket Analysis: GBP/USD Recovers
GBP/USD started a fresh increase above the 1.2400 zone.
Important Takeaways for GBP/USD Analysis Today
- The British Pound is eyeing more gains above the 1.2465 resistance.
- There was a break above a key bearish trend line with resistance at 1.2390 on the hourly chart of GBP/USD at FXOpen.
GBP/USD Technical Analysis
On the hourly chart of GBP/USD at FXOpen, the pair formed a base above the 1.2330 level. The British Pound started a steady increase above the 1.2360 resistance zone against the US Dollar, as discussed in the previous analysis.
There was a break above a key bearish trend line with resistance at 1.2390. The pair surpassed the 50% Fib retracement level of the downward move from the 1.2549 swing high to the 1.2332 low.
The pair gained strength above the 1.2420 level and the 50-hour simple moving average. The pair tested the 1.2460 zone and is currently consolidating gains. The bulls are now active near the 1.2440 level. If there is another decline, the pair could find support near the 1.2395 level.
The first major support sits near the 1.2365 zone. The next major support is 1.2330. If there is a break below 1.2330, the pair could extend the decline. The next key support is near the 1.2250 level. Any more losses might call for a test of the 1.2150 support.
Conversely, the bulls might aim for more gains. The RSI moved above the 60 level on the GBP/USD chart and the pair is now approaching a major hurdle at 1.2465 and the 61.8% Fib retracement level of the downward move from the 1.2549 swing high to the 1.2332 low.
An upside break above the 1.2465 zone could send the pair toward 1.2500. Any more gains might open the doors for a test of 1.2550.
Trade on TradingView with FXOpen. Consider opening an account and access over 700 markets with tight spreads from 0.0 pips and low commissions from $1.50 per lot.
This article represents the opinion of the Companies operating under the FXOpen brand only. It is not to be construed as an offer, solicitation, or recommendation with respect to products and services provided by the Companies operating under the FXOpen brand, nor is it to be considered financial advice.

GBPUSD oversold bouncebacks capped by 1.2500 levelThe GBPUSD currency pair price action sentiment appears bearish, supported by the longer-term prevailing downtrend.
The key trading level is at 1.2500, which is the 25th February swing high. An oversold rally from the current levels and a bearish rejection from the 1.2500 level could target the downside support at 1.2250 followed by 1.2170 and 1.2100 levels over the longer timeframe.
Alternatively, a confirmed breakout above the 1.2500 resistance and a daily close above that level could trigger further rallies higher and a retest of the 1.2550 resistance level followed by 1.2600 and 1.2700.
This communication is for informational purposes only and should not be viewed as any form of recommendation as to a particular course of action or as investment advice. It is not intended as an offer or solicitation for the purchase or sale of any financial instrument or as an official confirmation of any transaction. Opinions, estimates and assumptions expressed herein are made as of the date of this communication and are subject to change without notice. This communication has been prepared based upon information, including market prices, data and other information, believed to be reliable; however, Trade Nation does not warrant its completeness or accuracy. All market prices and market data contained in or attached to this communication are indicative and subject to change without notice.

GbpUsd Long BiasMy first GU insight of the week.
I'm looking to buy from 1.23471 because it aligns with my potential buy model.
Although the bullish open and close level 1.23533 looks more enticing I won't be surprised if price reacts from there.
Please boost if you find it insightful so others can see it too 🫴

GBPUSD is in the Selling Direction after breaking SupportHello Traders
In This Chart GBPUSD HOURLY Forex Forecast By FOREX PLANET
today GBPUSD analysis 👆
🟢This Chart includes_ (GBPUSD market update)
🟢What is The Next Opportunity on GBPUSD Market
🟢how to Enter to the Valid Entry With Assurance Profit
This CHART is For Trader's that Want to Improve Their Technical Analysis Skills and Their Trading By Understanding How To Analyze The Market Using Multiple Timeframes and Understanding The Bigger Picture on the Charts

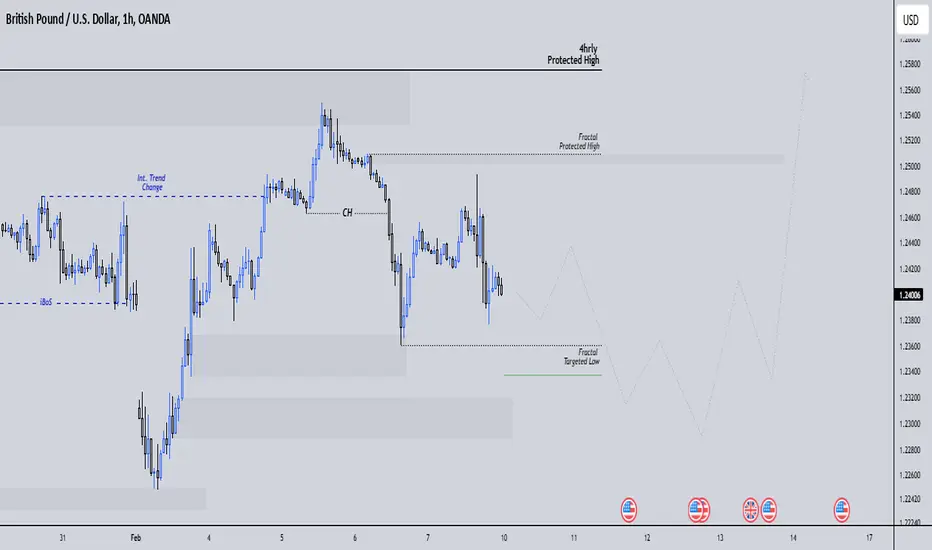
GBPUSD Selling Opportunities Daily Swing Structure = Bullish
Daily INternal Structure = Bearish.
Narrative Based on Internal Structure.
We are Pro-trend.
But, we are coming from a strong demand zone.
From a daily perspective, GBPUsd is really not that clear.
It is possible that the demand zone could SPONSOR a move that breaks the Swing Protected High.
In short, this demand zone could be the genesis of phase C moves.
_______________________________________
4HRS
Swing structure = Bearish
Internal Structure = Bullish
We know that internal structure was bullish to facilitate the swing pullback.
We also know that internal trend changed from bullish to bearish hich signaled to us that the pullback phase was over.
The moment internal trend changed from bullish to bearish, the demand zones left behind were now reaction points.
However, Price tapped into demand zone created on Jan 21, and immediate reversed breaking internal change and causing an internal trend change from bearish to bullish.
We know that after every break of structure (iBoS, CHoCH or BoS) we should expect a pullback from the reaction points.
The moment internal trend changed from bearish to bullish, every demand zone left behind (STB Zones, Orderblocks Breakers etc etc) becomes reaction points.
That brings us to where we are.
The orderflow that we should follow is the fractal orderflow that we continue selling the currency until the fractal market structure changes from bearish to bulllish.
The moment fractal structure switches, that signals to us that the internal pullback is over.
GBPUSD Buy 15Min chart!Hey Guys,
To keep it short, based on the analysis, a previous bearish trend line breaks and it would be possible to see an uptrend (for 15min chart) on the market.
This idea will be updated based on market movement.
Good Luck!
(Sorry about late publish, Preparing post content took sometime)😊

GbpUsdI found this Leve very interesting 🤔 couple with the fact that I have a Bias for short on GbpChf it seems appropriate.
Check my other insights on my page.
Boost if you find this insightful 🫴

GBPUSD H4 | FOREX BEELooking at the GBP/USD H4 chart, I can identify the following key observations:
1. Trendline Resistance: The market is currently testing or approaching a key descending trendline, indicating potential resistance at higher levels.
2. Fibonacci Levels: The chart highlights the 0.5 Fibonacci retracement level near 1.2415, suggesting a possible bullish target zone if price breaks above the trendline resistance.
3. Support Zones: The red zones below, particularly near 1.2251 (0.236 Fibonacci), appear to act as important support levels where buying interest may reappear.
4. Market Scenario:
- If the price breaks above the trendline and sustains, it may move towards the next resistance at 1.2415 or higher.
- On the downside, a failure at the current level could push the market back to the support zones around 1.2250 or lower.
This setup suggests a cautious approach for now. A breakout confirmation above the descending trendline would provide a clearer signal for bullish continuation. Conversely, failure to break higher may lead to renewed bearish pressure.
