GBPUSD LONG ReboundGBPUSD Rebound towards the 1h orderblock ( 86% fibbonacci level ) and after sell until the 38% fibbonacci level on daily timeframe.
Gbpusdanalysis

GBP/USD: Struggles at Resistance, Risks of Weak Oscillation PersDuring the European session on Tuesday, GBP/USD held steady above 1.29000. However, the technical outlook maintained a bearish bias. The US dollar strengthened due to upbeat data, suppressing the rebound of the British pound. The exchange rate faced resistance at key resistance levels when attempting to rise.
If it fails to break through these resistance levels, in the short term, it may continue the weak, oscillatory downward trend, and the downside risks still remain. The market lacks strong momentum, and overall, it stays in a weak, oscillatory pattern.
GBPUSD
sell@1.29600-1.29900
tp:1.28800
I will share trading signals every day. All the signals have been accurate for a whole month in a row. If you also need them, please click on the link below the article to obtain them.

GBP/USD Breakdown – Support Under Pressure, Bearish Target AheadChart Analysis:
The GBP/USD pair is currently trading around 1.29578, facing resistance near 1.30366.
A support zone has been identified around 1.29000, which the price is testing.
If this support level breaks, we could see a bearish move toward the next target near 1.26970.
Strong support is positioned lower, which may act as a key reversal point if the decline continues.
Trading Outlook:
Bearish Scenario: If the price breaks below the current support, a drop toward 1.26970 seems likely.
Bullish Scenario: If GBP/USD holds above support, we may see a retest of resistance at 1.30366.
Conclusion:
Traders should watch for a confirmed breakout or rejection at support before taking positions. A clean break below could trigger a stronger bearish move. 🚨

GBPUSD SHORT Until the next 1h orderblockGBPUSD Short until the next 1h orderblock. We have Bearish divergence on MACD.

CAD JPY Trade Setup 1 hour timeframe CAD JPY Trade Setup 1 hour timeframe
Following last week's trade setup CAD JPY is moving in an uptrend making Higher Highs and Higher Lows, so we will keep looking for Buying opportunities.
CAD JPY is forming a bullish break and retest continuation pattern that also align with the 0.618-0.50 Fib Retracement level.
Lets wait for the price to pull back to the retest level then enter base off candlestick confirmation

EURUSD: ShortThis is a relatively standard double top pattern. The possibility of a decline after a small rebound is higher, so shorting is recommended.

GBPUSD Trending Lower - Will It Drop To 1.28660?OANDA:GBPUSD is currently trading within a descending channel, indicating a strong bearish trend. The price has recently tested a resistance zone within the channel and appears to be rejecting it, suggesting a potential continuation to the downside.
The current market structure implies that if this rejection holds, we could see further bearish movement toward the 1.28660 level, which aligns with the lower boundary of the channel. However, if the price manages to push above the channel with strong momentum, it could signal a shift in trend, potentially leading to a bullish breakout and a move toward higher resistance levels.
Traders should look for confirmation signals such as rejection wicks, bearish engulfing candles, or increased selling volume before entering short positions.
If you agree with this analysis or have additional insights, feel free to share your thoughts!

GBP/USD Breaks Rising Channel – Bearish Target Ahead!Key Observations:
Rising Channel: The price was trading within an ascending channel, bouncing between resistance and support.
Breakout & Sell Signal: The price has broken below the channel support, indicating a potential trend reversal.
Bearish Target: The next key support level is around 1.27024, aligning with a previous demand zone.
Confirmation: If the price stays below 1.29165, further downside movement is likely.
Trading Idea:
Short Entry: After confirmation of a breakdown below support.
Target: 1.27024 (next major support level).
Stop Loss: Above 1.30127 (previous resistance).
This setup suggests bearish momentum as long as the price remains below the broken support. Traders should watch for retests and volume confirmation.

GBP/USD Analysis: Pair Fails to Hold Above Psychological LevelGBP/USD Analysis: Pair Fails to Hold Above Psychological Level
As shown in today’s GBP/USD chart, the pair failed to maintain its position above the psychological level of 1.3000 USD per pound, where it had reached its highest point since early 2025. The decline followed recent central bank decisions and statements, with both the Bank of England and the Federal Reserve keeping interest rates unchanged.
On one side, the Bank of England:
→ Warned of inflation risks, partly driven by external factors such as US trade tariffs.
→ Indicated a potential rate cut in the coming months.
On the other hand, the US dollar strengthened on Thursday after the Federal Reserve signalled reluctance to rush further rate cuts this year, despite uncertainties surrounding US tariffs.
These statements highlighted the challenges market participants face in assessing the risks posed by tariffs on global trade.
Technical Analysis of GBP/USD
In March, the pound followed an upward trend against the US dollar, forming an ascending channel (marked in blue). However, once the price moved above the key 1.3000 level, the upper boundary of the channel appeared out of reach—possibly signalling weakening buying momentum.
As a result, the price broke below the lower boundary of the channel, which has now shown signs of resistance (indicated by an arrow). If bearish pressure persists, the price could fall towards the dotted trendline below the channel, at a distance equal to its height. Additionally, a test of the previous local low around 1.2911 cannot be ruled out.
This article represents the opinion of the Companies operating under the FXOpen brand only. It is not to be construed as an offer, solicitation, or recommendation with respect to products and services provided by the Companies operating under the FXOpen brand, nor is it to be considered financial advice.
GBPUSD SELLJust a quick trade—I'll update afterward. Follow for simple and effective trades faster!
1RR

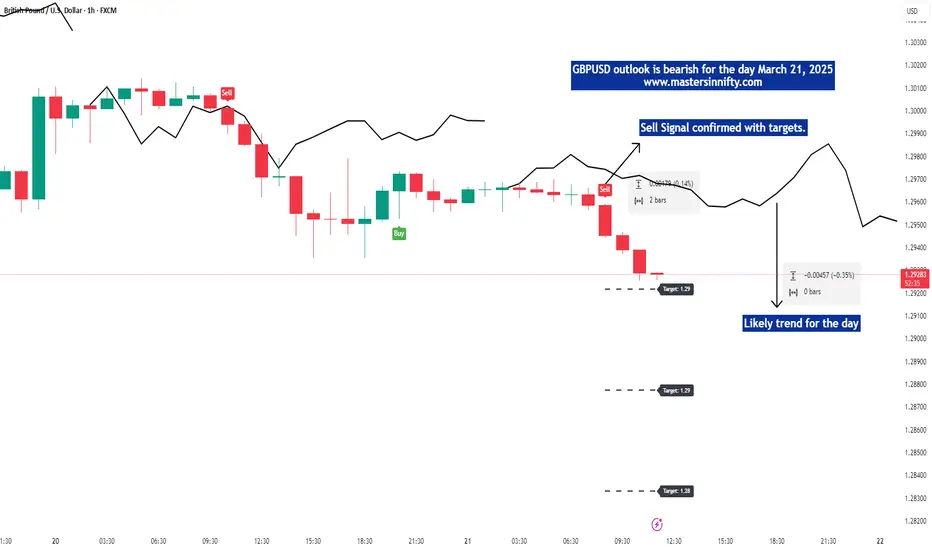
GBPUSD view for the day March 21, 2025According to my analysis the trend for GBPUSD looks bearish. Bearish targets are given for the day. Trade with Stop loss.
GBPUSD(20250321)Today's AnalysisToday's buy and sell boundaries: 1.2972
Support and resistance levels:
1.3050
1.3021
1.3002
1.2943
1.2924
1.2895
Trading strategy:
If the price breaks through 1.2972, consider buying, the first target price is 1.3002
If the price breaks through 1.2943, consider selling, the first target price is 1.2924

GBPUSD Trade IdeaGBPUSD is showing bullish momentum. In this video, we explore a trade idea that involves a retracement to the 50% equilibrium level of the previous price swing. This is not financial advice.

GBP/USD – Potential Pullback from ResistanceChart Overview:
The 4-hour GBP/USD chart shows a strong uptrend contained within a rising channel.
The price has recently reached the upper boundary of the channel and is showing signs of rejection, indicating a possible pullback.
A downside move towards 1.27736 is anticipated, which aligns with a key support level.
Technical Outlook:
If the price respects the resistance zone, a retracement toward the 1.27736 target could be expected.
A confirmed break below this level could open the door for further downside.
However, if bullish momentum resumes, the price may attempt to break above the 1.3000 psychological level.
Trading Plan:
Short-term traders may look for selling opportunities targeting 1.27736.
Long-term traders may wait for a bullish reaction at support for potential continuation of the uptrend.
Key Levels:
Current Price: 1.29574
Support Target: 1.27736
Resistance: 1.3000
Would you like to add further details or modify the description

GBP/USD Bullish Channel – Buy Opportunity! Overview:
The British Pound (GBP) against the US Dollar (USD) is currently trading within an ascending channel on the 4-hour timeframe. The price is approaching a key buy zone at the lower trendline, presenting a potential long opportunity if bullish momentum continues.
Key Market Structure Analysis:
🔹 Uptrend in Progress: GBP/USD has been forming higher highs and higher lows inside a well-defined rising channel.
🔹 Support Zone: A potential buy entry is around 1.2925, aligning with the lower boundary of the channel.
🔹 Target Projection: If the price bounces from support, the next key resistance target is 1.3085.
Potential Trade Setup:
✅ Bullish Scenario:
A retest and bounce from 1.2925 could trigger a buy setup.
Upside target:
🎯 1.3085 – Key resistance level within the channel.
⚠️ Bearish Scenario (Invalidation):
A break below 1.2925 could invalidate the bullish setup and signal a deeper retracement.
Below the channel support, price might target the 1.2600 region as the next demand zone.
Final Thoughts:
GBP/USD remains in a strong uptrend, with the lower channel support acting as a key decision point. If bulls defend this level, we could see further upside momentum. However, a breakdown of the structure could shift the sentiment.
Will GBP/USD continue its bullish momentum? Share your thoughts below!

GBPUSD BUYSTrading is an art for economists. This is one of the best setups I have sent ever. In this scenario, price should drop to the support area around 1,2964. From here we should see price grow back up to 1,302
GBP/USD Intraday Market Analysis: Potential Upside ReversalThe GBP/USD 15-minute chart suggests a possible bullish reversal following a period of consolidation near the 200-period moving average. Price action formed multiple rejection wicks at a key support level, indicating buying interest. A bullish engulfing candle has emerged, confirming a potential shift in momentum.
The risk-to-reward setup highlights a long position, with stop-loss protection just below the recent lows and a target towards previous liquidity zones. The stochastic-based momentum indicator shows a crossover in oversold territory, further supporting potential upside movement.
If price sustains above the 200 EMA and breaks through immediate resistance, further bullish continuation is likely. However, failure to hold above the entry level could invalidate the setup, leading to further downside pressure.

GBPUSDHello friends
Given the channel breakdown and the good price growth, we can now buy in the support areas during the pullbacks that the price makes, of course with capital and risk management...
*Trade safely with us*

GBPUSD SELL RSI oveerboughtGBPUSD Sell until 8 EMA on daily timeframe, moreover, the RSI is overbought.

GBPUSD is in the Selling DirectionHello Traders
In This Chart GBPUSD HOURLY Forex Forecast By FOREX PLANET
today GBPUSD analysis 👆
🟢This Chart includes_ (GBPUSD market update)
🟢What is The Next Opportunity on GBPUSD Market
🟢how to Enter to the Valid Entry With Assurance Profit
This CHART is For Trader's that Want to Improve Their Technical Analysis Skills and Their Trading By Understanding How To Analyze The Market Using Multiple Timeframes and Understanding The Bigger Picture on the Charts

GbpUsd is approaching a strong sell zoneExactly one week ago, I pointed out that while TRADENATION:GBPUSD strength persists, the pair is approaching a significant sell zone , starting at the psychological level of 1.30.
This level was touched recently, and the pair is currently fluctuating within this range now.
My view remains the same: GBP/USD is likely to experience a drop in the near future, and I’m now looking for potential entries for a swing trade.
As mentioned before, 1.30 is a key psychological level, with the technical resistance just above it at 1.3050. Additionally, GBP/USD is known for its volatility, and this resistance zone extends slightly above 1.31.
In conclusion, traders should consider selling rallies, with a target around 1.27, aiming for at least a 1:2 risk-to-reward ratio when setting their stop loss.
Disclosure: I am part of Trade Nation's Influencer program and receive a monthly fee for using their TradingView charts in my analyses and educational articles.

GBP/USD Market Outlook & Analysis (Bullish)**GBP/USD Market Outlook & Analysis**
**📊 Price Action & Key Levels**
- **GBP/USD trades around 1.29300** in a narrow range, struggling for momentum.
- Last week’s **high of 1.29900** remains a key resistance level.
- **Key Support Levels:**
- **1.29000 (Psychological level)** → A breakdown may trigger more downside.
- **1.2850 (Next key support)** → Watch for buying interest.
- **Key Resistance Levels:**
- **1.2990 (Last week's peak)** → A breakout could open doors for **1.3050+.**
**🌍 Fundamental Drivers**
- **USD Weakness:**
- Fears that **Trump’s tariffs could slow the US economy** weigh on the dollar.
- Weak US inflation and a **cooling labor market** increase **rate cut expectations** for 2024.
- University of Michigan’s **Consumer Sentiment Index fell** to a 2.5-year low, fueling bearish sentiment.
- **GBP Struggles Despite BoE Expectations:**
- **UK GDP contracted by 0.1% in January**, capping the pound’s upside.
- However, **expectations that the BoE will cut rates more slowly than the Fed** provide support for GBP/USD.
**📅 Key Events to Watch**
- **Monday:** US **Retail Sales & Empire State Manufacturing Index**.
- **Wednesday:** **FOMC meeting** → Market expects no rate change but will closely watch guidance.
- **Thursday:** **BoE meeting** → If policymakers signal slower rate cuts, GBP could strengthen.
**📈 Trading Strategy & Takeaways**
- **Bullish bias above 1.29300** if the dollar remains under pressure.
- **Break above 1.29400** could see GBP/USD testing **1.3050** in the short term.
- **If 1.29000 breaks,** watch for a potential dip toward **1.28500** before buyers step in.
- **Major volatility expected midweek** with FOMC & BoE—trade cautiously!
📢 **Final Word:** GBP/USD remains in a tug-of-war between a weak USD and soft UK data. Stay patient and wait for confirmation before making moves! 💹🔥 #Forex #GBPUSD

GBP/USD - 4H Chart Analysis & Trade Setup
Market Overview:
GBP/USD has been in an uptrend, forming a rising channel structure.
The price is now testing a resistance zone, potentially indicating a reversal.
Technical Analysis:
Trend: Bullish (but approaching key resistance)
Resistance Level: 1.29720 - 1.30000 (Highlighted Zone)
Support Level: 1.24906 (Potential target)
Stop Loss: 1.30970 (Above resistance)
Pattern: Rising Channel Breakout Setup
Trade Idea (Short Setup):
🔴 Sell Entry: Near 1.29720 (Resistance rejection confirmation)
✅ Target: 1.24906 (Major support zone)
⛔ Stop Loss: 1.30970 (Above resistance to avoid fakeouts)
Conclusion:
GBP/USD is testing key resistance and may face bearish rejection.
A break below the channel confirms bearish momentum towards 1.24906.
Traders may consider short positions with a defined risk-reward setup.
📉 Bearish bias unless price breaks above resistance.
