GBPUSD(20250430)Today's AnalysisMarket news:
The European Central Bank expects prices to rise 2.9% over the next 12 months, up from 2.6% in February, according to a monthly survey released on Tuesday. This is the highest level since April 2024. The three-year indicator rose slightly to 2.5%. The ECB's first five-year forecast was 2.1%.
Technical analysis:
Today's buying and selling boundaries:
1.3409
Support and resistance levels:
1.3471
1.3448
1.3433
1.3385
1.3370
1.3347
Trading strategy:
If the price breaks through 1.3409, consider buying, the first target price is 1.3433
If the price breaks through 1.3385, consider selling, the first target price is 1.3370
Gbpusdshort

GBPUSD SHORT FORECAST Q2 W18 D30 Y25GBPUSD SHORT FORECAST Q2 W18 D30 Y25
Professional Risk Managers👋
Welcome back to another FRGNT chart update📈
Diving into some Forex setups using predominantly higher time frame order blocks alongside confirmation breaks of structure.
Let’s see what price action is telling us today!
💡Here are some trade confluences📝
✅Weekly order block rejection
✅Daily order block rejection
✅Daily high rejection
✅Daily imbalance fill targets
🔑 Remember, to participate in trading comes always with a degree of risk, therefore as professional risk managers it remains vital that we stick to our risk management plan as well as our trading strategies.
📈The rest, we leave to the balance of probabilities.
💡Fail to plan. Plan to fail.
🏆It has always been that simple.
❤️Good luck with your trading journey, I shall see you at the very top.
🎯Trade consistent, FRGNT X

GBPUSD SELL/SHORTBy utilizing levels, historical patterns, , we can formulate a hypothesis that the market might follow a similar trajectory if bearish sentiment prevails.

GBP/USD Opening Trends and Trading Strategies Next WeekTrend Analysis
Examining the 4 - hour chart of GBP/USD, the pair is distinctly navigating an upward trend. A series of successive higher highs and higher lows have been established, serving as a robust testament to the dominant strength of the bulls 🐂. This upward momentum indicates that the bulls are firmly in the driver's seat, consistently pushing the price higher and maintaining control over the market sentiment.
Key Levels
Support Area
The 1.3200 - 1.3240 range emerges as a crucial support zone on the chart. Historical price action reveals multiple instances where the price has found strong support in this area, bouncing back with resilience each time it approached. This repeated pattern underscores the presence of substantial buying pressure, as market participants actively step in to defend this price level. Should the price retrace towards this support zone again, it could potentially present a lucrative opportunity for traders to initiate long positions 💰.
Target Area
The 1.3420 mark has been identified as a significant target level. In the event that the price successfully breaks free from its current consolidation phase and continues its upward trajectory, there is a strong expectation that it will advance towards this target price. This level represents a potential milestone for the bullish rally, and reaching it would further validate the strength of the upward trend 🎯.
Trading Strategy
Long - position Strategy
For traders looking to capitalize on the bullish trend, a well - timed entry point could present itself when the price retraces to the 1.3200 - 1.3240 support area. Once there, the appearance of a bullish candlestick pattern, such as a hammer or an engulfing pattern, can serve as a signal to consider entering a long position. To manage risk effectively, it is advisable to set the stop - loss just below the support area, protecting against any unexpected downward movements. With the 1.3420 target area in sight, traders can aim for a profitable trade as the price moves in the anticipated upward direction 📈.
⚡⚡⚡ GBPUSD ⚡⚡⚡
🚀 Buy@1.32000 - 1.32400
🚀 TP 1.33500 - 1.34000
Accurate signals are updated every day 📈 If you encounter any problems during trading, these signals can serve as your reliable guide 🧭 Feel free to refer to them! I sincerely hope they'll be of great help to you 🌟

GBPUSD Sell and Buy Trading PlanH4 - We have a clean bullish trend with the price creating a series of higher highs, higher lows structure
This strong bullish move ended with a bearish divergence
While measuring this strong bullish move using the Fibonacci retracement tool we have two key support zones that has formed (marked in green)
So based on this I expect short term bearish moves now towards the Fibonacci support zones and then continuation higher.
If you enjoy this idea, don’t forget to LIKE 👍, FOLLOW ✅, SHARE 🙌, and COMMENT ✍! Drop your thoughts and charts below to keep the discussion going. Your support helps keep this content free and reach more people! 🚀
--------------------------------------------------------------------------------------------------------------------
Disclosure: I am part of Trade Nation's Influencer program and receive a monthly fee for using their TradingView charts in my analysis.

Potential sell of GBPUSDGBPUSD is currently at a 50% fib retracement area. If it breaks a short term low, it could move to the down-side. News are coming in an hour though so anything could happen. Need more confirmation to enter (a few wicks and a break of a STL).

GBPUSD trade setup.This chart shows a GBP/USD (British Pound / U.S. Dollar) trading setup on the 1-hour timeframe, with a bearish outlook.
📊 Chart Analysis
Trend: Recently bearish after a previous uptrend.
Entry Zone: Area between approximately 1.33233 and 1.33317.
Setup Type: Sell/Short Trade Setup
🔍 Key Zones
Entry Zone (Supply/Resistance Area):
Marked as "entry zone".
This is the expected area where price might retrace to before dropping again.
Target Zone:
Arrow points down towards 1.32377, suggesting this is the Take Profit (TP) level.
Stop Loss (SL):
Slightly above the entry zone, near 1.33476, indicating risk management in case price continues upward.
🧠 Trade Idea Summary
Type: Short/Sell
Entry: Wait for price to re-enter the marked "entry zone" (~1.33233 - 1.33317).
Stop Loss: Above 1.33476.
Take Profit: Around 1.32377.
Risk/Reward Ratio: Favorable, as the potential profit zone (green area) is larger than the risk (red area).

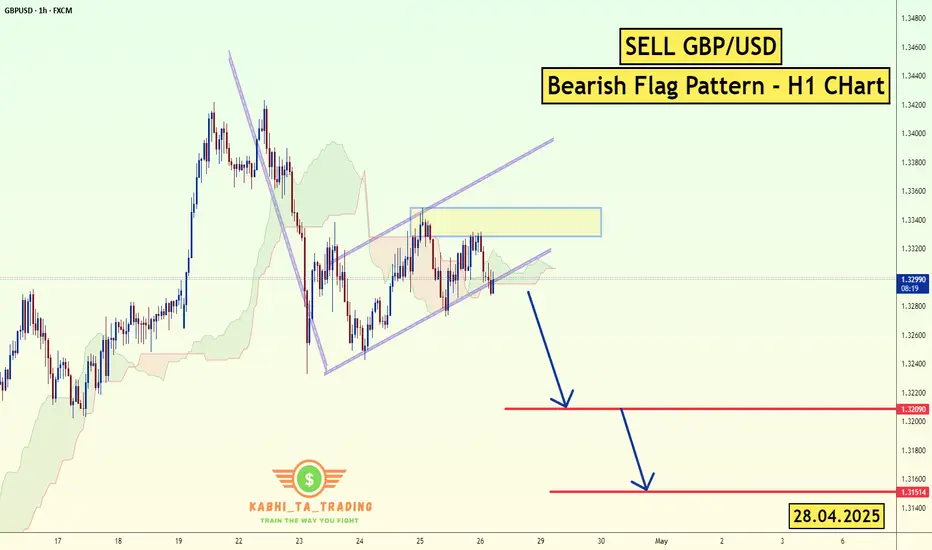
GBP/USD - H1 - Bearish Flag (28.04.2025)FX:GBPUSD The GBP/USD Pair on the H1 timeframe presents a Potential Selling Opportunity due to a recent Formation of a Bearish Flag Pattern. This suggests a shift in momentum towards the downside in the coming hours.
Possible Short Trade:
Entry: Consider Entering A Short Position around Trendline Of The Pattern.
Target Levels:
1st Support – 1.3209
2nd Support – 1.3151
🎁 Please hit the like button and
🎁 Leave a comment to support for My Post !
Your likes and comments are incredibly motivating and will encourage me to share more analysis with you.
Best Regards, KABHI_TA_TRADING
Thank you.
Fundamental Update :
on Monday as the trade tensions between the U.S. and China provided some relief to investors, while a stronger dollar further weighed on prices.
The U.S. dollar TVC:DXY rose 0.2% against a basket of currencies, making bullion more expensive for overseas buyers. TVC:DJI SP:SPX NASDAQ:IXIC also rising .
GBPUSD(20250428)Today's AnalysisMarket news:
The Fed's subsequent policy path considers two scenarios: First, there is no substantial progress in the negotiations between the United States and its trading partners. After 90 days, the US tariffs are still high. Weakened economic demand may prompt the Fed to cut interest rates starting in July, and the annual rate cut may reach 100 basis points; second, the negotiations are fruitful, tariffs are reduced, and the demand shock is small, but inflationary pressure continues. The Fed may postpone easing and only cut interest rates slightly in December. For the market, although the easing comes early in the first scenario, the "recession-style" rate cut may suppress risky assets.
Technical analysis:
Today's buying and selling boundaries:
1.3309
Support and resistance levels:
1.3379
1.3353
1.3336
1.3282
1.3265
1.3239
Trading strategy:
If the price breaks through 1.3309, consider buying, the first target price is 1.3336
If the price breaks through 1.3282, consider selling, the first target price is 1.3265

#GBPUSD: Major Swing Sell Coming On GU, What's your views? OANDA:GBPUSD , as discussed in our previous analysis, where we predicted price would reach our target area and then reject it. The price has almost reached this area, and we are now waiting for it to fully complete the move so that we can take a swing sell on the GBP. Currently, the British pound is stronger and bullish due to the UK’s strong economic growth. However, this is not the case for the US dollar. The dollar is struggling to keep up with other currencies and is currently the worst-performing currency of the month of April.
While focusing on GBPUSD as a pair, it has been extremely bullish since the start of April. However, we are now at a point where there are no strong reasons for the pair to remain bullish and continue its uptrend. There are fundamental signs that will eventually reverse the bearish trend.
Our advice to all is to wait for the price to do its thing. Once it reaches our target area, it may show strong bearish dominance. However, this is not a guarantee that it will behave as we expect. There are two targets that you can focus on once you trade is activated.
Good luck and trade safely!
Thank you for your unwavering support! 😊
If you’d like to contribute, here are a few ways you can help us:
- Like our ideas
- Comment on our ideas
- Share our ideas
Team Setupsfx_
❤️🚀

GBPUSD SHORT FORECAST Q2 W18 D28 Y25GBPUSD SHORT FORECAST Q2 W18 D28 Y25
Professional Risk Managers👋
Welcome back to another FRGNT chart update📈
Diving into some Forex setups using predominantly higher time frame order blocks alongside confirmation breaks of structure.
Let’s see what price action is telling us today!
💡Here are some trade confluences📝
✅Weekly order block rejection
✅Daily order block rejection
✅Weekly imbalance to fill short
✅15’ order block
🔑 Remember, to participate in trading comes always with a degree of risk, therefore as professional risk managers it remains vital that we stick to our risk management plan as well as our trading strategies.
📈The rest, we leave to the balance of probabilities.
💡Fail to plan. Plan to fail.
🏆It has always been that simple.
❤️Good luck with your trading journey, I shall see you at the very top.
🎯Trade consistent, FRGNT X

GBPUSD to retrace lowerGBPUSD is in a retracement right now after a rally to the upside.
It struggled to break out back to the upside yesterday and has been bearish today, breaking multiple short term lows.
The bias for me today is bearish but keep in mind we are in an uptrend in the higher timeframes.

GBPUSD(20250425)Today's AnalysisMarket news:
Federal Reserve-①Hamack: If economic data is clear, the Fed may cut interest rates in June
②Waller: It will take until July to get a clearer understanding of how tariffs affect the economy. If tariffs lead to higher unemployment, interest rate cuts may be initiated. ③The Atlanta Fed GDPNow model predicts that the US GDP growth rate in the first quarter will be -2.5%. ④Kashkari: The frequent announcements from Washington have brought challenges to policymakers and everyone.
Technical analysis:
Today's buying and selling boundaries:
1.3311
Support and resistance levels:
1.3411
1.3374
1.3350
1.3274
1.3248
1.3211
Trading strategy:
If the price breaks through 1.3350, consider buying, the first target price is 1.3374
If the price breaks through 1.3311, consider selling, the first target price is 1.3274

GBPUSD SHORT FORECAST Q2 W17 D25 Y25GBPUSD SHORT FORECAST Q2 W17 D25 Y25
Professional Risk Managers👋
Welcome back to another FRGNT chart update📈
Diving into some Forex setups using predominantly higher time frame order blocks alongside confirmation breaks of structure.
Let’s see what price action is telling us today!
💡Here are some trade confluences📝
✅Weekly order block rejection
✅Daily order block rejection
✅15’ order block
✅Tokyo ranges to be filled
🔑 Remember, to participate in trading comes always with a degree of risk, therefore as professional risk managers it remains vital that we stick to our risk management plan as well as our trading strategies.
📈The rest, we leave to the balance of probabilities.
💡Fail to plan. Plan to fail.
🏆It has always been that simple.
❤️Good luck with your trading journey, I shall see you at the very top.
🎯Trade consistent, FRGNT X

#gbpusdThe price can return to the signal range and we enter the trade there. There are two levels, one with low risk and the other with higher risk, and you can enter at both levels.

GBPUSD is bearish (selling)GBPUSD has clearly rejected the 1,34235 monthly resistance level, a key area that previously in September 2024 acted as our major zone. Using price action my entry confirmation was after the formation of a Bearish signal ( DOUBLE TOP ) on H1

Analysis of GBPUSD 4 - hour ChartAnalysis of GBPUSD 4H Chart
Trend Analysis
From the 4 - hour chart, GBPUSD is generally in an uptrend. The price fluctuations have formed a series of higher highs and higher lows, indicating that the bulls are in control 🐂.
Key Levels
Support Area: The range of 1.3200 - 1.3240 is clearly marked as an important support area in the chart. Previously, the price has rebounded near this area multiple times, suggesting that there is strong buying pressure in this area. If the price retraces to this area again, it may present a potential opportunity to go long 💰.
Target Area: 1.3420 is marked as the target area. If the price breaks through the current consolidation range and continues its upward trend, it is expected to move towards this target price level 🎯.
Trading Strategy
Long - position Strategy: When the price retraces to the 1.3200 - 1.3240 support area and a bullish candlestick pattern appears, one may consider entering a long position. Set the stop - loss just below the support area, and target the 1.3420 target area 📈.
⚡⚡⚡ GBPUSD ⚡⚡⚡
🚀 Buy@1.32000 - 1.32400
🚀 TP 1.33500 - 1.34000
Accurate signals are updated every day 📈 If you encounter any problems during trading, these signals can serve as your reliable guide 🧭 Feel free to refer to them! I sincerely hope they'll be of great help to you 🌟

GBPUSD TRADE PLAN H1GBPUSD TF H1
SELL/SHORT PLAN
cancel if price break ma100(blue),or price break structure
take profit max 1.32000

GBPUSD SHORT FORECAST Q2 W17 D23 Y25 1' ENTRY MODEL EDUCATIONGBPUSD SHORT FORECAST Q2 W17 D23 Y25 1' ENTRY MODEL EDUCATION
Professional Risk Managers👋
Welcome back to another FRGNT chart update📈
Diving into some Forex setups using predominantly higher time frame order blocks alongside confirmation breaks of structure.
Let’s see what price action is telling us today!
💡Trade confluences📝
✅Weekly Order block rejection
✅15’ order block created
✅15’ wick rejections via order block
✅Intraday bearish breaks of structure
✅Tokyo ranges to be filled
✅1’ break of structure
✅1’ bearish engulfing candle fill
✅Sell limit order on the 1’ candle fill
✅Sell limit order via 1' order block created upon 1' break of structure
🔑 Remember, to participate in trading comes always with a degree of risk, therefore as professional risk managers it remains vital that we stick to our risk management plan as well as our trading strategies.
📈The rest, we leave to the balance of probabilities.
💡Fail to plan. Plan to fail.
🏆It has always been that simple.
❤️Good luck with your trading journey, shall see you at the very top.
🎯Trade consistent, FRGNT X

As the dollar's weak trend signals an endTrump's remarks and attitudes in trade negotiations have had a significant impact on the market 📈💥
His change in attitude towards the Federal Reserve Chairman first triggered investors' concerns about the Fed's policy, leading them to seek refuge in gold and causing the price of gold to rise 🏆🚀. Later, his remarks alleviated those concerns, prompting funds to flow back into dollar-denominated assets and causing the price of gold to decline from its peak levels 📉💔
In terms of trade negotiations, potential easing measures may reduce the demand for gold as a safe-haven asset ⏳
Taken together, these factors may imply that market confidence in the dollar has been somewhat restored 🌟. When signs of the end of the dollar's weak trend emerge 📊, more funds flow into dollar assets 💸. Against the backdrop of this change in the direction of capital flows, the GBPUSD has declined 😔
⚡⚡⚡ GBPUSD ⚡⚡⚡
🚀 Sell@1.32800 - 1.32600
🚀 TP 1.32200 - 1.32000
The market has been extremely volatile lately 📈📉 If you can't figure out the market's direction, you'll only be a cash dispenser for others 💰

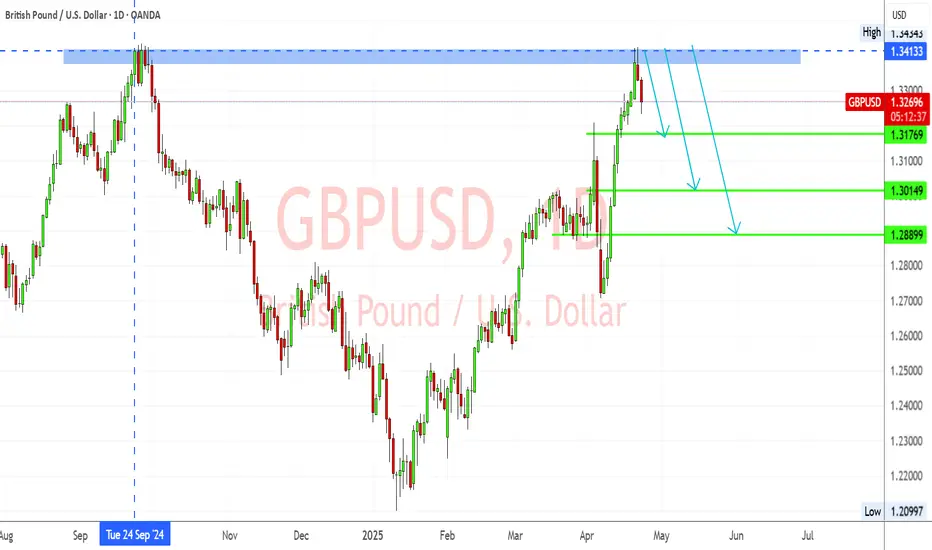
GBPUSD – Rejected at Multi-Month Resistance Amid Weak UK DataGBPUSD has clearly rejected the 1.3413–1.3443 resistance zone—a key area that previously acted as strong supply in September 2024. The pair has formed a bearish rejection candle and is now showing signs of downward momentum.
Key Levels:
Resistance: 1.3413 – 1.3443 (major rejection zone)
TP1: 1.3176 (minor structure)
TP2: 1.3014 (key demand zone)
TP3: 1.2890 (deeper support target)
Bearish Confluences:
Price rejected from major resistance
Bearish candle formation
Previous similar reaction from the same level
Momentum indicators favor downside
📰 Fundamental Analysis:
🔻 UK Data Weakens Further:
According to the latest S&P Global Flash UK PMI (Apr 23):
Composite Output Index: 48.2 (vs 51.5 in March) – 29-month low
Services PMI: 48.9 – 27-month low
Manufacturing PMI: 44.0 – 20-month low
This shows UK private sector activity contracting, led by a steep fall in new export orders, the worst since May 2020.
🔺 Inflation Still High:
Despite falling activity, input and output prices surged, driven by National Insurance hikes and wage growth. This makes it harder for the BoE to justify a cut, despite recession signs.
📌 Conclusion:
The bearish rejection at 1.3413 resistance, combined with deteriorating UK fundamentals, suggests a strong downside setup for GBPUSD. A break below 1.3176 would confirm the bearish move, targeting 1.3014 and potentially 1.2890.
GBPUSD possible short for 1.3030gbpusd tested strong resistance level and high of the year 2024 which is 1.2423. her is weekly supply zone. price may start distribution for big sell. 1.3370-1.3430 weekly supply zone, stop loss place above weekly resistance i.e. 1.3475, target: 1.3030.

GBPUSD SHORT FORECAST Q2 W17 D23 Y25GBPUSD SHORT FORECAST Q2 W17 D23 Y25
Professional Risk Managers👋
Welcome back to another FRGNT chart update📈
Diving into some Forex setups using predominantly higher time frame order blocks alongside confirmation breaks of structure.
Let’s see what price action is telling us today!
🔑 Remember, to participate in trading comes always with a degree of risk, therefore as professional risk managers it remains vital that we stick to our risk management plan as well as our trading strategies.
📈The rest, we leave to the balance of probabilities.
💡Fail to plan. Plan to fail.
🏆It has always been that simple.
❤️Good luck with your trading journey, shall see you at the very top.
🎯Trade consistent, FRGNT X
