GBPUSD SHORT FORECAST Q2 W16 D16 Y25GBPUSD SHORT FORECAST Q2 W16 D16 Y25
Thoughts- It's not if, it's WHEN !
All longs are null until the weekly order block has been breached or price drops considerably. In the here and now the short seems to be closing in.
It is as always important to stack confluences in favour of the short prior risking capital.
15' break of structure is an absolute requirement as this point of price action.
Within the higher time frame order block- looking for a lower time frame order block is not enough to short from therefore scrolling back months to find is pointless in our opinion.
We will let price show us, we will reaction with price.
What are your thoughts...
Are we dropping today?
FRGNT X
Gbpusdsignal

GBPUSD: Strong Bullish Market 🇬🇧🇺🇸
GBPUSD set a new daily high today.
The pair remains in a strong bullish momentum since 8th of April.
With the complete absence of high impact fundamentals today, buying pressure
may persist.
I believe that it may continue rising at least to 1.33 - the closest historic resistance.
❤️Please, support my work with like, thank you!❤️
I am part of Trade Nation's Influencer program and receive a monthly fee for using their TradingView charts in my analysis.

“GBP/USD Long Setup: Demand Zone Bounce Toward 1.35000 Target ”🔍 Trade Setup
🟦 Entry Point: 1.32171
➤ Price is near the 7 EMA – good for a possible bounce.
🟩 Demand Zone: 1.31761 - 1.31500
➤ This is where buyers previously stepped in.
➤ Strong support area – watch for bullish reversal candles here.
🔻 Stop Loss: 1.31141
➤ Below the demand zone to protect against a fakeout.
🎯 Target Point: 1.35000
➤ Big upside target – aiming for a strong rally.
⚖️ Risk to Reward
❌ Risk: 1.32171 → 1.31141 = ~103 pips
✅ Reward: 1.32171 → 1.35000 = ~283 pips
⚖️ R:R Ratio: ≈ 1:2.75 – very favorable!
✅ Summary
🔸 Trend is bullish with strong momentum
🔸 EMA is acting as dynamic support
🔸 Demand zone is clearly respected
🔸 Great R:R setup for a long trade

Gbpusd support sell signal GBP/USD could face immediate resistance at 1.3200 (static level) ahead of 1.3270 (static level) and 1.3300 (round level). On the downside, first support could be spotted at 1.3150 (static level) before 1.3100 (round level, static level) and 1.3040 (static level).
GBP/USD rose three-quarters of one percent on Monday, climbing for a fifth straight trading session as the Pound Sterling continues to reclaim ground against the softening Greenback.

GBPUSD: Continue to riseFor GBP/USD, we still mainly choose to go long during the pullback and go short as a supplement.
GBPUSD trading strategy
buy @:1.31900-1.32100
sl 1.31000
tp 1.32750-1.32850
Today, the trend of GBPUSD basically coincides with what I predicted yesterday. You can click on my personal profile to view the previously published content.

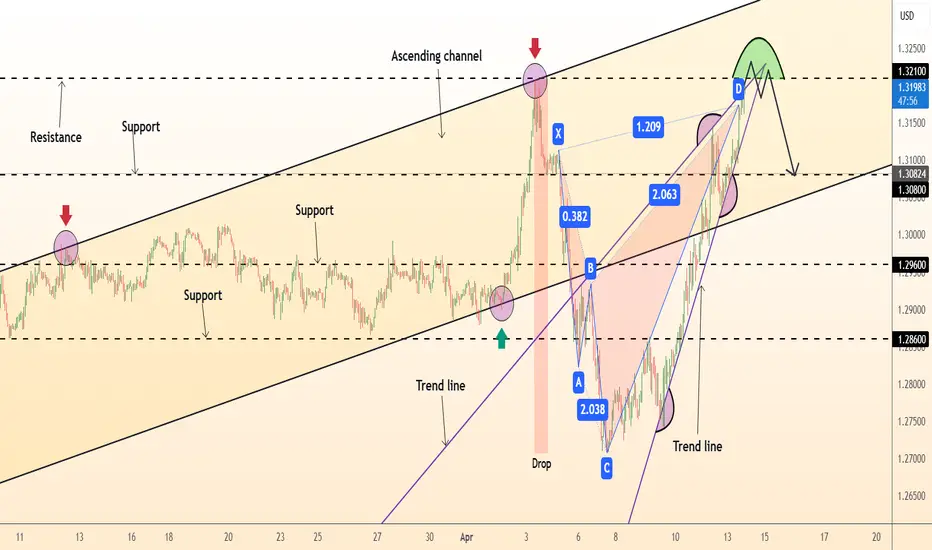
DeGRAM | GBPUSD retest of resistanceGBPUSD is in an ascending channel between the trend lines.
The price has approached the resistance level, which has already acted as a pullback point.
The chart formed an ascending wedge and kept the harmonic pattern relevant.
On the 4H Timeframe, the indicators indicate a bearish divergence.
We expect a pullback in case of consolidation under the resistance.
-------------------
Share your opinion in the comments and support the idea with a like. Thanks for your support!
GBP/USD 4H Chart Analysis – Bullish Reversal from Demand ZoneGBP/USD 4H Chart Analysis
Current Price: 1.27883
Timeframe: 4H (OANDA)
Key Zones:
🟦 Demand Zone (Support Area):
📍 Between 1.26873 (🔻 Stop Loss) and current price
This is where buyers are expected to step in and push the price higher.
🚀 Expected Move: The price is consolidating in the demand zone and might breakout upward.
➡️ Possible path:
1. Small pullback within demand zone
2. 📈 Breakout up to 1.29162 (🔵 First Resistance)
3. 📈 Continuation up to 1.31083 (🎯 Target Point)
Important Levels:
🔻 Stop Loss: 1.26873
(If price drops below this, setup is invalid)
🛑 Mid-Resistance Level: 1.29162
(Might face temporary selling pressure here)
🎯 Target Point: 1.31083
(Take-profit zone)
Conclusion:
📉 If price breaks below 1.26873 → trade invalid ❌
📈 If price holds and breaks above resistance → bullish potential ✅
Risk/Reward setup looks favorable from demand zone to target

GBPUSD(20250414)Today's AnalysisMarket news:
Fed Collins: It is currently expected that the Fed will need to keep interest rates unchanged for a longer period of time. If necessary, the Fed is "absolutely" ready to help stabilize the market; Kashkari: No serious chaos has been seen yet, and the Fed should intervene cautiously only in truly urgent situations; Musallem: The Fed should be wary of continued inflation driven by tariffs.
Technical analysis:
Today's buying and selling boundaries:
1.3064
Support and resistance levels:
1.3245
1.3177
1.3133
1.2995
1.2951
1.2883
Trading strategy:
If the price breaks through 1.3133, consider buying, the first target price is 1.3177
If the price breaks through 1.3064, consider selling, the first target price is 1.2995

GBPUSD: Likely to maintain its upward momentum next weekTrump announced a 90-day suspension of the new tariff plan for most of his trading partners, which has, to some extent, reduced the systemic risks in the market and warmed up the risk appetite. The British pound, due to its nature as a risk currency, has become a beneficiary in the improvement of the global sentiment. At the same time, global stock markets plunged this week due to the uncertainty of trade policies, but the GBPUSD rose against the trend, indicating that the market has a strong bullish sentiment towards the British pound. This sentiment is likely to continue next week.
GBPUSD broke through some key resistance levels this week, such as the 1.3000 mark, opening up room for further upward movement. In the short term, although the RSI has reached a highly overbought level, if the bullish sentiment in the market is strong enough, the GBPUSD still has the potential to continue rising, breaking through the recent high of 1.3145. The next resistance levels might be at 1.3200 and even higher.
GBPUSD trading strategy
buy @:1.30400-1.30480
sl 1.29950
tp 1.30750-1.30810
If you approve of my analysis, you can give it a thumbs-up as support. If you have different opinions, you can leave your thoughts in the comments.Thank you!

GBP/USD Short Setup – Rejection from Resistance Zone with High REMA 30 (red line)
EMA 200 (blue line)
---
Key Levels:
Entry Point: 1.31324
Stop Loss: 1.32303
Target (TP): 1.28102
---
Analysis:
1. Trend Context:
The market shows a recent bullish move approaching a key resistance zone (highlighted in purple).
The price is now reacting to that resistance zone and potentially forming a reversal.
2. EMA Insight:
Price is currently trading slightly above the EMA 200 and EMA 30, indicating short-term bullish momentum.
However, the suggested trade setup appears to be short (sell), anticipating a reversal from resista

GBP/USD Ready to Fly! 📢 GBP/USD Ready to Fly! 🚀
📈 Looking bullish from Weekly Bullish FVG 50% Level 🎯
✅ Waiting for confirmation before entry!
🎯 Target: Bearish Extreme Order Block
🔥 Don't miss the move! Stay updated – Follow our TradingView page! 📊

GBPUSD potential buy zone in inverted head & shoulder!GDP in GBPUSD had spike in actual value with the forecast has boost in this pair. Prior to data release this instrument had a break of structure has given strong liquidity grab as it has broken from long term trend line. As the market structure remain intact we may see the price to bounce back to the daily resistance line. 15m timeframe already has formed an inverted head & shoulder which signaling potential breakout. Any liquidity grab may give us potential entry in this lower timeframe.

Analysis of the Trend of the GBPUSDThe GBPUSD is currently showing a gradually rising trend. An important support level is 1.28850, which is the lower boundary of the current range. Once it is broken below, it may suggest a reversal of the trend to a bearish one. Before that, we should still mainly choose to go long and use short selling as a supplement.
GBPUSD trading strategy
buy @:1.29200-1.29300
sl 1.28850
tp 1.29750-1.29850
If you approve of my analysis, you can give it a thumbs-up as support. If you have different opinions, you can leave your thoughts in the comments.Thank you!

GBP/USD Breakdown Incoming? Bearish Setup Unfolding!Hi traders! Analyzing GBP/USD on the 1H timeframe, spotting a potential rejection at the descending trendline:
🔹 Entry: 1.29660
🔹 TP: 1.28652
🔹 SL: 1.30650
Price is reacting to the descending trendline after testing a key resistance zone. This level has acted as dynamic resistance in the past, and price shows signs of rejection.
The RSI is in the overbought area, suggesting a possible pullback. If the bearish momentum confirms, we could see a clean move back down to the previous support levels.
⚠️ DISCLAIMER: This is not financial advice. Every trader must evaluate their own risk and strategy.

GBP/USD Bullish Breakout Setup – Entry, Target & Stop Loss AnalyEMA 200 (blue line): 1.28423 – typically used to define long-term trend direction.
EMA 30 (red line): 1.28253 – shorter-term trend indication.
Currently, the price is above the 30 EMA and slightly above the 200 EMA, suggesting short-term bullish momentum with potential for trend reversal or continuation.
🟪 Key Zones and Levels:
Entry Point Zone: Around 1.28242–1.28423 (highlighted in purple).
Stop Loss: Set slightly below the purple demand zone at 1.27931.
Target (EA TARGET POINT): Marked around 1.29809.
🧠 Trade Setup Summary:
Risk/Reward: Good – aiming for a ~1.19% gain (~152.5 pips), with a relatively tight stop loss.
Structure:
The price has broken above a consolidation range (demand zone) and retested the zone (potential bullish retest).
EMA crossover could soon occur if the 30 EMA crosses above the 200 EMA, confirming bullish sentiment.
✅ Bullish Confirmation Signs:
Higher lows forming.
Break and retest of previous resistance (now support).
EMA proximity breakout is occurring.
Strong bullish candles near the entry level.
⚠️ Things to Watch:
If price closes strongly above 1.2860–1.2870, that could signal momentum continuation.
Failing to hold 1.2824–1.2800 might invalidate the setup and trigger the stop loss.
Watch for fundamental events (economic news, especially from UK/US) that could cause sudden volatility.

GBP/USD "The Cable" Forex Bank Heist Plan (Swing / Day Trade)🌟Hi! Hola! Ola! Bonjour! Hallo! Marhaba!🌟
Dear Money Makers & Robbers, 🤑 💰💸✈️
Based on 🔥Thief Trading style technical and fundamental analysis🔥, here is our master plan to heist the GBP/USD "The Cable" Forex Market. Please adhere to the strategy I've outlined in the chart, which emphasizes long entry. Our aim is the high-risk Red Zone. Risky level, overbought market, consolidation, trend reversal, trap at the level where traders and bearish robbers are stronger. 🏆💸"Take profit and treat yourself, traders. You deserve it!💪🏆🎉
Entry 📈 : "The heist is on! Wait for the MA breakout (1.30500) then make your move - Bullish profits await!"
however I advise to Place Buy stop orders above the Moving average (or) Place buy limit orders within a 15 or 30 minute timeframe most recent or swing, low or high level.
📌I strongly advise you to set an "alert (Alarm)" on your chart so you can see when the breakout entry occurs.
Stop Loss 🛑: "🔊 Yo, listen up! 🗣️ If you're lookin' to get in on a buy stop order, don't even think about settin' that stop loss till after the breakout 🚀. You feel me? Now, if you're smart, you'll place that stop loss where I told you to 📍, but if you're a rebel, you can put it wherever you like 🤪 - just don't say I didn't warn you ⚠️. You're playin' with fire 🔥, and it's your risk, not mine 👊."
📍 Thief SL placed at the recent/swing low level Using the 4H timeframe (1.27000) Swing/Day trade basis.
📍 SL is based on your risk of the trade, lot size and how many multiple orders you have to take.
🏴☠️Target 🎯: 1.35000 (or) Escape Before the Target
🧲Scalpers, take note 👀 : only scalp on the Long side. If you have a lot of money, you can go straight away; if not, you can join swing traders and carry out the robbery plan. Use trailing SL to safeguard your money 💰.
💰💵💸GBP/USD "The Cable" Forex Market Heist Plan (Swing/Day) is currently experiencing a bullishness,., driven by several key factors. 👇👇👇
📰🗞️Get & Read the Fundamental, Macro, COT Report, Quantitative Analysis, Sentimental Outlook, Intermarket Analysis, Future trend targets... go ahead to check 👉👉👉🔗🔗
⚠️Trading Alert : News Releases and Position Management 📰 🗞️ 🚫🚏
As a reminder, news releases can have a significant impact on market prices and volatility. To minimize potential losses and protect your running positions,
we recommend the following:
Avoid taking new trades during news releases
Use trailing stop-loss orders to protect your running positions and lock in profits
💖Supporting our robbery plan 💥Hit the Boost Button💥 will enable us to effortlessly make and steal money 💰💵. Boost the strength of our robbery team. Every day in this market make money with ease by using the Thief Trading Style.🏆💪🤝❤️🎉🚀
I'll see you soon with another heist plan, so stay tuned 🤑🐱👤🤗🤩

Gbpusd signal buy GBP/USD tested higher on Wednesday, climbing back over the 1.2800 handle after broad-market sentiment recovered across the board. The Trump administration has once again pivoted away from its own “no exceptions, no delays” tariff policy, and has again delayed tariffs, this time for 90 days.
The Relative Strength Index (RSI) indicator on the 4-hour chart stays below 50 despite the latest rebound, suggesting that buyers remain reluctant to commit to a steady recovery in Pound Sterling.
Gbpusd signal buy

GBPUSD UPDATES FOR SHORTERM TRADEHello folks, refined the previous idea on GBPUSD,
this is my probability target 1.29500 zone, before it will go lower.
I closed the previous idea, but already win 100pips.
This is not a financial advice,
Follow for more.
Pewpewww. New chart once we reached that level again, aim for 250pips since posted the idea on 1.27 entry zone

DeGRAM | GBPUSD has reached a support levelGBPUSD is in a descending channel between the trend lines.
The price has already reached the lower trend line and support level.
The indicators on the 1H Timeframe are forming a bullish convergence.
We expect a rebound after the retest and fixing the chart above $1.271
-------------------
Share your opinion in the comments and support the idea with a like. Thanks for your support!

GBPUSD UPDATES
hello folks, how are you all!
Trade is consistently precise.
See charts above for the full idea.
I labeled it base on your own taste.
This is not a financial advice.
as I said before 1.27 zone could be the entry, here it is.
Congrats. Aim for this at least 100 pips

GBPUSD(20250409)Today's AnalysisMarket news:
The U.S. Customs and Border Protection Agency reiterated that the specific tax rates for each country will be announced at 12:01 a.m. on April 9.
Technical analysis:
Today's buying and selling boundaries:
1.2764
Support and resistance levels:
1.2862
1.2825
1.2802
1.2726
1.2702
1.2666
Trading strategy:
If the price breaks through 1.2802, consider buying, the first target price is 1.2825
If the price breaks through 1.2764, consider selling, the first target price is 1.2726

GBPUSD Watch – Bearish Momentum Building Below Supply ZoneGBPUSD pair has broken sharply below the long-standing accumulation range between 1.2857 – 1.3012, signaling a shift in market sentiment. The recent bearish engulfing structure has pushed price into a corrective pullback phase, with sellers likely to re-enter on rallies.
Key Technical Levels:
Current Price: 1.2795
Resistance (Supply Zone): 1.2857 – 1.2863
First Support Target: 1.2688 – 1.2690
Mid-Level Target: 1.2568 – 1.2570
Final Bearish Target: 1.2383 – 1.2390 (demand zone & key support)
Trade Scenario:
📉 Bearish Bias:
Price is expected to retrace into the supply zone (1.2857–1.2863) and then reject.
If resistance holds and structure remains intact, expect continuation toward:
TP1: 1.2689
TP2: 1.2568
TP3: 1.2385
🔁 Invalidation Zone:
A sustained break and close above 1.2863 would invalidate the bearish setup and could trigger a move toward 1.3012.
Technical Confluence:
✅ Previous consolidation turned into a strong resistance zone
✅ Bearish breakout from range
✅ Clean lower highs and lower lows structure
✅ Volume drop on the pullback (likely a corrective move)

GBPUSD Bearish Breakout !
HI,Traders !
GBPUSD broke the rising
Support line and the breakout
Is confirmed so we are
Bearish biased and we
Will be expecting a
Further move down !
Comment and subscribe to help us grow !
