GDP / USD ShortA list of bearish Signals:
Hidden Bear Divergence
Top of BBands
Existing Downtrend
Rejection of Resistance after upward retrace
GDP

Short position in the long termThe Swiss Franc is achieve his highest approximately since the BREXIT Referendum (23/6/16) for it, this pair perhaps breaks the first support price and decrease fasterif the GDP data of UK is more lower than expect... in addition this week the BoE is going to adjust the interest rate (15% probability) due to positive economic data released the previous week.

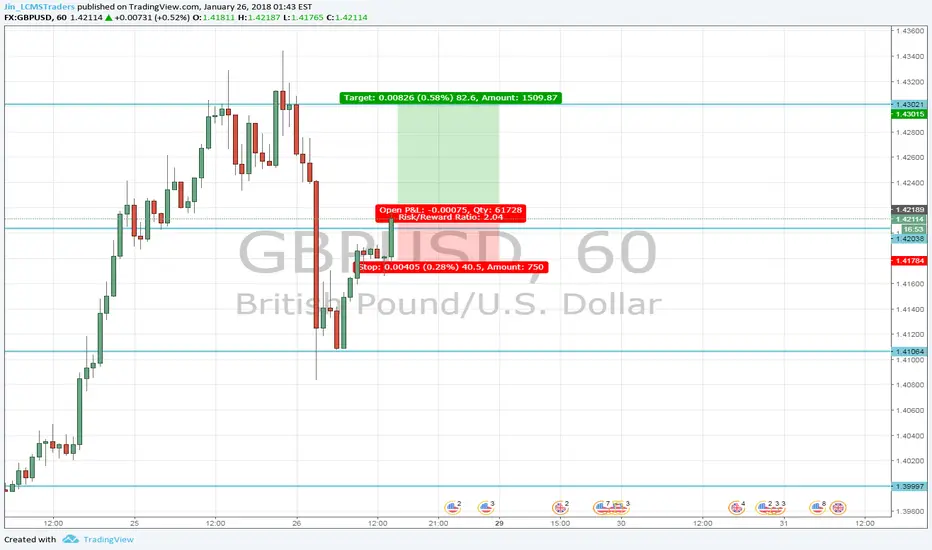
TODAY 9:50 EST SUNDAY 25/3/2018EVERYBODY´S WAITING FOR THE FIRST SUPPORT PRICE ($1.41...) THEN THE PRICE WILL INCREASE UNTIL THE LAST RESISTANCE ($1.43 MORE OR LESS)... YOU SHOULD HAVE INTO ACCOOUNT THAT IN THIS WEEK THE UK AND USD GDP DATA WILL BE RELEASED, THE BoE will decide if change or not the interest rate , and THE BREXIT ISSUES !
TAKE CARE AND GOOD TRADE
www.twitter.com
There is more information about that... including a list where there is a lot information about the markets, traders among others.

25/3/2018 9:43 EST SHORT AND LONG POSITIONEVERYBODY´S WAITING FOR THE FIRST SUPPORT PRICE ($1.41...) THEN THE PRICE WILL INCREASE UNTIL THE LAST RESISTANCE ($1.43 MORE OR LESS)... YOU SHOULD HAVE INTO ACCOOUNT THAT IN THIS WEEK THE UK AND USD GDP DATA WILL BE RELEASED, THE BoE will decide if change or not the interest rate , and THE BREXIT ISSUES !
TAKE CARE AND GOOD TRADE
www.twitter.com
There is more information about that... including a list where there is a lot information about the markets, traders among others.

NZDCAD Short: Gartley Confluence, Fade CAD GDP WeaknessHey traders, I like a short here at the completed smaller Gartley pattern. There is confluence on the higher timeframe and the data was not as weak as the market would suggest. Looks more like a brief rally that will be followed by continued weakness. Cheers

CAD GDP this eveningI’ll be paying attention the CAD GDP this evening, as a surprise could present. The USDCAD has been trading in a 100pip range (1.2280 and 1.2380), a break of the support could see price extend toward 1.2100.

Today, is GDP day.As we look at the GBP q/q GDP, with an expectation for performance to hold the same (at 0.4%). This may represent a trend following buying opportunity for the GBPUSD, especially if the GBPUSD holds above 1.42.
In the evening, we have US q/q GDP, expecting a data slightly worse than previous. This will be a data release I’ll be avoiding, due to 3 reasons, A Friday evening, timing of the release, and with WEF in Davos happening over the weekend. While Davos is unlikely to have policy implications, political jawboning could increase volatility in the currency pairs.
S&P 500 : Ahead of a massive bull market like 1995 ? ... noThis double chart have one and only purpose... to simply destroy any king of idea about the S&P that could be about to perform crazy like it did in the 1995-2000 rallye.
That's just non-sense and purely stupid. Not only the context is totally different... cause back then the GDP was the true gas of that rallye... as today everyone knows that we will never be able to match such growth nowadays...
Plus, the first chart highlights the fact that, related to GDP, we are actually pricing the S&P today just like we did in the top of the 2000 bullmarket, not the beginning of it ! So instead of giving a sign of bullish support this chart actually shows more bear probabilities !
And if this arguments doesn't convince you, then simply have a look at the durable goods order, the most reliable hard data to forecast earnings...
Do you see any kind of reliable following of the recent parabolic uptrend ? I don't !
So the real question is what drives the market ? Well this is a complex answer... But the only thing I can tell is that every person that argue this bull market is similar to 1995 is just non-sense !
Just to set things straight... I'm not saying I want to short the market tomorrow.. I just say that this theory that says the market is at the beginning of a massive bullish move.. well .. not likely to me ! and most likely reaching the endpoint soon.
Hope this idea will inspire some of you !
Don't forget to hit the like/follow button if you feel like this post deserves it ;)
You can check my indicators via my TradingView's Profile : @PRO_Indicators
Kindly,
Phil

GDP release at 19:30 ESTFor anyone who has a deeper analysis on trend, here is an extra fundamental variable.

GBP/JPYGBP/JPY ready for a considerable directional movement. The chart is testing the 148 fibonacci price level together with a possible triangle pattern. Datas on UK's GDP will play a fundamental role today.

Two options with EURUSD; more sided with short.I am more leaning towards the sell because of economic principles; The European Central Bank as decreased its bond buy activity which means they are pumping less money supply into the economy and in other terms, since they are not spending money in buying bonds, GDP must decrease to some extent if all other variables are constant. The formula for GDP is = C + I + G + (X - M). G is the government spending. So if all other things are relatively the same, and the government spends less money, GDP has to decrease so therefore the value of the Euro has to decrease as well since the value depends on GDP as well as other factors. That is just my economic reasoning.
"The European Central Bank said Thursday it would carry on buying government bonds deep into next year but in reduced monthly amounts , a milestone policy shift that signals it will follow the U.S. Federal Reserve on a path toward higher interest rates." -The Wall Street Journal

GBPCAD Triangle/Wedge/Pennant ExampleFundamentally we know that GBP is strong and that CAD is weak. GBP had a good beat on GDP data yesterday. CAD has been weaker due to the neutral/dovish statements made yesterday by the Bank of Canada. There was a large initial move yesterday and we are currently in a pullback. While in the pullback the a Triangle/Wedge/Pennant formation developed. I know they are all technically different, but to me they all represent a consolidation before a breakout. I use Fundamentals to determine direction. So to me, they are all more or less the same.
I thought this was a good example. Hopefully it continues to break upwards.

GDP: A Temporary USD Reversal 'Reversal'US GDP will be released at 8:30 ET, in 40 minutes.
I believe the USD will weaken as a result of a lackluster report.
Short term EURUSD target for weakening USD and stronger European prospects.

GBPUSD Fundamental/Technical setupHaving broken through the previous 1.22 - 1.26 range off the back of the general election announcement, GBPUSD appears to have established a new range between support at previous resistance (1.26) and new resistance at 1.3
the 1.3 level has now been tested for a third time, with what appears to be a false break earlier this month. News tomorrow supporting the British economy could well lead us into a new range between 1.3, and 1.33, particularly considering the low likelihood of a fed decision to increase interest rates across the pond. In spite of these possible results, the more likely outcome is for the Cable to maintain its current range, particularly considering the IMF's recent decision to downgrade projected UK growth from 2.0 to 1.7% for the coming year.
I will therefore wait for the result of the economic releases from the UK tomorrow, and set a Short entry at 1.3, with a TP at 1.265 towards the bottom of the predicted range, and the SL at 1.315, just above the most recent false BO.
Good Luck!
TW

Gold scenarios for next few daysGold 0.06% been trending upwards nicely in a channel, off an inverted H&S bottom and break of the downward channel, pushing through some key levels. Lots of data tomorrow too in EU and US. Could push this around and give us continuation or a breakdown. The channel is clear and some other decent levels to watch for opportunities, keep an open mind on direction from here. There's no crystal ball but resolution of battle for 1250-1260 zone should be significant. Can see $20 move in either direction once resolved, at least. Probably more if managed well.
Position lightly and from the edges, be patient, manage risk tightly, and let the winners run - that should get you on the right side of a decent move in the coming days, in my opinion.

AUDUSD Daily AUDUSD testing descending trend line also EMA is crossing.
Rate decision,Trade Balance,GDP report will show clear direction of aussie keep an eye @ this level

USDCAD short (GDP)we have one big news is a GDP for CAD and expectation good .
we looking a breakout level .618 fibo before news then go sell .

GBPCAD Potential Short After Prelim GDPUK preliminary GDP released tomorrow. If it disappoints, I want to be short this pair. If it beats forecast, I will be looking for GBP pairings against weaker currencies like the yen. Cheers

NZDUSD Long: Weak US GDP Data + ChannelHey traders, GDP came in at 1.9% behind expected 2.1%. The kiwi has been strong and this pair is in an upward channel. I am long from here toward the 1.272 extension. Cheers

Treasury Yields Surge but the Dollar Stays PutOver supply from the auctions should keep treasury yields rising to test the high @ 2.65 on the 10yr. Bills and 7yr being auctioned tomorrow should continue to fuel the Dow higher. $DXY might follow yields to 102 forming a right shoulder depending on the data tomorrow and Friday.

AUD/USD sell off on strong US growthStrong US 3Q GDP growth on strong jobs data along with weak Australian fundamentals weighing in may send the Aussie lower against the greenback. 0.7500 level the likely support zone for the AUD/USD sell-off.

UK GDP likely to be worse than expectedBrexit fears impact on consumer and business confidence likely to give some shocks to anticipated GDP growth. Although this has mostly been priced in, an announcement of weaker GDP will send the Pound lower to the 1.2000 level.

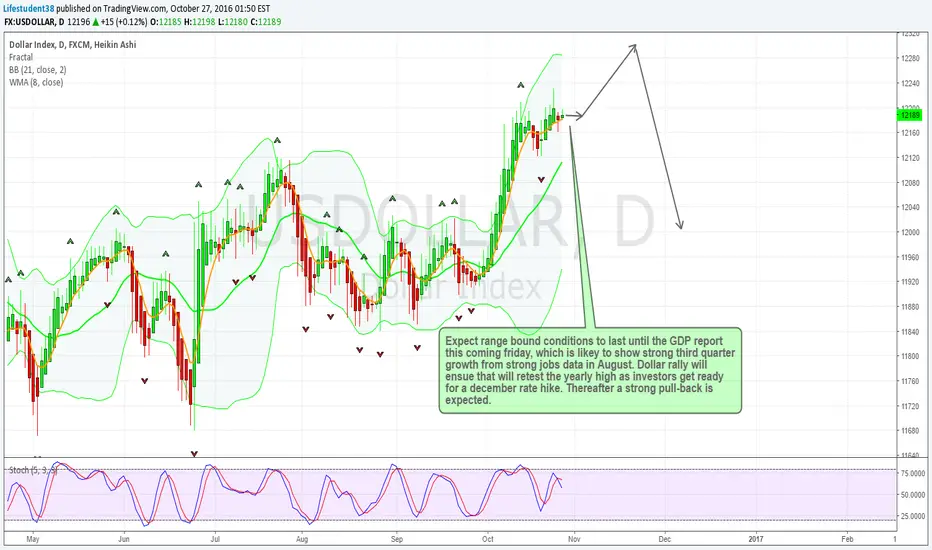
US Dollar 3Q GDP likely to show stronger growthExpect range bound conditions to last until the GDP report this coming friday, which is likey to show strong third quarter growth from strong jobs data in August. Dollar rally will ensue that will retest the yearly high as investors get ready for a december rate hike. Thereafter a strong pull-back is expected.