GOLD in rectangle patternwe might see more rejection from gold, to reach about the previous resistance at $3150
Gold

GOLD accumulate as the market lacks major fundamental impactSpot OANDA:XAUUSD moved significantly in early morning trading on Tuesday (April 29) and is currently trading at $3,315/oz, down 0.87% on the day at the time of writing.
OANDA:XAUUSD reversed losses on Monday and rebounded, having earlier dipped to around $3,268. The US Dollar (Dxy) fell broadly on Monday, supporting gold as investors cautiously awaited more news on US trade policy and braced for a week of in-depth economic data that could provide early indications of whether US President Trump’s trade war is having an impact.
The U.S. Dollar Index TVC:DXY fell 0.7% on Monday to close at 98.91, its lowest close in four trading days. The DXY has fallen 4.89% in April and is set to post its biggest monthly decline since July last year as Trump has shaken confidence in the reliability of U.S. assets.
A majority of economists polled by Reuters see a high risk of a global recession this year, with many saying that U.S. President Donald Trump’s tariffs have hurt business confidence. Bessant said on Monday that major U.S. trading partners have made “very good” proposals to avoid U.S. tariffs and one of the first deals to be signed would likely be with India.
Fed officials, including Chairman Jerome Powell, have said they are ready to cut rates if risks to economic growth become clear. But most officials appear to want to determine the impact of Trump’s tariffs on real economic indicators like inflation and employment before taking action.
This week, the US will also release first-quarter GDP data and the Fed's preferred inflation measure, core PCE, while Europe will also release preliminary GDP and inflation data.
Investors are also awaiting the US April jobs report on Friday, which is expected to show that employment is still growing, albeit at a much slower pace than a month ago.
Investors will also pay attention to the US JOLT jobs data for March and the second round of US-Japan tariff talks, due out today.
Technical Outlook Analysis OANDA:XAUUSD
On the daily chart, gold continues to move sideways as there is no fundamental impact big enough to break the structure to create a short-term trend. But in terms of position, gold is currently likely to decline as the RSI is pointing down quite far from 50, 50 in this case acts as the nearest target support indicating that there is still room for downside ahead in the short term.
However, in the overall picture, gold is still trending up mainly due to supporting factors such as the trending price channel as the main trend, the main support from EMA21 and as long as gold is above EMA21, in/above the price channel, it is still in the main uptrend, the declines should only be considered as short-term corrections or a buying opportunity.
During the day, gold is expected to accumulate with the main uptrend, the notable positions will be listed as follows.
Support: 3,292 – 3,267 – 3,245 USD
Resistance: 3,371 USD
SELL XAUUSD PRICE 3382 - 3380⚡️
↠↠ Stop Loss 3386
→Take Profit 1 3374
↨
→Take Profit 2 3368
BUY XAUUSD PRICE 3287 - 3289⚡️
↠↠ Stop Loss 3283
→Take Profit 1 3295
↨
→Take Profit 2 3301

XAUUSD Analysis: Gold Awaits a Breakout From Downtrend (H4)Currently, gold ( OANDA:XAUUSD XAUUSD) is trading around 2331. On the H4 timeframe, gold remains in a high-efficiency downtrend. However, the market is awaiting a catalyst to trigger a breakout and escape the current stagnation.
A critical support area to watch is around 3310 - 3312, where we see a clear battle between buyers and sellers, as reflected on the H4 candles. This zone could determine the next move for gold.
XAUUSD Intraday Trading Strategy
SELL XAUUSD Entry: 3368 - 3370
Stoploss: 3378
Take Profit 1: 3360
Take Profit 2: 3355
Take Profit 3: 3350
BUY XAUUSD Entry: 3310 - 3312
Stoploss: 3306
Take Profit 1: 3316
Take Profit 2: 3320
Take Profit 3: 3330
Important Notes
-Always set a Stoploss to protect your capital in all trading situations.
-Prioritize trading upon confirmed signals within the analyzed price zones.

Will Gold Reject This Important Resistance?Hey Traders, in today's trading session we are monitoring Gold for a selling opportunity around 3,355 zone, Gold is trading in a downtrend and currently is in a correction phase in which it is approaching the trend at 3,355 support and resistance area.
Trade safe, Joe.

xauusd next move?gold currently trading at 3330 and we are anticipating the target 3370 and 33350 good luck

Gold has the potential to rebound towards the 2338 "Gold has the potential to rebound towards the 2338 area, but first, a correction to the 3212–3293 range is needed to create a strong momentum for further upward movement."
Today's Scenario: XAUUSD Trading Strategy Around the Key Price Zones
🔻 Sell XAUUSD around 3338
Stop Loss: 3346
Take Profit 1: 3328
Take Profit 2: 3218
Take Profit 3: 3212
🔺 Buy XAUUSD around 3212
Stop Loss: 3200
Take Profit 1: 3218
Take Profit 2: 3225
Take Profit 3: 3230
Note: Always set a Stop Loss in every trade to manage risk and protect your capital.

The Monthly Transition for GoldLooking for price to retrace and take out lows before it proceeds to be bullish. Waiting for Killzones.

GOLD bulls ready to break higherHere we are looking at the 240/4hr chart. I am seeing price make a push higher from a previously well respected support zone and a possible triangle pattern forming after pushing down from previous highs.
Currently we're waiting for bears to push the price down either to the bottom of the triangle pattern, or breaking out to the highs for entries higher.
Plan for bears is to sell back into the triangle and in current resistance.
Plan here for bulls is to look for entries at a better price breaking this pattern, or into the highs.

GOLD Free Signal! Sell!
Hello,Traders!
GOLD went up from the
Support just as I predicted
But is now retesting a local
Horizontal resistance structure
So we can go short with the
Take Profit of 3320$ and
The Stop Loss of 3374$
Using small lot size is
Highly recommended
As it is a risky setup
Sell!
Comment and subscribe to help us grow!
Check out other forecasts below too!
Disclosure: I am part of Trade Nation's Influencer program and receive a monthly fee for using their TradingView charts in my analysis.

No Guessing. No Praying. Just Precision — Smart Money Moves Only📆 XAUUSD Daily Plan – April 29, 2025
🔥 Macro & Market Context:
Gold continues its tactical chess game between premium supply traps and reactive support zones.
Price is currently hovering around 3342, teasing a breakout or another trap inside the 3340–3355 resistance block.
Tomorrow we also have important USD news: 🔵 CB Consumer Confidence
🔵 JOLTS Job Openings
Expect potential volatility during NY session — stay adaptive, not predictive.
🎯 Bias Overview:
HTF Bias (H4–Daily): Bullish (Higher Highs and Higher Lows structure still intact)
LTF Flow (M15–H1): Corrective bullish retrace inside HTF uptrend
📍 Key Levels to Watch:
🔺 Resistance Zones:
3340–3355 → Minor Premium Resistance (currently being tested)
3372–3376 → Strong Trap Sell Zone (next immediate target above)
3380–3390 → Major Liquidity Pool (big decision area if price pumps further)
🔻 Support Zones:
3284–3288 → Intraday Demand + Bounce Zone
3233–3237 → HTF Major Reversal Demand
🎯 Refined Sniper Zones:
🟩 Buy Zone #1: 3284–3288
(H1 demand cluster + previous clean reaction)
🟩 Buy Zone #2: 3233–3237
(Deep HTF OB + untapped liquidity anchor)
🟥 Sell Zone #1: 3372–3376
(M15–H1 OB + liquidity trap setup)
🟥 Sell Zone #2: 3380–3390
(Premium supply and major liquidity sweep)
👀 Eyes On:
Reaction at 3372–3390: Weak rejections = tactical sell opportunities.
Respect for 3284–3288: Bullish continuation if defended strongly.
Violation below 3230: HTF momentum shift possible toward deeper discount.
📢 Final Message:
Gold’s setting traps for both bulls and bears — but we’re hunting precision, not chaos. 🏹
Patience = Power.
Confirmation = Survival.
🔥 Trading Focus Tip:
"First wicks grab liquidity. First breakouts fool emotions.
We wait for the second reaction — that's where the sniper eats."
If this map helps you stay focused, smash that ❤️ and follow, drop your thoughts below, and let's trade the smart flow together! 🚀✨

XAUUSD Weekly-Daily-H4 Outlook – April 28, 2025"Gold’s Game: Range Trap... or Breakout Incoming?" 👀⚡
🔥 Macro + Micro Context:
Macroflow: No major macro catalysts today — market sentiment driven mostly by technicals, liquidity behavior, and late-week reactions.
Bias:
HTF (D1–W1): Still bullish-biased long-term, unless 3220–3235 breaks cleanly.
LTF (H4–M30): Currently trapped in a wide distribution range 3380–3260, showing signs of both liquidity sweeps and engineered traps.
Liquidity Dynamics:
Both upside and downside liquidity have been targeted multiple times. Equal highs/lows patterns forming, suggesting fakeouts are highly probable before any real move.
📈 STRUCTURAL RANGE:
🔵 Main Range:
• Top: 3380–3395 → major flip zone (premium side)
• Bottom: 3260–3280 → major demand zone (discount side)
📚 Inside the range:
• Liquidity is being farmed on both sides — expect fake spikes, stop hunts, and whipsaw moves before breakout.
🔑 H4 Key Zones (Above Current Price):
Level Type Notes
3380–3395 Major Supply + Flip Zone HTF orderblock + FVG + previous sell trap
3410–3415 Minor Supply Zone M30–H1 imbalance + small FVG
3448–3455 Major Premium Supply HTF OB + FIBO 1.618 extension + historical premium trap
3490–3500 ATH Area Strong psychological level + institutional interest
🔑 H4 Key Zones (Below Current Price):
Level Type Notes
3260–3280 Major Discount Demand Strong H1-H4 unmitigated OB + liquidity grab zone
3220–3235 HTF Reversal Demand Last HTF pivot for bullish bias
📊 Expected Scenarios:
Bullish Path:
Hold 3260–3280 → Break 3380–3395 → Target 3415 → Then 3450–3500 range sweep.
Bearish Path:
Fail at 3380–3395 → Sharp rejections back into 3280 → Potential crash toward 3235 and 3210.
👀 EYES ON:
Watch the 3380–3395 flip zone closely.
If price fails there with heavy wicks and low volume, bulls are trapped again.
If price holds above 3395–3415 cleanly, bulls regain control for 3450+.
🧠 FINAL MESSAGE:
"The best traders don’t predict. They prepare."
"Trap or breakout — it’s all about reaction, not prediction. Stay sharp, stay liquid, and don’t chase the donkey moves."
🔔 Follow for real-time smart updates
💬 Comment your bias below: bull 🐂 or bear 🐻? Let’s grow the community together!
#Gold #XAUUSD #TradingView #SmartMoney #RangeTrap #GoldOutlook

XAUUSD – Daily Outlook (April 28, 2025)Gold continues to trade near all-time highs after last week’s explosive rally. However, the most recent Daily candle shows a clear long-wick rejection into the premium supply zone (around 3350–3430), suggesting that smart money may be defending this level.
✅ Structure remains bullish on higher timeframes.
✅ Momentum slowed slightly after touching the upper extreme.
✅ Price is still holding above the previous daily range breakout.
At the same time:
⚠️ Buyers are showing signs of exhaustion after tapping into the premium supply zone.
⚠️ Volume on the last bullish candle was lower compared to the recent bearish reaction.
⚠️ The last daily wick indicates possible trapped buyers at the highs.
Key Levels to Watch:
Resistance Zone: 3350–3430 (premium supply rejection)
Support Zone: 3280–3300 (former breakout zone)
Deeper Support: 3120–3160 (mid-range liquidity pocket)
What’s Next?
As long as Gold stays above 3280, the broader bullish bias remains intact.
However, a clean daily close below 3280 could trigger deeper retracements into 3240 or even 3160 zones before bulls regain strength.
Patience is key here: let price tell its story between the premium rejection and the former breakout zone.
🔔 Final Thought:
Gold is not in a rush. Neither should you be. Stay sharp, stay patient — the best setups often appear when most traders lose their discipline.
Follow for more clean updates, sniper entries, and smart market flow insights. Let’s grow together! 🚀💛

Gold Trading Plan: Liquidity Grabs, Pullback, and UptrendHello Ladies and Gentlemen!
Based on recent news and Trump’s turbulence, we are closely following macroeconomics, the ongoing tariff wars, and geopolitical events. Gold is showing signs of exhaustion after last week's pullback. While we see a recovery, we must remember that not everything we see can be trusted. However, based on our analysis of the current situation and an understanding of market execution and liquidity grabs, we expect a pullback that could confirm the uptrend — providing a potential opportunity to go long.
Here’s the plan:
1. Double check at the current liquidation level
2. Wait for a pullback around a key level below.
3. Confirm the continuation of the uptrend.
We must carefully monitor each market session and pay close attention to macroeconomic news releases, as the market may react sharply by grabbing liquidity. It will be interesting to see how far we can go from here with liquidity runs and whether additional pullbacks will occur. For now, we remain patient and wait for clear confirmation signals.
Share your ideas!

Hanzo | Gold15 min Breaks – Will Confirm the Next Move🆚 Gold – Hanzo’s Strike Setup
🔥 Timeframe: 15-Minute (15M)
——————
💯 Main Focus: Bullish Breakout at 3301
We are watching this zone closely.
💯 Main Focus: Bearish Breakout at 3270
We are watching this zone closely.
📌 If price breaks with high volume, it confirms Smart Money is in control, and a strong move may follow.
———
Analysis
👌 Market Signs (15M TF):
• Liquidity Grab + CHoCH at 3361
• Liquidity Grab + CHoCH at 3336
• Strong Rejections seen at:
➗ 3270 – Major support / Key level
➗ 3300 – Proven resistance
🩸 Key Zones to Watch:
• 3300 – 🔥 Bullish breakout level X 3 Swing Retest
• 3345 – Strong resistance (tested 5 times)
• 3270 – Equal lows
• 3370 – Equal highs

Snipers Only: Gold's Next Killzone Is LIVE – Eyes on 3295 -3373🔍 Macro + Context:
Gold continues to dance between uncertainty and calculated aggression. After rejecting cleanly from the premium zone at 3370, price dropped overnight into 3287, fulfilling our sniper buy setup from 3310 and hitting TP2 at 3370 with precision.
Now? Price is hovering at 3298, teasing a bigger directional play as we head into NY session. With inflation jitters, geopolitical undercurrents, and mixed USD sentiment, gold remains a reactionary beast—not a predictive one. Let structure speak.
📐 Technical Structure:
🧱 H1 Structural Key Levels:
🔸 3370–3376 = Premium Supply Zone – Clean rejection + break of structure
🔸 3345 = Previous lower high – Minor liquidity zone, watch for manipulation
🔸 3310 = Former TP1 & demand flip – Local structural retest
🔸 3285–3287 = Current HL attempt – LTF liquidity pool, key bounce zone
🔸 3233–3237 = HTF Discount OB – HTF demand, possible reversal anchor
🧠 Trend & Flow:
HTF Bias: Bullish (Daily still in higher-low territory)
LTF Flow: Bearish correction within HTF context
BOS/CHoCH: Clear BOS from 3370 to the downside
Liquidity: Swept at 3370 and now resting near 3287 lows
EMAs: LTF bearish slope, but HTF structure intact
RSI: Reset on M15–H1, hinting at potential momentum rebuild
🎯 Sniper Entry Zones (Clean, No Fluff):
🟩 BUY ZONE #1 (Reactive Entry)
3284 – 3288
Structure: H1–H4 Demand + Liquidity Sweep
Confluence: EQ of last push + M15 OB
🟩 BUY ZONE #2 (Deeper Reversal Only)
3233 – 3237
Structure: HTF OB + Untapped Daily Liquidity
🟥 SELL ZONE #1 (Intraday)
3372 – 3376
Structure: M15–H1 OB + Prior HTF Reaction
🟥 SELL ZONE #2 (Extreme Supply Test)
3448 – 3455
Structure: HTF FVG + Upper imbalance
⚠️ Eyes On:
Don’t trust the first breakout above 3345—it’s likely liquidity.
Watch how price reacts around 3295: bounce = bull continuation, crack = deeper dive into 3230s.
Momentum could explode NY session—wait for confirmation and never chase.
💬 Final Message :
Gold’s moving—but so are we.💡If this helped map your zones, smash that ❤️ and drop your bias in the comments. Are you stalking 3285 or waiting to trap sellers at 3370 again? Let’s catch these sniper plays together.
TradingView’s been too quiet lately – if you vibe with clean structure > hopium, show some love and let’s grow this smart gold tribe.
👇👇👇
Smart plans. No fluff. Just logic. Drop a 💡 and let’s connect.

XAUUSD Market Update – April 28, 2025 NY🎯 Quick Context:
Price successfully defended the support + liquidity pocket zone (around 3272–3288).
A bullish intraday reaction followed, but we are still trapped inside a consolidation range for now.
✅ Valid Zones Remaining from Daily Plan:
Support + Liquidity Pocket (3272–3288): ✅ Still active and valid as strong support.
Minor Resistance Level Inside Range (3350–3360): ✅ Remains relevant for possible rejections.
Major Flip + Resistance Zone (3380–3395): ✅ Still untouched and valid — upper upside target if bullish continuation happens.
⚠️ Zones Weakened or Invalidated:
Micro Support 3310–3315: ⚠️ Structure failed to hold cleanly — now treated as a neutral zone (no strong bias here).
Intraday Pivot 3260–3265: ⚠️ Previously breached — weak support for now, not a major focus.
🔥 Possible Scenarios:
Bullish Scenario 🟢
Holding above 3272–3288 = potential rally toward 3310–3315, then 3350–3360.
Solid break and close above 3360 = bullish continuation potential toward 3380–3395.
Bearish Scenario 🔴
Clear loss of 3272–3288 = risk of a sharper selloff toward lower discount zones (~3220–3240).
🧠 Extra Observations:
Current structure = sideways/consolidation between buyers and sellers.
Short-term momentum (M15–M30) is trying to lean bullish but without a confirmed HH yet.
HTF bias (H1–H4) remains slightly bullish as long as price holds above the 3272–3288 support zone.
📢 Final Note:
🏹 Patience is key. Let price react around the zones — we are ready and disciplined to execute based on real confirmation, not emotions.
✨ Final Friendly Message:
"We’ve already done the heavy lifting by marking the battlefield. 🛡️ Now it’s all about patience, precision, and letting Goldie show its next move. 📈✨
Stay sharp, stay humble – and remember: we react, not predict. 🎯
Let’s make this a week where we checkmate the market together! ♟️
If you enjoyed this update, leave a like, drop a comment, or just say hi – you’re part of the GoldFxMinds crew! 🚀💬❤️"

4.28 Latest Gold Market Trend Analysis:
Core Viewpoint:
The gold market has entered a key long-short contention area after a sharp correction. The short-term trend will depend on the breakthrough direction of the 3260-3370 range. Investors are advised to adopt a range trading strategy and focus on the breakthrough of key support and resistance levels.
1. Key fundamental factors
Negative factors:
The US dollar continues to strengthen (the US dollar index rose 0.3%)
The easing of Sino-US trade tensions (China exempted some US goods from tariffs)
Weakened safe-haven demand (global geopolitical risks cooled down)
Potential bullish factors:
Uncertainty about the global economic outlook remains
If the US dollar corrects, it may boost gold prices
Technical buying at key support levels
2. Technical analysis
Daily level:
Key resistance: 3368-3370 (23.6% Fibonacci level)
Key support: 32 60-3280
Trend pattern: consolidation phase after high-level correction
MACD indicator: fast and slow lines cross, indicating short-term bearish
4-hour level:
Moving average system: MA5 (3315) and MA20 (3338) form suppression
Bollinger Band: Price runs below the middle track, and the lower track is supported at 3260
RSI indicator: close to the oversold area, need to be vigilant about technical rebound
3. Key price range
Upper resistance:
Short-term: 3315-3338
Strong resistance: 3343-3353
Key resistance: 3368-3370
Support below:
Short term: 3290-3300
Key support: 3260-3280
Strong support: 3200-3220
IV. Trading strategy suggestions
Interval trading strategy:
Buy low and sell high in the 3280-3330 range
If it breaks above 3330, you can go long with a light position, with a target of 3350-3370
If it breaks below 3280, you can consider going short, with a target of 3260-3220
Breakthrough trading strategy:
If it breaks through 3370, it may start a new round of rise
If it falls below 3260, it may accelerate the decline Go to 3200
Risk control:
Strictly set stop loss (50-80PIPS recommended)
Position control within 5%
Pay attention to the volatility opportunities before and after the opening of the US market every day
V. Focus on events
Economic data:
US GDP data
Federal Reserve interest rate decision
Non-agricultural employment data
Political events:
Progress of China-US trade negotiations
Geopolitical situation in Eastern Europe
News related to the US election
VI. Summary and suggestions
The gold market is currently at a critical turning point, and the large range of 3260-3370 will determine the future medium-term trend. Suggested investors:
Short-term traders: focus on trading opportunities in the 3280-3330 range
Medium-term investors: wait for the breakthrough confirmation of 3260 or 3370 before making a layout
Strict risk management: control positions and set stop losses

SPY/QQQ Plan Your Trade Update : Playing Into The Major BottomThis update highlights what I believe will be the last level of defense for price (support) on the SPY and why it is so important to HEDGE the markets right now.
The upward price move has reached the ULTIMATE HIGH (I believe) and is now moving into a Bullish EPP pattern (shifting into the downward pullback, then it will move into the flagging phase).
This flagging phase will be the deciding move (IMO) related to IF the markets attempt to break upward or downward near the current Fib 50% level.
This is why it is so important to HEDGE all open positions right now.
This battle zone in the markets (near the Fib 50% level) is not a guaranteed move higher or lower. Basically, we are watching the battle take place in live trading.
What we can do is try to rely on the EPP patterns and other formations to help guide us to the highest probable outcome, but we have to stay liquid and fluid as the markets trend.
Right now, I would suggest the breakdown (Major Low) outcome is about 70-80% likely. Thus, the breakaway (upside) outcome may be 20-30% likely based on my analysis.
But that could change if the SPY moves above $555.
Thank you again for all the great comments. I'm trying to help as many traders as I can. But this move to the 50% level is very "indecisive". So, I'm having to rely on Fibonacci Price Theory and other techniques (money management/HEDGING) as a way to protect my capital while I trade.
This is a great example of how you can learn techniques (beyond technical analysis) related to what to do when you really don't know what the markets may do in the near future.
The answer is HEDGE ACTIVE POSITIONS - or pull trades off (even if they are at a loss) and then HEDGE whatever you want to keep active.
No one is going to laugh when you tell them, "I protected my capital by hedging last week" when they are looking at severe losses and you are NOT looking as severe losses.
It is SMART TRADING.
Get some.
#trading #research #investing #tradingalgos #tradingsignals #cycles #fibonacci #elliotwave #modelingsystems #stocks #bitcoin #btcusd #cryptos #spy #gold #nq #investing #trading #spytrading #spymarket #tradingmarket #stockmarket #silver

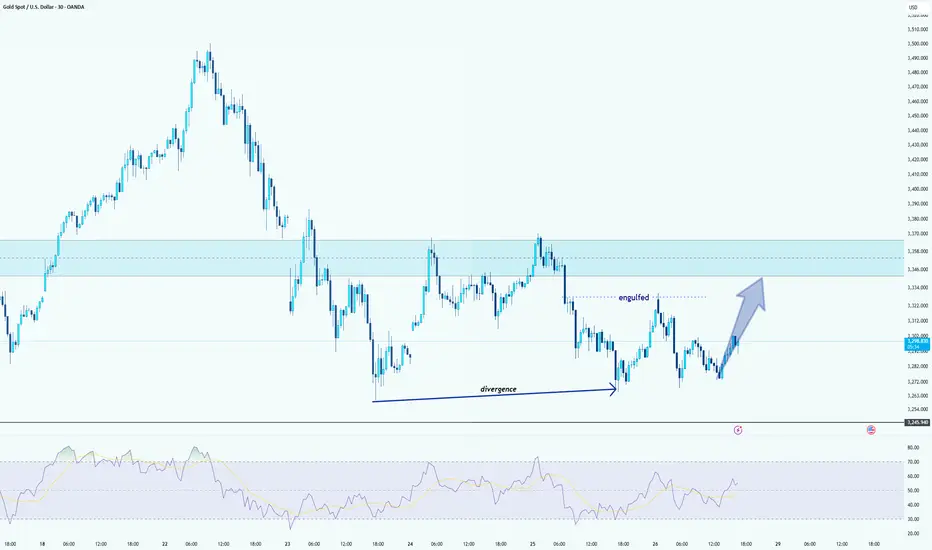
Gold (xauusd) a bullish momentum !hello guys
Let's analyze Gold!
Trend Overview:
The market has been in a downtrend but has recently shown signs of potential reversal.
Key Observations:
Divergence Identified:
A bullish divergence is clearly spotted between the price action and the RSI indicator. While the price made lower lows, the RSI made higher lows, suggesting weakening selling pressure and a possible trend reversal.
Engulfing Pattern:
An important bullish engulfing pattern appeared around the support area, reinforcing the bullish reversal possibility.
Support and Resistance Zones:
The light blue shaded area represents a key resistance zone where price previously consolidated and sold off. This area will likely act as a strong resistance again upon retest.
Expected Movement:
Based on the bullish divergence and engulfing pattern, a move towards the resistance zone is anticipated, as illustrated by the upward arrow on the chart.
GOLD: Target Is Up! Long!
My dear friends,
Today we will analyse GOLD together☺️
The price is near a wide key level
and the pair is approaching a significant decision level of 3,332.62 Therefore, a strong bullish reaction here could determine the next move up.We will watch for a confirmation candle, and then target the next key level of 3,359.49.Recommend Stop-loss is beyond the current level.
❤️Sending you lots of Love and Hugs❤️

GOLD ROUTE MAP UPDATEHey Everyone,
Great start to the week with our chart idea playing out perfectly inline with our plans to buy dips.
We got our bearish targets 3306 and then into the retracement range like we analysed and then the perfect bounce now heading towards our Bullish targets.
We will look for a test and break above 3344 for a continuation or failure to test and lock above this level will se price play back into the lower Goldturns for support.
We will keep the above in mind when taking buys from dips. Our updated levels and weighted levels will allow us to track the movement down and then catch bounces up.
We will continue to buy dips using our support levels taking 30 to 40 pips. As stated before each of our level structures give 20 to 40 pip bounces, which is enough for a nice entry and exit. If you back test the levels we shared every week for the past 24 months, you can see how effectively they were used to trade with or against short/mid term swings and trends.
The swing range give bigger bounces then our weighted levels that's the difference between weighted levels and swing ranges.
BULLISH TARGET
3344
EMA5 CROSS AND LOCK ABOVE 3344 WILL OPEN THE FOLLOWING BULLISH TARGETS
3367
POTENTIALLY 3390
EMA5 CROSS AND LOCK ABOVE 3390 WILL OPEN THE FOLLOWING BULLISH TARGET
3428
EMA5 CROSS AND LOCK ABOVE 3428 WILL OPEN THE FOLLOWING BULLISH TARGET
3458
EMA5 CROSS AND LOCK ABOVE 3458 WILL OPEN THE FOLLOWING BULLISH TARGETS
3478
POTENTIALLY
3503
BEARISH TARGETS
3306 - DONE
EMA5 CROSS AND LOCK BELOW 3306 WILL OPEN THE RETRACEMENT RANGE
3285 - DONE
3259
EMA5 CROSS AND LOCK BELOW 3259 WILL OPEN THE SWING RNGE
3233
3201
EMA5 CROSS AND LOCK BELOW 3201 WILL OPEN THE SECONDARY SWING RANGE
SECONDARY SWING RANGE
3159 - 3112
As always, we will keep you all updated with regular updates throughout the week and how we manage the active ideas and setups. Thank you all for your likes, comments and follows, we really appreciate it!
Mr Gold
GoldViewFX

XAUUSD – Daily Trading Plan – April 28, 2025🎯 Market Outlook:
Gold remains trapped in a corrective range between 3260 and 3380, after an aggressive rally to new all-time highs.
Currently, price is consolidating just below a major supply/flip zone (3380–3395) and above a key support pocket (3260–3280).
HTF (High Timeframe) bias: Still bullish as long as the 3220–3235 pivot holds.
LTF (Lower Timeframe) flow: Sideways, with minor bullish attempts inside the range.
🔥 Key Zones to Watch:
Resistance Zones:
3380–3395 → Major flip and strong resistance zone.
3350–3360 → Minor local resistance inside premium.
Support Zones:
3260–3280 → Major intraday support + liquidity pocket.
3220–3235 → Last pivot to maintain bullish HTF bias (critical for any continuation).
👀 Eyes On:
Price reaction inside 3380–3395 → Will it reject again or break through to unlock 3410–3430?
Weakness signs near 3350–3360 → Watch for potential bull traps if momentum fades.
Respect for 3260–3280 → A bounce from here would confirm buyers still protecting liquidity pockets.
HTF invalidation below 3220 → Would flip the entire structure bearish short-term.
📢 Final Words:
Goldie's playing chess, not checkers — patience and sniper precision will make the difference this week. ♟️✨
Stay sharp, stay smart — we trade real flow, not hopes or dreams.
🔔 Follow the flow, adapt the plan, and let's continue hunting clean moves together!
#Gold #XAUUSD #SmartMoney #MindsetMatters #GoldMindsFX

GOLD falls more than 40 Dollars, widening correction rangeSpot OANDA:XAUUSD unexpectedly accelerated its decline during the Asian trading session on Monday (April 28). The current price of gold is around 3,280 USD/ounce, down more than 40 USD on the day. The price of gold has gradually decreased compared to the intraday high of 3,336.98 USD/ounce reached at the beginning of the trading session.
The easing of trade tensions between China and the United States has weakened gold’s appeal as a safe haven. Gold prices have fallen more than 5% since breaking above $3,500 an ounce last Wednesday.
The latest developments around US-China trade relations and the release of key US macroeconomic data will trigger gold’s near-term price action. Market participants will be closely watching US economic growth and employment data this week.
The latest data from the US Commodity Futures Trading Commission (CFTC) showed that hedge fund managers cut their net long positions in gold futures and options to a 14-month low.
Technical Outlook Analysis OANDA:XAUUSD
On the daily chart, gold has dropped below the raw price of $3,300 and at its current position it could continue to decline further with a short-term target of around $3,245 where the price confluences with the upper edge of the price channel.
Although gold has fallen significantly from $3,500, looking at the overall chart, gold still has bullish conditions with support from EMA21 and the rising price channel as the long-term trend. On the other hand, the down trending RSI is also approaching the 50 level, in this case the 50 level is the closest support at present, indicating that there may not be much room for decline in the short term.
Once gold is back in action above the 0.382% Fibonacci retracement level, it will be in position to rebound with a target of around $3,371 in the short term.
During the day, the bearish correction could continue but will be limited by the EMA21 and the price channel. Along with that, the bearish correction along with the main uptrend will be noticed by the following technical positions.
Support: $3,245 – $3,228 – $3,200
Resistance: $3,292 – $3,371
SELL XAUUSD PRICE 3328 - 3326⚡️
↠↠ Stop Loss 3332
→Take Profit 1 3320
↨
→Take Profit 2 3314
BUY XAUUSD PRICE 3226 - 3228⚡️
↠↠ Stop Loss 3222
→Take Profit 1 3234
↨
→Take Profit 2 3240
