XAUUSD Downtrend Continues- Is 3,175 the Next Stop?OANDA:XAUUSD is currently trading within a well-defined descending channel, with price action consistently forming lower highs and lower lows. This structure reflects sustained bearish momentum, and sellers continue to dominate the overall direction.
The recent upward move appears to be a technical rebound, with price approaching a potential resistance zone near the upper boundary of the channel. This area may now serve as a supply zone after acting as previous support, making it an important region for potential rejection.
If the resistance holds, a rejection here could lead to the continuation of the bearish trend, with a potential move targeting the support area around 3,175, aligning with the lower boundary of the descending channel.
However, failure to hold below this level could invalidate the bearish scenario and increase the likelihood of a retest toward the upper boundary of the channel.
Traders should monitor for clear rejection signals at resistance, such as bearish engulfing candles or strong rejection wicks, or alternatively, wait for breakout confirmation before considering a trend shift. As always, proper risk management remains essential.
Gold

Gold price plummets, short-term analysisLast Friday, driven by hopes of easing global trade tensions, the US dollar index rose, eventually closing up 0.325% at 99.61, ending a four-week losing streak. US Treasury yields continued to fall, with the benchmark 10-year Treasury yield closing at 4.24%; the two-year Treasury yield, which is more sensitive to monetary policy, closed at 3.744%.
Given the cooling of risk aversion and the strength of the US dollar, spot gold fell, hitting a low of 3365.2, and finally closed down 0.9% at 3318.2, marking the first weekly decline since the announcement of the reciprocal tariffs.
Gold did not break through the high of $3370 last Friday, and the trend of falling was triggered! Gold started to fall in the Asian and European sessions, and fell further in the US session to a low of $3265, a single-day drop of more than $100! Very powerful market trend, gold rebounded at the end of the trading day and finally closed at $3317. The weekly line closed with a shooting star with a very long upper shadow line. After such a pattern, gold has the need to continue to correct. At the beginning of the week, gold rebounded and continued to short. Today, gold focuses on the upper resistance at $3352. Rebound and continue to short below this resistance. Look at the $3320 and $3300 levels below. If it falls below, look at the $3270 level!
Overall, today's short-term operation strategy for gold is mainly based on rebounding high altitudes. The upper short-term focus is on the 3370-3380 resistance line, and the lower short-term focus is on the 3330-3320 support line.
Buy range: 3260-3258, SL: 3248, TP: 3280-3290
Sell range: 3310-3312, SL: 3322, TP: 3280-3270
First support: 3260, second support: 3250, third support: 3240
First resistance: 3310, second resistance: 3320, third resistance: 3330

Gold maintains bullish mindsetThere is a fierce game between bulls and bears in gold prices, but we remain bullish in the long term. The intraday layout follows the general trend and focuses on the gains and losses of the 3260 support below. As long as it remains above 3260, we will maintain our bullish outlook and wait for the gold price to fall slightly to around 3275 before we can intervene and go long in batches!
Gold is long near 3275, stop loss 3260, target 3300
XAUUSD H4 | Bullish Bounce OffBased on the H4 chart analysis, the price is falling toward our buy entry level at 3245.68, a pullback support.
Our take profit is set at 3314, an overlap resistance
The stop loss is placed at 3212.68, a swing low support.
High Risk Investment Warning
Trading Forex/CFDs on margin carries a high level of risk and may not be suitable for all investors. Leverage can work against you.
Stratos Markets Limited (tradu.com):
CFDs are complex instruments and come with a high risk of losing money rapidly due to leverage. 63% of retail investor accounts lose money when trading CFDs with this provider. You should consider whether you understand how CFDs work and whether you can afford to take the high risk of losing your money.
Stratos Europe Ltd (tradu.com):
CFDs are complex instruments and come with a high risk of losing money rapidly due to leverage. 63% of retail investor accounts lose money when trading CFDs with this provider. You should consider whether you understand how CFDs work and whether you can afford to take the high risk of losing your money.
Stratos Global LLC (tradu.com):
Losses can exceed deposits.
Please be advised that the information presented on TradingView is provided to Tradu (‘Company’, ‘we’) by a third-party provider (‘TFA Global Pte Ltd’). Please be reminded that you are solely responsible for the trading decisions on your account. There is a very high degree of risk involved in trading. Any information and/or content is intended entirely for research, educational and informational purposes only and does not constitute investment or consultation advice or investment strategy. The information is not tailored to the investment needs of any specific person and therefore does not involve a consideration of any of the investment objectives, financial situation or needs of any viewer that may receive it. Kindly also note that past performance is not a reliable indicator of future results. Actual results may differ materially from those anticipated in forward-looking or past performance statements. We assume no liability as to the accuracy or completeness of any of the information and/or content provided herein and the Company cannot be held responsible for any omission, mistake nor for any loss or damage including without limitation to any loss of profit which may arise from reliance on any information supplied by TFA Global Pte Ltd.
The speaker(s) is neither an employee, agent nor representative of Tradu and is therefore acting independently. The opinions given are their own, constitute general market commentary, and do not constitute the opinion or advice of Tradu or any form of personal or investment advice. Tradu neither endorses nor guarantees offerings of third-party speakers, nor is Tradu responsible for the content, veracity or opinions of third-party speakers, presenters or participants.

$SPX Sell in May, Go Away, $5k, Dead Cat to $5.3k, $4.8k by EOMAlrighty. My forecast is as follows. I made a video explaining just a quick thought and here's the video in a written version for the most part. Basically, I'm a pattern chart trader and I spend the majority of my days looking for specific candlestick patterns that match candle for candle. I cannot find anything remotely close to today's Price Action besides October 2001. I have been and will continue to be doubted and that's okay. I am not here for anyone except myself and anyone that wants to gain a fresh unbiased perspective. People have called me a Permabear but that only pertains to my personality, which is that of a realist. I do not believe investing for the next 20-50 Years will work for everyone. You'd have to do it well and continuously contribute even during the down days. Either way. This is the analog I will be following. Fib is Extended way beyond Blow Off Top measurements imo. The market gained 50% in One Year and Three Months. I'd like to think that the uncertainty being priced in will cause these Deeper Fib Retracements. We already crashed down to the 1.61 GOLDEN POCKET from above and now bounce back to Secon Golden Pocket at 2.61. Based on the past behavior, now we move back to 2.0 for a move to the original extension of the 1.00 Fib. If we lose this, we start moving back to the 1.27 near $4.74k on SPX where I will then be looking for one final dead cat to $5300 by mid August, Every July dip being grabbed up ... Final Sell in August for an End of Year Crash to Mark 2025 as one of the worst years ever in Life as far as the Market goes. Good Luck everyone. Tips always welcome.

28 Apr - XABCD Pattern Signals Potential UpsideRecently, the expected Head and Shoulders pattern seems to be delayed — and possibly invalidated — as buyers successfully defended the line at $3,287, pushing the price up to $3,319 on Friday. As a result, a new bullish setup has emerged.
On the 1-hour chart, an XABCD harmonic pattern has clearly formed, offering two upside targets:
Target 1: $3,367
Target 2: $3,435
On the downside, $3,260 is now acting as the critical level. A break below this point could open the door for lower prices.
For now, the bias is long until Target 1 at $3,367 is reached. Traders should monitor short-term sentiment closely: if signs of weakness or a shift appear, the price could reverse earlier.
Important to note: the Head and Shoulders pattern remains a risk if price falls below $3,260 after reaching $3,370 and moves toward the neckline at $3,237.
📍 Summary:
Idea: Go long toward $3,367.
Risk: Head and Shoulders pattern could still complete if bearish momentum returns.
Stay sharp and manage your risk accordingly!
-------------------------------------------------------------------------
This is just my personal market idea and not financial advice! 📢 Trading gold and other financial instruments carries risks – only invest what you can afford to lose. Always do your own analysis, use solid risk management, and trade responsibly.
Good luck and safe trading! 🚀📊

Weekly Market Forecast: Buy Stocks! Sell Oil! Buy Gold!In this video, we will analyze the S&P 500, NASDAQ, DOW JONES, Oil, Gold and Silver futures, for the week of April 28 - May 2nd.
Markets are looking tradeable again.
The indices look bullish, creating +FVGs as they move higher.
Oil has corrected a bearish impulse, so it could be poised to move lower from the Daily and Weekly -FVG.
Gold took a breather last week and could move higher from the Weekly +FVG it just created.
Let's go!
Enjoy!
May profits be upon you.
Leave any questions or comments in the comment section.
I appreciate any feedback from my viewers!
Like and/or subscribe if you want more accurate analysis.
Thank you so much!
Disclaimer:
I do not provide personal investment advice and I am not a qualified licensed investment advisor.
All information found here, including any ideas, opinions, views, predictions, forecasts, commentaries, suggestions, expressed or implied herein, are for informational, entertainment or educational purposes only and should not be construed as personal investment advice. While the information provided is believed to be accurate, it may include errors or inaccuracies.
I will not and cannot be held liable for any actions you take as a result of anything you read here.
Conduct your own due diligence, or consult a licensed financial advisor or broker before making any and all investment decisions. Any investments, trades, speculations, or decisions made on the basis of any information found on this channel, expressed or implied herein, are committed at your own risk, financial or otherwise.

The relationship between gold, copper and the US10YFirst, can you tell me what you think the relationship between these two curves is? Clearly, these two curves have a strong negative correlation, meaning they move exactly opposite to each other. You can see in the image that their behavior is like a mirror image (from 2007 to before 2022).
You are familiar with the gold-to-copper ratio, right? Now, when this gold-to-copper ratio curve rises, it means that gold is giving better returns compared to copper. This indicates that the global economy is moving away from growth and heading toward a recession. Investors, instead of investing in production (where copper symbolizes production), choose to invest in a safe haven like gold. The opposite happens when this curve goes down.
The lower curve represents the yield on long-term U.S. bonds. When this curve is rising, it means that the supply of bonds is greater than the demand. People are selling bonds, which causes the bond yield to rise. When the curve is falling, it means people are buying bonds, which causes the bond yield to drop.
Why do these two curves move in opposite directions?
Now, let’s get to the main question. The answer to this question is simple: bonds, like gold, serve as a safe haven for investors. When the economy moves toward a recession (when gold offers better returns than copper, and the gold-to-copper ratio is rising), some investors shift towards bonds, and the yield curve drops. That’s why these two curves move in opposite directions.
To summarize the entire story: Movement toward recession = investors moving toward gold and bonds = rise in the gold-to-copper ratio and drop in bond yield curve.
Now it’s clear why these two curves move opposite to each other. The big surprise is coming👇
Since the beginning of 2022, the historical trend has changed. These two curves have started to show a positive correlation! Meaning, everything I mentioned above has gone out the window! Now, the question is: What suddenly happened? There are several analyses, but I believe what changed is that U.S. bonds are no longer a safe haven for investors, as they once were (the same fear signal I mentioned earlier). In fact, after the pandemic, the world has never been the same. This is an important development and it affects many things. I’ve addressed this topic from various perspectives before, and here’s a new angle on it.
For the past two to three years, contrary to the historical trend, investors have been buying gold but selling bonds, and these two curves have been rising together.
As you can see, the analytical situation has changed drastically compared to, say, 10 years ago, and many fundamental facts have shifted. For instance, many people expect the Federal Reserve to lower interest rates and gold to go up again, but after an initial short shock, the story will probably reverse.
#Gold #XAUUSD #HG1!

GOLD WEEKLY - Key Events to Watch: ADP, Core PCE, Non-Farm📌 Weekly Gold Outlook – Key Events to Watch: ADP, Core PCE, Non-Farm Payrolls 📉📈
🌍 Fundamental Overview
Last week, gold faced heavy selling pressure after failing to sustain its rally above the $3,450 level. Easing concerns over the US–China trade tensions and a stronger US Dollar — supported by stronger-than-expected Durable Goods Orders — triggered a sharp correction in Price.
The US Federal Reserve (Fed) continues to adopt a cautious stance, awaiting clearer economic data before adjusting its monetary policy. Meanwhile, recent figures from both the US and China show signs of economic resilience, reducing safe-haven demand for gold in the short term.
Key Events This Week:
ADP Non-Farm Employment Change
Core PCE Price Index m/m
Non-Farm Payrolls (NFP)
Volatility is expected to rise sharply as these major economic indicators are released.
📊 Technical Analysis – XAU/USD 2H Chart
Gold is currently undergoing a corrective phase after its strong rally earlier this month. Price is forming a descending channel and consolidating around critical support and resistance zones.
Immediate Resistance: 3,325 – 3,377
Immediate Support: 3,275 – 3,235
As long as Price remains capped below 3,325, the bearish bias will remain dominant.
🧩 Main Scenarios for This Week
Short-Term Rebound:
Price may retest the 3,275–3,277 area before sellers regain control.
Medium-Term Bearish Pressure:
If Price fails to reclaim the 3,325 resistance zone, it could break lower toward 3,235, 3,197, and potentially deeper into the 3,108 or 3,066 liquidity zones.
Bullish Reversal Scenario:
A sustained breakout and close above 3,377 would invalidate the bearish outlook and suggest a move toward the 3,420 target.
🔍 Key Price Zones for This Week
Resistance: 3,325 → 3,377 → 3,420
Support: 3,275 → 3,235 → 3,197 → 3,108 → 3,066
🧠 Suggested Trading Strategy
Prefer short positions when Price retraces toward the 3,275 – 3,325 resistance zone, aiming for downside targets at 3,235 and 3,197.
Be cautious with long positions: only consider buying if Price drops deeply into 3,108 or 3,066 and shows strong support reaction.
⚡ Note:
Given the upcoming releases of ADP, Core PCE, and Non-Farm Payrolls, the market is expected to experience significant volatility.
Stay disciplined and await detailed intra-week updates around key event times.

GOLDGold needs more upside, next reaction we will see is above 3390 and if it corrects there than further upside can also follow.
Disclosure: We are part of Trade Nation's Influencer program and receive a monthly fee for using their TradingView charts in our analysis.

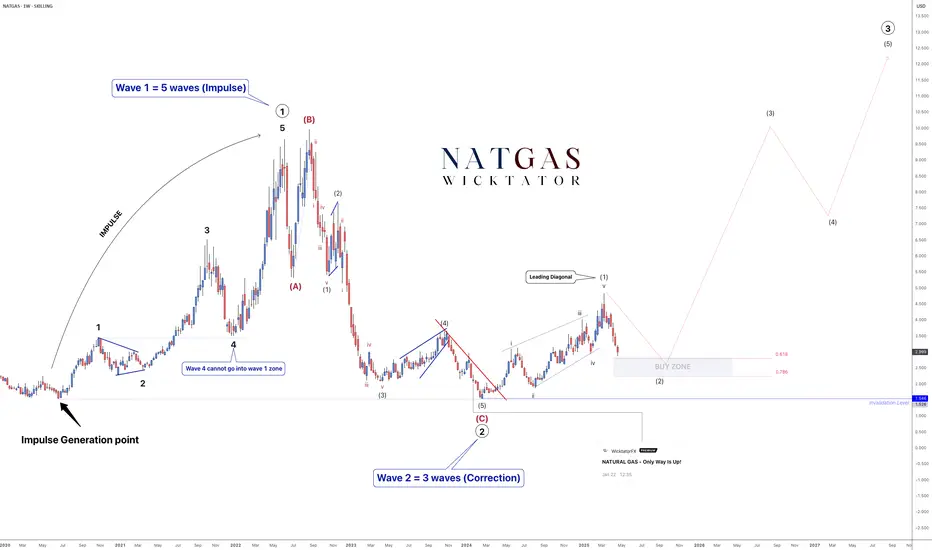
NATGAS Elliott Waves – Preparing for a Multi-Year Rally!Following our last post on Natural Gas, we have now seen a breakout, suggesting the start of a larger bullish wave — a move that could last multiple years.
From a technical perspective:
- Wave 1 (5-wave impulse) is complete.
- Wave 2 (ABC correction) is also complete.
- We are now in Wave 3, which itself will form 5 subwaves.
Wave 3:
Subwave 1 of Wave 3 has formed as a leading diagonal.
We are now in Subwave 2, which typically retraces around 61.8% of Subwave 1.
Our buy zone is positioned around this retracement area, and we will be looking for a lower timeframe breakout to confirm entries.
Important note:
Subwave 2 could form a more complex ABC correction, so patience is required while it develops.
Trade Plan:
- Wait for price to reach the buy zone.
- Look for lower timeframe bullish confirmation (trendline break, BOS, structure shift, etc.).
- Enter after confirmation.
Stoploss Placement:
- Aggressive option: Below the corrective low.
- Conservative option: Below the broader invalidation level.
Targets: 8, 10, 12
See below for our last NatGas analysis:
XAUUSD – Weekly Outlook (April 28 – May 3)XAUUSD – Weekly Outlook (April 28 – May 3)
Current Structure:
Massive bullish momentum intact — we are still climbing into extreme premium territory.
Price has broken all previous structure highs and is trading well above the last known CHoCH (confirmed weekly bullish flow).
Current Weekly candle is showing minor exhaustion but no clear reversal confirmation yet.
Key Weekly Observations:
Premium Zone: 3350–3500 → extreme overbought territory, where distribution/reversal could begin forming.
Immediate Support: 3110–3150 → previous major liquidity grab + breakout area (could act as reaccumulation if retested).
Unmitigated Zones Below:
~2900–2950 → old FVG left behind (possible bounce if deeper correction happens).
Strong demand clusters still much lower, around 2050–2100 (only relevant if a major cycle shift occurs).
Liquidity and Flow:
Liquidity has been swept above all major highs — now hunting for fresh liquidity pools either at extreme highs (above 3350) or deeper below (below 3200).
Strong liquidity vacuum between 3280 and 3150 zones if a weekly rejection happens.
Bias:
Still bullish but hyper-extended — smart money will likely start hunting liquidity pockets on both sides soon.
Watching for early signs of weekly exhaustion or topping (large wicks, strong engulfing candle).
✅ Weekly Bias: Cautious bullish, watching for early topping patterns
✅ Key Levels to Watch: 3350–3500 (resistance), 3150–3110 (support)
🌟 Final Note for the Community:
We’re flying at premium altitudes — but don’t get drunk on heights! 🛫 Stay sharp, stay humble. Gold doesn’t ask, it takes. Let’s keep mastering the game, one sniper move at a time.
👉 Follow, like, and comment your outlook — let’s grow this smart community together! 🚀✨
#Gold #XAUUSD #SmartMoney #WeeklyOutlook

GOLD 1H CHART ROUTE MAP & TRADING PLAN FOR THE WEEKHey Everyone,
Please see our updated 1h chart levels and targets for the coming week.
We are seeing price play between two weighted levels with a gap above at 3344 and a gap below at 3306. We will need to see ema5 cross and lock on either weighted level to determine the next range. EMA5 is lagging below 3306 so will need a close above and then below to confirm.
We will see levels tested side by side until one of the weighted levels break and lock to confirm direction for the next range.
We will keep the above in mind when taking buys from dips. Our updated levels and weighted levels will allow us to track the movement down and then catch bounces up.
We will continue to buy dips using our support levels taking 30 to 40 pips. As stated before each of our level structures give 20 to 40 pip bounces, which is enough for a nice entry and exit. If you back test the levels we shared every week for the past 24 months, you can see how effectively they were used to trade with or against short/mid term swings and trends.
The swing range give bigger bounces then our weighted levels that's the difference between weighted levels and swing ranges.
BULLISH TARGET
3344
EMA5 CROSS AND LOCK ABOVE 3344 WILL OPEN THE FOLLOWING BULLISH TARGETS
3367
POTENTIALLY 3390
EMA5 CROSS AND LOCK ABOVE 3390 WILL OPEN THE FOLLOWING BULLISH TARGET
3428
EMA5 CROSS AND LOCK ABOVE 3428 WILL OPEN THE FOLLOWING BULLISH TARGET
3458
EMA5 CROSS AND LOCK ABOVE 3458 WILL OPEN THE FOLLOWING BULLISH TARGETS
3478
POTENTIALLY
3503
BEARISH TARGETS
3306
EMA5 CROSS AND LOCK BELOW 3306 WILL OPEN THE RETRACEMENT RANGE
3285
3259
EMA5 CROSS AND LOCK BELOW 3259 WILL OPEN THE SWING RNGE
3233
3201
EMA5 CROSS AND LOCK BELOW 3201 WILL OPEN THE SECONDARY SWING RANGE
SECONDARY SWING RANGE
3159 - 3112
As always, we will keep you all updated with regular updates throughout the week and how we manage the active ideas and setups. Thank you all for your likes, comments and follows, we really appreciate it!
Mr Gold
GoldViewFX

GOLD 4H CHART ROUTE MAP UPDATE & TRADING PLAN FOR THE WEEKHey Everyone,
Please see our updated 4h chart levels and targets for the coming week.
We are seeing price play between two weighted levels with a gap above at 3343 and a gap below at 3282. We will need to see ema5 cross and lock on either weighted level to determine the next range. We have a bigger range in play then usual.
We will see levels tested side by side until one of the weighted levels break and lock to confirm direction for the next range.
We will keep the above in mind when taking buys from dips. Our updated levels and weighted levels will allow us to track the movement down and then catch bounces up.
We will continue to buy dips using our support levels taking 30 to 40 pips. As stated before each of our level structures give 20 to 40 pip bounces, which is enough for a nice entry and exit. If you back test the levels we shared every week for the past 24 months, you can see how effectively they were used to trade with or against short/mid term swings and trends.
BULLISH TARGET
3343
EMA5 CROSS AND LOCK ABOVE 3343 WILL OPEN THE FOLLOWING BULLISH TARGET
3404
EMA5 CROSS AND LOCK ABOVE 3404 WILL OPEN THE FOLLOWING BULLISH TARGET
3439
EMA5 CROSS AND LOCK ABOVE 3439 WILL OPEN THE FOLLOWING BULLISH TARGET
3503
BEARISH TARGETS
3282
EMA5 CROSS AND LOCK BELOW 3282 WILL OPEN THE FOLLOWING BEARISH TARGET
3224
EMA5 CROSS AND LOCK BELOW 3224 WILL OPEN THE SWING RANGE
SWING RANGE
3190 - 3138
EMA5 CROSS AND LOCK BELOW 3138 WILL OPEN THE SECONDARY SWING RANGE
SECONDARY SWING RANGE
3088 - 3046
As always, we will keep you all updated with regular updates throughout the week and how we manage the active ideas and setups. Thank you all for your likes, comments and follows, we really appreciate it!
Mr Gold
GoldViewFX

GOLD DAILY CHART ROUTE MAP UPDATEHey Everyone,
Here’s the latest update on our daily chart idea, it’s been playing out perfectly!
After we got the close above 3297, the gap up to 3433 completed exactly as we had analysed. However, without a further close or lock above 3433, the rejection was confirmed with a wick, and price then found support above the channel top, just as we always highlight.
With EMA5 still holding above the channel top, we’re likely to continue seeing support and price action playing above the channel. This opens the door for another retest of 3433. However, if price breaks back inside the channel along with EMA5, the levels inside the channel will reactivate for level-to-level plays.
This is the beauty of our Goldturn channels, drawn using weighted averages instead of pure price action. This unique approach helps us clearly identify fake-outs and real breakouts, cutting out much of the noise that usually confuses traders.
Moving forward, we’ll focus on smaller timeframes (1H and 4H) to buy dips off the weighted Goldturns, aiming for clean 30–40 pip moves. Ranging markets are perfect for this style, allowing us to capitalize on quick moves without getting caught in the chop of larger swings.
Thank you all again for your continued likes, comments, and follows, we truly appreciate your support!
Mr Gold
GoldViewFX

GOLD WEEKLY CHART MID/LONG TERM ROUTE MAPHey Everyone,
Quick update on our weekly chart idea, it's been playing out beautifully, helping us track the move down and catch the move back up.
After hitting our final channel top target at 3281, we mentioned we would look for support forming above the channel. That’s exactly what happened, with price finding support outside the channel and giving us the bounce we anticipated.
We also got a body close above 3281, which completed the gap up to 3387. From here, we'll be watching for continued support above the channel, a retest of 3387, and a close above it to confirm the continuation higher.
If we fail to retest and close above 3387, we’ll likely see a reset back to the channel top. Should that support fail, we would expect a break of the EMA5 back into the channel, resetting the play inside the channel with all previous levels back in play.
This is the beauty of our Goldturn channels, drawn using weighted averages instead of pure price action. This unique approach helps us clearly identify fake-outs and real breakouts, cutting out much of the noise that usually confuses traders.
Moving forward, we’ll focus on smaller timeframes (1H and 4H) to buy dips off the weighted Goldturns, aiming for clean 30–40 pip moves. Ranging markets are perfect for this style, allowing us to capitalize on quick moves without getting caught in the chop of larger swings.
Thanks again for all your likes, comments, and follows, we really appreciate the support!
Mr Gold
GoldViewFX

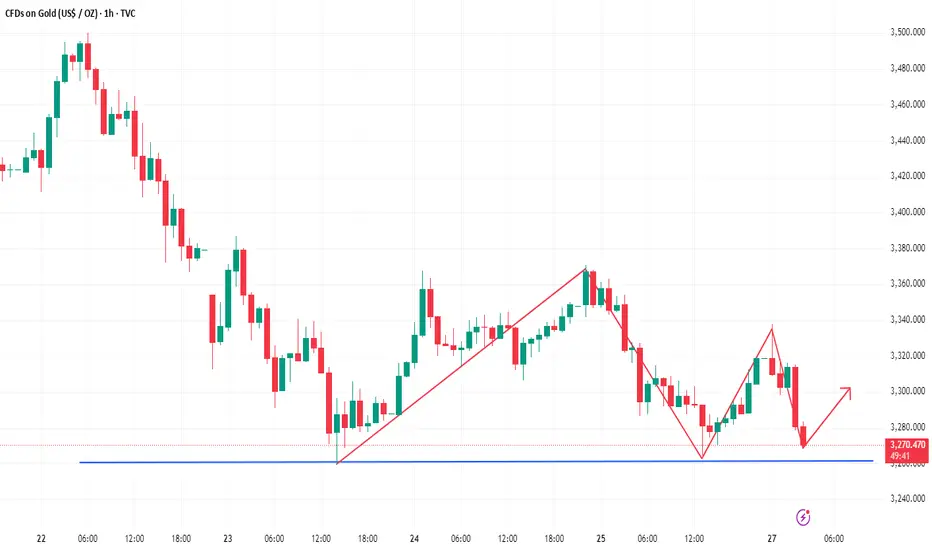
XAUUSD - All Eyes on the Reaction Zone for Directional ClarityThe Gold Spot price chart shows a clear potential for price movement toward the highlighted reaction area between approximately $3,360 and $3,380. After reaching highs around $3,500 on April 22, gold has experienced a significant correction, forming a series of lower highs and lows. The current price action suggests that gold may be preparing for a rebound toward this critical reaction zone, as indicated by the upward green arrow. Once gold reaches this reaction area, traders will need to closely monitor price behavior for confirmation of whether this represents a temporary bounce in a larger downtrend or the beginning of a new push toward previous highs. Key technical indicators at this level will determine if gold has enough momentum to break through resistance and potentially retest recent highs, or if sellers will emerge again, forcing another leg down toward recent support levels around $3,270-$3,280.
Disclosure: I am part of Trade Nation's Influencer program and receive a monthly fee for using their TradingView charts in my analysis.

GOLD weekly outlook Part 2Explaining the scenarios. DO's and DONT's. Time windows. Back testing with Proper explanation and Timeframe Alignment

Forex Grid Trading Overview: Practical Guide for 2025Forex Grid Trading Strategy: Detailed Overview & Low-Risk EUR/USD Application
1️⃣ What Is Grid Trading?
A grid trading strategy places a series of **buy** and **sell** orders at fixed intervals (“grid levels”) above and below a base price, without forecasting market direction. As price oscillates, it triggers orders across the grid, locking in small profits on each swing.
- **No Directional Bias** – Profits on both up- and down-moves
- **Automated Entry/Exit** – Ideal for Expert Advisors (EAs) on MT4/MT5
- **Scalable** – Grid size and lot sizing can be tailored to account size and volatility
2️⃣ How It Works – Core Components
1. **Grid Levels**
- Define a **base price** (e.g. current EUR/USD mid)
- Set **intervals** (e.g. every 20 pips) above/below the base
2. **Orders**
- **Buy Limit** orders at 20, 40, 60 pips below base
- **Sell Limit** orders at 20, 40, 60 pips above base
3. **Take Profit (TP) for Each Order**
- TP typically equals the grid interval (e.g. 20 pips) so each triggered order nets a small profit
- No hard Stop Loss per order—risk is managed via overall exposure
4. **Cumulative P&L**
- Winning trades roll profits into the floating drawdown of unfilled orders
- As price oscillates, the grid “locks in” incremental gains
3️⃣ Pros & Cons
| Pros | Cons |
|---------------------------------------|------------------------------------------|
| ✅ Profits in ranging markets | ❌ Can incur large drawdowns in strong trends |
| ✅ Automated, systematic execution | ❌ Requires significant margin for multiple open trades |
| ✅ Scalable to any time-frame | ❌ Floating negative exposure if grid one-sided |
---
✅Low-Risk Best Practices
1. **Grid Spacing & Width**
- Wider grid intervals (e.g. 30–50 pips) reduce order density and margin use
- Use **ATR** (Average True Range) to adapt spacing to EUR/USD volatility
2. **Lot Sizing & Equity Risk**
- Risk ≤ 1–2% equity per full grid cycle
- Use **fixed fractional** sizing: each order size = (Equity × 1%) / (max number of open grid orders)
3. **Drawdown Control**
- **Maximum Open Orders** cap (e.g. 5 orders per side)
- **Equity Stop-Out**: if floating drawdown exceeds e.g. 10% of equity, close all orders
4. **Trend Filters**
- Use a **200-period SMA** or **ADX** filter: only enable sell grid if price < SMA (downtrend) or ADX < 25 (low momentum)
- Disables grid in strong one-way trends
5. **Grid Shifting / Re-Base**
- After a net grid profit, **shift** the base price to current mid to reset exposure
- Prevents runaway open trades far from current price
5️⃣ Step-by-Step: Applying to EUR/USD
1. **Choose Time-Frame**
- **H4 or H1** recommended: balances signal frequency and margin needs
2. **Define Grid Parameters**
- **Base Price:** current EUR/USD mid (e.g. 1.0980)
- **Interval:** 30 pips (≈ recent ATR on H4)
- **Levels:** 3 buys at 1.0950 / 1.0920 / 1.0890; 3 sells at 1.1010 / 1.1040 / 1.1070
3. **Set Order Size**
- Account equity $10 000, risk 1% = $100 per full grid
- Max open orders 6 → each order $100/6 ≈ $16.7 → ≈ 0.02 lots
4. **Configure TP & No SL**
- Each order TP = 30 pips (equals interval)
- No per-order SL; overall drawdown managed by equity stop
5. **Implement Filters**
- Only open **sell** grid if H4 close < 200-SMA; only open **buy** grid if H4 close > 200-SMA
- Pause grid if ADX > 30 (strong trend) or market events (e.g. NFP, ECB rate decision)
6. **Deploy & Monitor**
- Run on MT4 with an EA or semi-automated Expert Advisor
- Monitor margin usage; adjust grid or disable before major news
6️⃣ Example P&L Mechanics
| Trigger Price | Order Type | Entry | TP Target | Profit (pips) |
|---------------|------------|---------|-----------|---------------|
| 1.0950 | Buy Limit | 1.0950 | 1.0980 | 30 |
| 1.0980 | Sell Limit | 1.0980 | 1.1010 | 30 |
- If price moves down to 1.0950: buy executes, TP at 1.0980 nets +30 pips
- If price then climbs above base, sells trigger at 1.1010 nets +30 pips
2️⃣ Introducing Progressive & Regressive Scaling
🔼 2.1 Progressive Scaling
“Let winners run”—increase exposure after success
Concept: After each profitable grid cycle, step up your lot size by a fixed increment.
Why: Capitalizes on momentum and winning streaks.
How to apply:
Base Lot: 0.02 lots per order (1% equity risk).
After grid closes net-positive, next cycle = 0.03 lots.
Continue stepping up (0.04, 0.05 …) until a drawdown or equity-stop is hit.
Reset back to base lot after a losing cycle or whenever floating drawdown > 5%.
Caps & Safeguards:
Max Lot Cap: Never exceed 0.10 lots (or 2% equity risk).
Equity Stop: If floating drawdown > 10%, close cycle & reset.
🔽 2.2 Regressive Scaling
“Protect the downside”—reduce exposure after losses
Concept: After a losing grid cycle, step down your lot size to conserve capital.
Why: Limits damage during rough periods and preserves margin.
How to apply:
Base Lot: 0.02 lots per order.
If grid hits equity-stop or nets negative, next cycle = 0.015 lots.
Continue stepping down (0.01, 0.005) until you record a net-positive cycle.
Reset to base lot after recovery (e.g. two consecutive winning cycles).
Thresholds:
Don’t drop below 0.005 lots (to avoid over-shrinking).
After two winning cycles at reduced lot, return to base.
✅ Bottom Line
Forex grid trading on EUR/USD can generate steady gains in choppy markets—but demands **strict risk controls** (grid spacing, lot sizing, drawdown limits) and **trend filters** to avoid large losses in trending conditions. When properly applied, a low-risk grid on EUR/USD offers a robust, mostly hands-off strategy for capturing repetitive market swings.
4️⃣ Key Takeaways
Progressive Scaling lifts lot sizes on winning streaks, amplifying gains—but must be capped and reset on losses.
Regressive Scaling shrinks exposure after drawdowns, preserving capital until the strategy recovers.
Combine both with your grid’s risk parameters, trend filter, and a solid equity-stop to maintain a balanced, low-risk EUR/USD grid.
By layering scaling rules atop your grid, you adapt dynamically to market performance—maximizing winners and protecting against prolonged losing runs. Good luck! 🚀

GOLD weekly outlook Part 1
COMEX:GC1!
Weekly Power of Three. Explained the overall price action how it moved why it moved. Different timings involved for the displacement

GOLD (XAUUSD): Very Bullish Setup
Gold closed on Friday in a strong bullish mood.
The price started to rise after a test of the underlined blue
support cluster.
A breakout of a resistance line of a falling channel on an hourly
provides a strong intraday confirmation.
I expect a rise at least to 3439
❤️Please, support my work with like, thank you!❤️
I am part of Trade Nation's Influencer program and receive a monthly fee for using their TradingView charts in my analysis.

GOLD WILL GO FURTHER UP|LONG|
✅GOLD fell again to retest the support
But it is a strong key level
So as we are seeing a bullish
Rebound already I think that there is a high chance
That we will see a bullish rebound and a move up
LONG🚀
✅Like and subscribe to never miss a new idea!✅
Disclosure: I am part of Trade Nation's Influencer program and receive a monthly fee for using their TradingView charts in my analysis.

GOLD REMAINS BULLISH ON LOWER TIMEFRAME - H4Despite posting the weekly indecision on gold, the metal remains bullish on the lower timeframe like H4 which is yet to break it's bullish structure. And with the rejection followed by the bullish candle before the close last trading week, XAUUSD likely will continue to rally up when market opens for trade next week.
N.B!
- XAUUSD price might not follow the drawn lines . Actual price movements may likely differ from the forecast.
- Let emotions and sentiments work for you
- ALWAYS Use Proper Risk Management In Your Trades
#gold
#xauusd
