$GLD short term top in $260-148 target on the downsideAMEX:GLD looks a bit extended here. I could see the possibility of GLD falling back to the $260 support at a minimum and maximum all the way down to $148
The $209 support would be the 50% retracement of the recent run. I like that as a level for a bounce.
Let's see where we end up.
Gold

BTC or Gold?Answer Gold!
The BTC/Gold ratio is on the verge of cracking here.
A crack here will trigger a sell-off in BTC relative to Gold.
This is a very simple, low risk, ratio trade.

eurusd h1 best level to buy/hold +140 pips🏆 EURUSD Market Update
📊 Technical Outlook
🔸Short-term: BEARS 1280
🔸Mid-term: BULLS 1420
🔸Status: REVERSAL from S/R
🔸pullback in progress right now
🔸expecting bounce at key s/r
🔸Price Target Bears: 1280
🔸Price Target BULLS: 1420
🔸strategy: BUY LOW exit 1420
🔸+140 pips on BUY side

Gold extends slump as risk assets rallyGold has extended its slump, now off by more than $230 (-6.5%) from yesterday's record high of $3.5K. Unwinding of "Sell America" trades continue as risk assets rally on Trump's trade optimism.
Key levels to watch
With short-term support broken at $3,342, this level has already turned into resistance.
The next support was at $3,284. This level has just been taken out. Therefore, we could this level turn into resistance in the next few hours.
Untested old resistance at $3,245 is now the next downside objective. Below that $3,200 and then $3,167 (old resistance).
How to trade gold?
Trade gold from level to level, as it unwinds from significantly overbought levels. Could be a while before it starts trending higher again. Equally, given the long-term bullish trend, the bears should be looking to book profit some profit at every potentially key support.
By Fawad Razaqzada, market analyst with FOREX.com

GOLD - $6,200+ BULL RUN?! (MONTHLY TF)I believe we’re in for another huge bull run towards Wave 5 ($6,200), after a Wave 4 correction towards $2,800. Waiting on a final move down to liquidate late buyers.
Confluences👇
⭕️Wave 3 Peaked at Psychological Number of $2,500 (LQ Point).
⭕️Wave 4 & 5 Pending.
⭕️Overbought Market Conditions.

Hanzo | Gold15 min Breaks – Will Confirm the Next Move🆚 Gold – Hanzo’s Strike Setup
🔥 Timeframe: 15-Minute (15M)
———————
💯 Main Focus: Bearish after Breakout at 3290
We are watching this zone closely.
📌 If price breaks with high volume, it confirms Smart Money is in control, and a strong move may follow.
💯 Main Focus: Bullish after Breakout at 3360
We are watching this zone closely.
📌 If price breaks with high volume, it confirms Smart Money is in control, and a strong move may follow.
———
🩸 15M Time Frame Analysis
CHoCH & Liquidity Grab
—
CHoCH & Liquidity Grab @ 3440
CHoCH & Liquidity Grab @ 3470
Strong Rejection from 3100 – The Ultimate Pivot
Strong Rejection from 3240 – The Ultimate Pivot
Strong Rejection from 3200 – The Ultimate Pivot
🔥Key Level / Equal Area
—
Key Level / Equal lows Formation - 3195
Key Level / Equal High Formation - 3245
X6 Retest Valid Key level - 3239
X6 Retest Valid Key level - 3212
👌 The Market Has Spoken – Are You Ready to Strike?

GOLD - $6,200+ BULL RUN?! (MONTHLY TF)I believe we’re in for another huge bull run towards Wave 5 ($6,200), after a Wave 4 correction towards $2,800. Waiting on a final move down to liquidate late buyers.
Confluences👇
⭕️Wave 3 Peaked at Psychological Number of $2,500 (LQ Point).
⭕️Wave 4 & 5 Pending.
⭕️Overbought Market Conditions.

XAUUSD: 23/4 Today's Market Analysis and StrategyGold technical analysis
The resistance level of the four-hour chart is 3400, and the support level is 3285
The resistance level of the one-hour chart is 3371, and the support level is 3300
The resistance level of the 30-minute chart is 3350, and the support level is 3300.
The current gold price is short-term bearish.
The Asian session continued to break through 3300, falling to 3291.8, and then rebounded quickly. If the price falls below the 3300 integer mark again, it may further fall to 3285. After breaking the support of 3285, it will continue to test 3245.
If the price rebounds and breaks through the previous high resistance level of 3350 US dollars, the short-term trend may turn bullish.
Sell: 3350near SL:3355
Sell: 3285near SL:3290
Buy: 3300near SL:3295

XAU/USD: New ATH ~ $3500, What's Next? (READ THE CAPTION)Upon reviewing the 15-minute gold chart, we can see that the price once again reached a new high today, rallying up to the key psychological level of $3500. Following this move, gold has experienced a pullback down to $3423 so far. If the price stabilizes below $3442, we will likely see a further correction toward the next target at $3411. (This analysis will be updated)
Please support me with your likes and comments to motivate me to share more analysis with you and share your opinion about the possible trend of this chart with me !
Best Regards , Arman Shaban

HelenP. I Gold may continue fall to support zoneHi folks today I'm prepared for you Gold analytics. After a strong bullish impulse, the price of Gold reached a local peak and started to reverse. Before that, the uptrend was developing within a clearly defined ascending channel, where the trend line acted as dynamic support multiple times. Each time the price touched this line, it rebounded and continued climbing higher. However, the most recent upward movement ended with a sharp pullback, which marked the beginning of a potential correction. At the moment, the price is trading below the recent high and has already started forming a corrective downward move. XAUUSD is now heading toward the important support zone between 3190 and 3160 points. This area is not only a key horizontal level but also intersects with the trend line, making it a strong confluence zone that may act as a magnet for the price during this phase. I expect that the Gold will make a minor upward move before continuing to decline, targeting the support zone at 3190 points, which is my current goal. Given the recent price rejection from the resistance and the bearish momentum building, a move toward 3190 looks like the most probable path. If you like my analytics you may support me with your like/comment ❤️

Bearish drop?The Gold (XAU/USD0 is rising towards the resistance level which is a pullback resistance and cold drop from this level to the 50% Fibonacci retracement.

SPY/QQQ Plan Your Trade For 4-23 : Rally-111 PatternToday's RALLY pattern suggests the SPY/QQQ will continue to push higher, possibly breaking upper resistance near $550/493.
As I suggested in this video, I believe the upward price trend bias will continue into Friday (4-25) and suddenly shift into a BEARISH price trend/bias early next week.
The May 2-5 Major Bottom cycle low, my research predicts, will happen and should prompt a fairly strong downward price trend as we near the end of April and head into early May.
Gold and Silver will likely consolidate a bit over the next 24-48 hours. So, this is a great time to pick lower entry price levels for LONGS/CALLS.
Ultimately, I'm still expecting Gold to rally above $3750 before the end of May and attempt to target $4500++ before the end of June.
BTCUSD is moving into a potential "INVALIDATION" phase. Although I'm currently estimating the probability of that invalidation at about 20-30%, it is still a valid price trend.
I believe BTCUSD will shift into a downward price trend as the markets continue to unwind excesses through the May, July, and October lows, according to my cycles.
The big opportunity for traders over the next 48 hours is playing the upward trend bias in the SPY/QQQ - then moving into a mode of preparation for next week's breakdown/downward price trend in the SPY/QQQ.
So, play it smart. Follow the chart and don't try to be a superhero.
Play what is in front of you and prepare for the bigger price swings headed into next week and beyond.
Get some.
#trading #research #investing #tradingalgos #tradingsignals #cycles #fibonacci #elliotwave #modelingsystems #stocks #bitcoin #btcusd #cryptos #spy #gold #nq #investing #trading #spytrading #spymarket #tradingmarket #stockmarket #silver

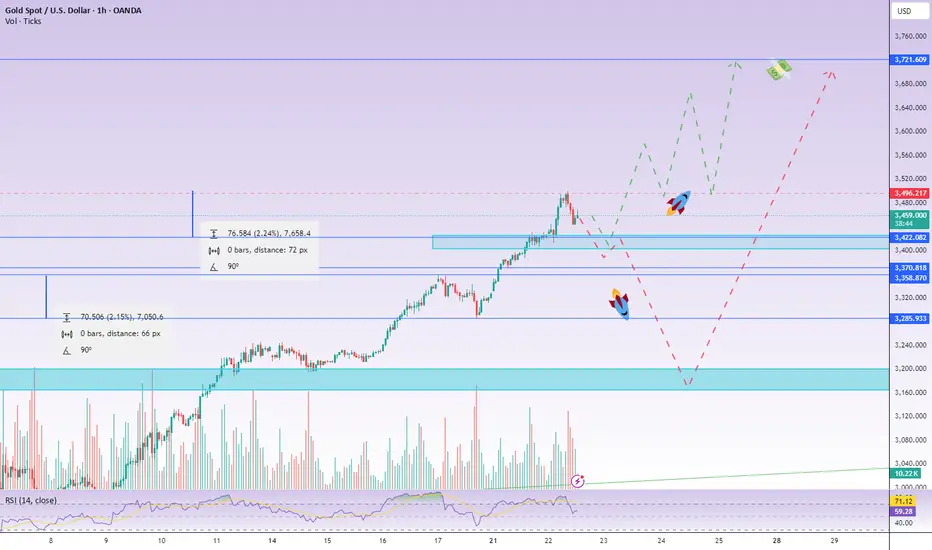
XAU/USD) orderblok key Support Analysis Read The ChaptianSMC Trading point update
technical analysis of Gold Spot against USD (XAUUSD) on the 1-hour timeframe. Here's a breakdown of the key ideas presented:
Chart Analysis Summary:
1. Price Zones:
Supply Zone (Resistance): Around the 3,355–3,365 level.
Demand/Support Zone (Doer Block Support Level): Around 3,282–3,291.
2. Current Price Action:
Price is currently at $3,331.96, close to the supply zone, and bouncing between the zones.
There’s a sharp downtrend, which seems to be slowing down near the support level.
3. Projected Move:
The chart suggests a short-term dip back into the demand/support zone, followed by a bullish reversal.
Target Point: A move back up toward $3,498.36, which is marked as a significant resistance.
4. Technical Indicators:
RSI (Relative Strength Index): Currently around 36.64 and recovering, suggesting potential bullish divergence or an oversold condition.
200 EMA: Around $3,291.52, providing dynamic support — aligning with the lower demand zone.
Mr SMC Trading point
Trade Idea:
Buy Setup (Long Trade):
Entry: Near 3,282–3,291 (support zone).
Target: 3,498.36.
Stop Loss: Below the support zone (~3,270).
Overall Idea:
This is a reversal-based setup. The price is expected to retest the support before launching a bullish leg toward the target. The confluence of the EMA, support zone, and RSI near oversold adds weight to the potential for a bounce.
Pelas support boost 🚀 analysis follow)

GOLD: The Market Is Looking Down! Short!
My dear friends,
Today we will analyse GOLD together☺️
The market is at an inflection zone and price has now reached an area around 3,333.66 where previous reversals or breakouts have occurred.And a price reaction that we are seeing on multiple timeframes here could signal the next move down so we can enter on confirmation, and target the next key level of 3,294.29..Stop-loss is recommended beyond the inflection zone.
❤️Sending you lots of Love and Hugs❤️

GOLD BuyGold has shown a rapid fall yesterday and now as it has taken all the buy order liquidated it will follow its path to the bullish side we expected gold to be bearish yesterday and today we are over all bullish over gold as price action has also shown a big rejection over bearish move this day so by following price action we will remain bull over gold

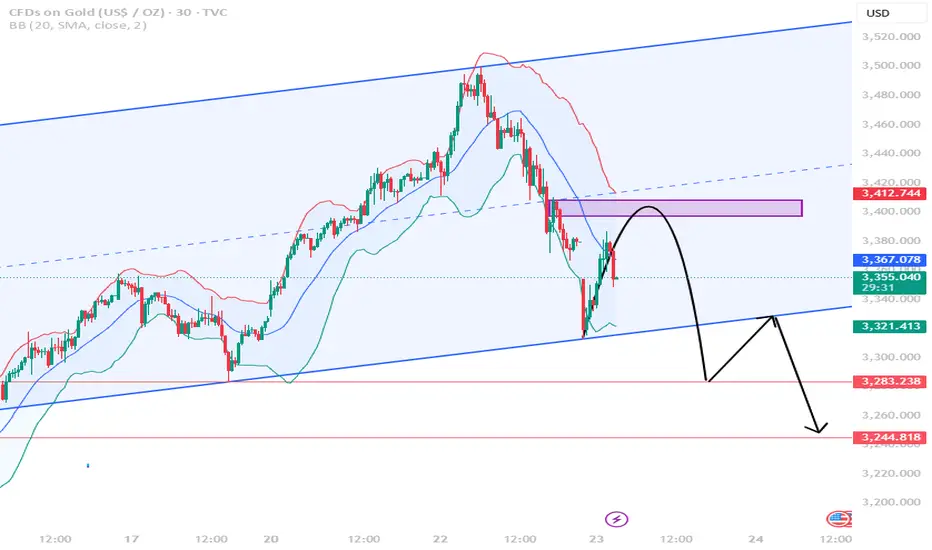
Gold Drops Shock: Breaking Up the Upward ChannelThe 4-hour chart of gold shows a clear scenario of breaking the upward channel. After reaching a peak of nearly $3,495/ounce, the gold price has plummeted and is currently fluctuating around $3,325 – close to the EMA89 support and in the accumulation zone (green box) as per technical analysis. The EMA34 line has also been penetrated, confirming that the medium-term uptrend is losing strength.
This decline is not only due to technical factors but also due to the influence of political and economic information. President Trump's statement about not firing the FED Chairman and the expectation of future interest rate cuts have helped the risk sentiment recover. US stocks have rebounded strongly, causing investors to withdraw capital from gold – a safe-haven asset – and return to stocks.
Combining both technical and news factors, this deep decline is largely due to the reversal of market sentiment and strong profit-taking pressure after a prolonged increase. The chart pattern also suggests that the price may continue to fluctuate in the $3,280–$3,340 range to consolidate before a new round of volatility. If it breaks below the green box, gold could continue to correct deeper towards the $3,200 mark.

GOLD: Bullish Continuation & Long Trade
GOLD
- Classic bullish formation
- Our team expects growth
SUGGESTED TRADE:
Swing Trade
Buy GOLD
Entry Level - 3326.0
Sl - 3316.8
Tp - 3356.6
Our Risk - 1%
Start protection of your profits from lower levels
Disclosure: I am part of Trade Nation's Influencer program and receive a monthly fee for using their TradingView charts in my analysis.
❤️ Please, support our work with like & comment! ❤️

GOLD Is Very Bullish! Long!
Here is our detailed technical review for GOLD.
Time Frame: 2h
Current Trend: Bullish
Sentiment: Oversold (based on 7-period RSI)
Forecast: Bullish
The market is trading around a solid horizontal structure 3,329.08.
The above observations make me that the market will inevitably achieve 3,396.74 level.
P.S
Please, note that an oversold/overbought condition can last for a long time, and therefore being oversold/overbought doesn't mean a price rally will come soon, or at all.
Disclosure: I am part of Trade Nation's Influencer program and receive a monthly fee for using their TradingView charts in my analysis.
Like and subscribe and comment my ideas if you enjoy them!

Gold shock, what will happen in the end?Previously, Trump frequently criticized Powell, saying that his interest rate cuts were not fast enough, and even considered firing Powell, causing market turmoil. But on April 22, Trump said he had no intention of firing Powell, but still emphasized that the Fed should lower interest rates and said that the stock market had risen well. This statement eased the market's concerns about the instability of the Fed chairman's position. Gold experienced ups and downs on Tuesday because of this news.
From the daily level, the yellow will show a trend of rising and falling on Tuesday, and finally close with a negative line. In the Asian market today, gold opened directly below the 5-day moving average. This sharp opening performance showed strong downward momentum and also made the short-term trend significantly weaker. In intraday trading, it is necessary to focus on the continuity of the downward trend of the market.
First of all, the support strength near the low point of 3316 formed after the low opening in the early trading should be paid attention to. If the short-selling force continues to exert force, causing the market to further weaken and fall, then the low point of 3284 that rebounded last Friday and the 10-day moving average support currently in the 3270 area will become the key support line in the future. In terms of operation, it is still mainly high-altitude
Operation strategy 1: Sell in the range: 3400-3403 SL:3410
TP: 3380--3360
Operation strategy 2: Buy in the range: 3280-3285 SL:3269
TP: 3300--3330
Hellena | EUR/USD (4H): LONG to the resistance area 1.16000.Good afternoon colleagues! In the coming week I expect the upward movement to continue in wave “3” of the higher order. I believe that a small correction to the support area of 1.2176 and then rise to the resistance level of 1.16000 is possible.
There are two possible ways to enter the position:
1) Market entry
2) Pending limit orders.
Manage your capital correctly and competently! Only enter trades based on reliable patterns!

XAUUSD Analysis todayHello traders, this is a complete multiple timeframe analysis of this pair. We see could find significant trading opportunities as per analysis upon price action confirmation we may take this trade. Smash the like button if you find value in this analysis and drop a comment if you have any questions or let me know which pair to cover in my next analysis.

GOLD RISKY LONG|
✅GOLD has been making
A bearish correction after
Establishing a new all-time-high
So we are bullish biased on
Gold mid-term and we will be
Expecting a local bullish rebound
From the support around 3283$
LONG🚀
✅Like and subscribe to never miss a new idea!✅
Disclosure: I am part of Trade Nation's Influencer program and receive a monthly fee for using their TradingView charts in my analysis.

Gold’s Super Bullish Breakout – Eyeing $3700 or $3200?My previous analysis played out very well, except I was concerned that we didn't reach the $3,180 area. With the ongoing trade wars and recent comments from Powell, the USD is weakening significantly, and we’re seeing a gold move unlike any I’ve experienced before—possibly the most bullish pattern yet.
Based on my analysis from the edge of the market, we can identify key breakout levels that must hold to continue pushing toward $3,700.
Watch the 1H and 4H wick and body formations:
1. If the 1H candle body can break above $3,500, we’ll likely continue making higher highs and higher lows toward $3,700.
2. If the 1H candle body fails to hold the $3,400 level, we might see the pullback I’ve been anticipating—possibly down to the $3,200 level >> and pullback towards $3700.