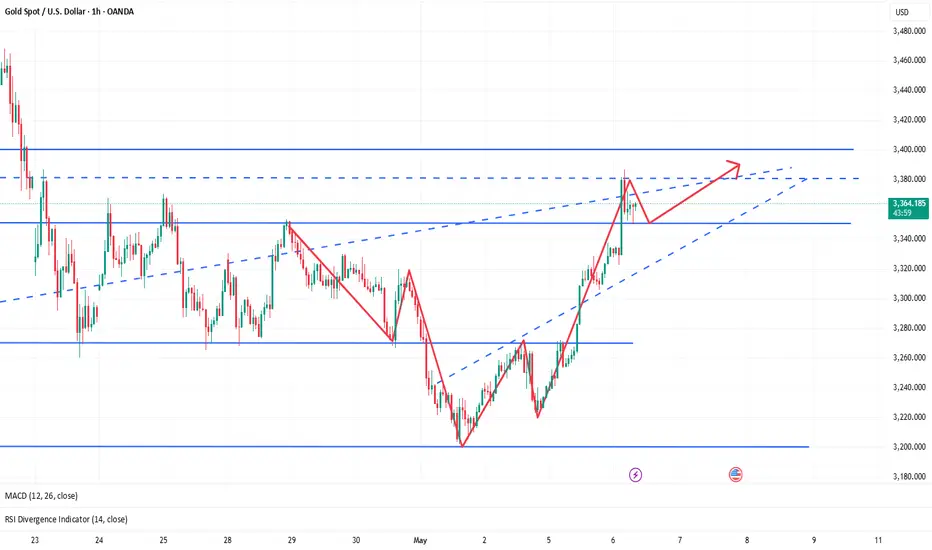
Gold may break out of the range and rise to 3450GOLD is rising and testing the resistance of the trading range. The important prerequisite is no drop after false breakout. Accordingly, buyers are building up and a close above 3367 may give a chance for a rise
The fundamental situation is changing, Trump is imposing new duties. In addition, gold is reacting to the escalation of the conflict in the Middle East. The metal continues to be a magnet for money
Scenario: A break of range resistance and consolidation above 3367 activates buying. The target of 3407 is 3444
Gold

Gold Price ActionHello, Currently, price is in a Compression Phase after a strong Resistance Breakout (RBO). This tight consolidation is creating liquidity on both sides—setting up for a potential breakout.
What to Watch:
Compression Phase = Liquidity Building
Price is moving within a narrow range, trapping traders and stacking orders above and below.
We're waiting for a clean breakout of this range.
After the breakout, price is likely to retrace back toward the base (marked zone) before making a strong move toward the Buy Side Liquidity (BSL).
🎯 Trade Plan:
Wait for the compression to break. A return to the base zone could offer an entry, with BSL as the target (TP).
⚠️ Stay patient and avoid early entries—let the breakout confirm the move.
✅ Patience is key—wait for confirmation and manage risk smartly.

GOLD - The Timeless Standard Bitcoin Can Only Dream Of ✨💰
1/ Bitcoin’s Aspirations vs. Gold’s Reality
Bitcoin proclaims to be “digital gold” , promising decentralization and stability. But the truth is clear: while Bitcoin is shaken by extreme wealth concentration and constant media hype, gold has built a centuries-long reputation for trust and enduring value. 🔥🏆
2/ The Digital Gold Revolution
Gold isn’t a relic—it's evolved! 🚀 Today, through blockchain tokenization, you can own digital gold that’s 100% backed by physical gold safely stored in vaults. 🏦🔐 This fusion of ancient value and modern tech shows that gold means business, while Bitcoin just tries to copy its legacy.
3/ Concentration vs. Distribution
Check this out: over 90% of Bitcoin is hoarded by a few whales 🐋, leaving everyday holders with crumbs. In contrast, gold’s market has naturally spread out over centuries of global trade. 🌍📈 This organic distribution reinforces stability and genuine market confidence.
4/ Liquidity, Custody & Security
🔹 Gold Is Easy to Custody
Gold is already stored securely in banks and reputable vaults all over the world, and its ownership transfers digitally. You can withdraw or trade anytime without relying on untrustworthy crypto exchanges or wallets vulnerable to hacks . 🔓💼 Meanwhile, Bitcoin’s security is often subject to risks and platform issues.
5/ Real-World Utility vs. Speculative Hype
Gold isn’t just an asset—it’s a workhorse! ⚙️ From use in electronics to medicine and aerospace, gold’s real-world applications generate organic demand. No aggressive, 24/7 hype machine is needed here. In contrast, Bitcoin runs on media-fueled life support, with bots and influencers relentlessly (and tediously) pushing its narrative . 😴📢
6/ Stability You Can Count On
Gold has weathered economic storms with calm resilience 🌪️➡️☀️, proving itself as the ultimate safe haven. Bitcoin, however, is notorious for its wild 80%+ price crashes, making it a volatile bet for long-term wealth preservation. 🏛️💚
7/ Finite Supply: Strength or Vulnerability?
Bitcoin’s fixed supply is often touted as a key advantage. Yet this scarcity makes it vulnerable to manipulation by a few major holders. 😬 Gold, on the other hand, sees a natural and gradual expansion through mining, ensuring a balanced, organic market flow. ⚖️🌿
8/ Institutional Adoption: Not the Magic Fix
State and corporate Bitcoin deals are usually quiet, behind-the-scenes OTC transactions that rarely impact open market prices. 🤫 Gold’s widespread institutional acceptance is built on centuries of trust and real-world use—no constant screaming into the void required. 📣🚫
9/ Gold: No Need for Hype, Just Legacy
Gold stands proudly without the constant need for promotion. 🌟 Its legacy of stability, digital adaptability, and secure custody speaks volumes. Bitcoin, burdened by relentless crypto spam and hype, can only watch from the sidelines. 🎭🗣️
10/ Invest in Timeless Security
When it comes to long-term wealth preservation, gold is your steadfast asset. It offers proven security, with both digital tokenization and secure physical storage, ensuring smooth withdrawals and trades every step of the way. 🏦🔐 Bitcoin, by contrast, survives on a steady diet of media noise and desperate promotions. 🚑🤖
Gold remains the reliable, time-tested choice in today’s fast-paced world of trends and fleeting hype. Whether you’re safeguarding your wealth or seeking an asset that seamlessly bridges digital innovation with physical security, gold’s enduring legacy is the real deal. 🌟💎
If you’d like to explore how tokenized gold is revolutionizing traditional finance or uncover more about its industrial applications and secure custody mechanisms, there’s always another layer of brilliance waiting to be discovered. 🚀🔍
TVC:GOLD TVC:SILVER INDEX:BTCUSD NASDAQ:MSTR NASDAQ:MARA NASDAQ:COIN CRYPTO:BTCUSD CRYPTOCAP:BTC.D

Gold (XAU/USD) - Bullish Reversal Pattern in Play Hello guys!
Let's analyze Gold!
Gold has recently broken out of a descending wedge pattern, a classic bullish reversal signal, with confirmation coming from a clear bullish divergence near the $3,200 zone. After reaching the target of the descending pattern, the price rebounded sharply and is now forming an ascending channel.
Currently, the price is approaching a key resistance zone around $3,280–$3,290. If bulls manage to push through this level, we could see a rally toward the next major resistance around $3,320 and beyond.
🔍 Key Points:
✅ Descending wedge breakout confirmed
✅ Bullish divergence near the bottom signals a momentum shift
✅ Price respecting ascending channel structure
📈target of long position: $3,290–$3,320
📉 target of short position and the entry for long: $3,240 zone
Outlook: Bullish bias remains valid as long as the price is above the $3,240–$3,250 support area. Watch for a breakout above resistance for further upside continuation.

Gold Rally Running Out of Steam? PRZ May Trigger Drop!Gold ( OANDA:XAUUSD ) has hit the targets as I shared with you in yesterday's idae . Will this uptrend of the past 5-6 days continue?
Gold seems to have broken through the Resistance zone($3,387-$3,357) and has been moving in an Ascending Channel for the past 5 days .
In terms of Elliott Wave theory , Gold appears to be completing microwave 5 of the main wave 3 . The end of the main wave 3 can be at the Potential Reversal Zone(PRZ) .
Also, expect to see a clear Regular Divergence(RD-) between Consecutive Peaks at the Resistance zone($3,434-$3,406) .
I expect Gold to start declining from the Potential Reversal Zone(PRZ) and at least to the lower line of the ascending channel . This analysis is against the main trend, so pay more attention to money management .
Note: If Gold touches $3,448(Stop Loss(SL)), we can expect more pumps.
Note: If Gold falls below $3,342, we can expect a deeper decline than expected.
Gold Analyze ( XAUUSD ), 1-hour time frame.
Be sure to follow the updated ideas.
Do not forget to put a Stop loss for your positions (For every position you want to open).
Please follow your strategy; this is just my idea, and I will gladly see your ideas in this post.
Please do not forget the ✅' like '✅ button 🙏😊 & Share it with your friends; thanks, and Trade safe.

XAUUSD Price Action: Bullish Break + Liquidity Sweep Trade Idea🪙✨ Gold (XAUUSD) Technical Outlook ✨📈
I’m currently analyzing XAUUSD on both the daily and 4H timeframes, and here’s what I’m seeing:
🚀 Price has broken bullish structure and is now looking overextended, pushing into a buy-side liquidity zone—clearly visible to the left of current price action. 💰📊
It’s clearing buy stops, which could trigger a retracement soon. 🧲🔁
🎯 I’m watching closely for a pullback into the 50%–61.8% Fibonacci retracement zone on the current price swing—that’s my key point of interest for a potential long setup, provided we see a healthy pullback followed by another bullish break of structure. 🔍🔐
🧠 Not financial advice—just my personal analysis. Always manage risk. ⚠️📉

Bullish Breakout for Gold???Waiting to see what they want to do. Price was bullish all day yesterday and Im trying to see if they want to give a pullback before continuing with the action. I know its best to just wait for the killzone to get the best entry.

GOLD Potential ReversalIt appears that we've reached a significant top in the market, with price action showing signs of a potential dump. Liquidity has been taken out at this level, and we are now looking at lower price targets, which align with the lines below, marking new liquidity points. These areas could serve as key support levels as the market tests them for further reaction.
The price structure suggests a possible drop to the target zones around 3,300 / 3,200 & 2970 where we could see renewed buying interest. Stay cautious as we approach these levels, as they may present opportunities for short entries ahead of the market correction.
Keep an eye on the evolving price action for further confirmations.

GOLD Technical Analysis - Deeper Pullback in PlayOANDA:XAUUSD remains within a broader ascending channel, but recent price action suggests that the market is undergoing a deeper corrective phase. Following a prolonged bullish rally, price appears overextended and is now pulling back more decisively.
This correction aligns with expectations for a healthy retracement after such strong upward momentum. I anticipate that the pullback will extend further toward the $3,160 level, a key technical level defined by the confluence of horizontal support, ascending trendline support, and the 0.618 Fibonacci retracement of the latest bullish impulse.
This zone will be critical for determining whether the broader bullish structure remains intact. If price holds at this level and shows signs of reversal, it may present a strong re-entry opportunity for buyers. However, a decisive break below this zone would invalidate the current bullish structure and open the door to a deeper correction.
Always confirm your setups and trade with a proper risk management.
Best of luck!

XAU/USD: NFP has come,What's Next? (READ THE CAPTION)By analyzing the gold chart on the 1-hour timeframe, we can see that after yesterday’s analysis, the price successfully rallied from $3231 to $3268. Once it reached that zone, selling pressure kicked in, and gold has since corrected down to $3239.
If gold stabilizes below $3257, we may expect further downside. The potential bearish targets are $3237 and $3221.
Keep a close eye on the $3209–$3220 zone, as price reaction there could be significant.
Please support me with your likes and comments to motivate me to share more analysis with you and share your opinion about the possible trend of this chart with me !
Best Regards , Arman Shaban

GOLD - NEW BREAKOUT !Hello Traders !
The Gold price failed to create a new lower low.
The Last lower high is broken (change of character).
So, I expect a bullish move🚀
______________
TARGET: 3340.000🎯

Gold: The Start Of The C Wave (Extreme Danger!)After the FED announces their business Gold (XAUUSD) is likely to crash-down and hard.
I will support my statement with data coming from this chart.
The crash doesn't necessarily need to happen instantly. My idea is that we are witnessing a classic ABC correction in Elliott Wave Theory terminology. Let's dive in.
» Trading volume peaked in early April and has been dropping considerably.
» The ATH session ended as a very strong bearish (reversal) signal.
» There is a strong bearish divergence with the RSI. The RSI peaked February 2025 while Gold (XAU) peaked recently. Here is the chart:
Currently, Gold is showing a bounce until the resumption of the corrective bearish move.
Gold is set to move lower based on my interpretation of this chart. Approach with caution, or, go SHORT. You can't go wrong by shorting the top/resistance. Sell at resistance, buy at support.
Namaste.

XAUUSD Channel Up intact and targeting the 1D MA50.Gold (XAUUSD) has been trading within a Channel Up since the October 30 2024 High and is currently on its latest technical Bearish Leg. The last pull-back tested the 1D MA50 (blue tend-line) before rebounding again.
As you can see the Low that this pull-back made was also on the 0.618 Fibonacci retracement level. On the current Bearish Leg, the 0.618 Fib is at 3155 and can make contact with the 1D MA50 within 1 week. That is our short-term Target, but depending on the Fed Rate Decision on Wednesday, it may be achieved earlier.
-------------------------------------------------------------------------------
** Please LIKE 👍, FOLLOW ✅, SHARE 🙌 and COMMENT ✍ if you enjoy this idea! Also share your ideas and charts in the comments section below! This is best way to keep it relevant, support us, keep the content here free and allow the idea to reach as many people as possible. **
-------------------------------------------------------------------------------
Disclosure: I am part of Trade Nation's Influencer program and receive a monthly fee for using their TradingView charts in my analysis.
💸💸💸💸💸💸
👇 👇 👇 👇 👇 👇

DeGRAM | GOLD Finished Correcting?📊 Technical Analysis
● After two successful touches of rising-channel support near $3 200, XAU/USD pierced the resistance line and the triangle, confirming a bullish breakout.
● A pattern of higher lows now projects a fresh impulse toward the channel top at ~$3 500.
💡 Fundamental Analysis
● Goldman Sachs forecasts central banks will keep buying bullion amid recession fears, driving gold to $3 700 by year-end.
● Traders price in ~80 bp of Fed rate cuts from July, lowering real yields and bolstering gold’s appeal.
✨ Summary
Channel breakout + strong CB demand and Fed-cut bets support a short-term long bias: a clear break above $3 315 targets $3 500; view invalid below $3 200.
-------------------
Share your opinion in the comments and support the idea with a like. Thanks for your support!

XAU/USD technical outlook: Gold price poised to challenge $3,350Gold price uptrend resumed as today’s price action confirmed a ‘bullish harami’ two-candle chart pattern, indicating that bulls are gathering steam. The Relative Strength Index (RSI) further confirmed the latter, as the RSI’s line aims upwards.
Therefore, traders will face key resistance levels like $3,350, followed by the $3,400 figure. If surpassed, the next stop would be $3,450 and $3,500. Conversely, if sellers drag XAU/USD spot price below $3,300, look for a test of the May 1 low of $3,202, ahead of the April 3 high turned support at $3,167.

GOLD The Target Is DOWN! SELL!
My dear friends,
My technical analysis for GOLD is below:
The market is trading on 3377.8 pivot level.
Bias - Bearish
Technical Indicators: Both Super Trend & Pivot HL indicate a highly probable Bearish continuation.
Target - 3357.7
Recommended Stop Loss - 3387.7
About Used Indicators:
A pivot point is a technical analysis indicator, or calculations, used to determine the overall trend of the market over different time frames.
Disclosure: I am part of Trade Nation's Influencer program and receive a monthly fee for using their TradingView charts in my analysis.
———————————
WISH YOU ALL LUCK

Gold returns to the bull market as expected, follow-up layout🗞News side:
1. The “demand shock” of the Trump administration’s tariffs on the global economy
2. The United States rejected Japan’s request for a comprehensive exemption from 10% reciprocal tariffs and country-specific tariffs in recent negotiations.
3. The conflict between Israel and the Houthis
📈Technical aspects:
From a technical point of view, the 4H gold bulls are once again making an impact. At the top, we focus on the short-term suppression of the 3380-3390 line, focusing on the suppression of the 3400 line. Below, we focus on the short-term support of the 3350 line, and the important first-line support of 3335-3340. In terms of operation, we mainly go long by stepping back on 3350-3360, and the target is temporarily looking at 3380-3390. In the middle position, we should watch more and move less, pursue orders cautiously, and wait patiently for key points to enter the market.
If you agree with this point of view, or you have a better idea, please leave a message in the comment area. I look forward to hearing different voices.
OANDA:XAUUSD FX:XAUUSD FXOPEN:XAUUSD FOREXCOM:XAUUSD TVC:GOLD
BITCOIN/GOLD BITCOIN/GOLD 🌊
Physical gold vs. Digital gold
2010: 1 BTC 0.0001 GOLD
2025: 1 BTC 27.9 GOLD

Latest gold trading analysis strategy on May 6:
Core driving factors
Surge in safe-haven demand
The continued escalation of the conflict between Russia and Ukraine and the situation in the Middle East has driven funds to flow into gold for safe-haven, with an intraday increase of 2.27% (over $80), reaching a high of $3,328.
Policy uncertainties such as the 100% tariff imposed by the United States on imported films have further weakened market risk appetite.
Monetary policy expectations
The market is betting that the Federal Reserve will soon start a rate cut cycle, and the attractiveness of interest-free assets such as gold has increased. However, it is necessary to be vigilant that inflation resilience or economic data exceeding expectations may delay rate cuts and trigger a correction in gold prices.
Weak US dollar and central bank gold purchases
The US dollar has failed to gain sustained momentum from strong employment data to support gold. The global central bank gold purchases (especially in emerging markets) provide long-term support for gold prices.
Key technical signals
Daily level
Potential top risk: The long upper shadow line of the high and fall last Friday shows upper selling pressure, MACD dead cross and MA5 moving average downward, suggesting that the trend may weaken.
Support confirmation: The current price has returned to above $3,300, and it is necessary to observe whether it can stand firm at this psychological barrier.
4-hour level
Range oscillation: Short-term wide range oscillation between 3270 and 3350, MACD golden cross but needs to break through the 3330-3350 pressure zone to confirm the continuation of the bulls.
Key positions:
Resistance: 3330 (intraday high), 3350 (previous high and upper edge of the range).
Support: 3300 (psychological barrier), 3280-3290 (MA10 moving average and short-term bull defense line).
Operation strategy suggestions
Short-term bull opportunities
Entry conditions: Retracing to the 3280-3290 support area and the emergence of stabilization signals (such as 4-hour K-line closing positive or MACD bottom divergence).
Target: 3330→3350, after breaking through, it can look up to 3400.
Stop loss: below 3270 (the trend turns bearish if the range breaks).
Be cautious of high-altitude opportunities
Entry conditions: rebound to 3340-3350 under pressure (previous high of the daily line + upper edge of the range), combined with K-line reversal patterns (such as pin bar).
Target: 3300→3280.
Stop loss: above 3360 (to prevent sudden geopolitical risks from driving breakthroughs).
Breakthrough follow-up strategy
Break above 3350: light position chasing long, target 3400, stop loss 3340.
Break below 3270: turn to bearish, target 3230-3250, stop loss 3280.
Risk warning
Escalation of geopolitical conflicts: If the situation suddenly deteriorates (such as large-scale conflicts in the Middle East), the gold price may quickly break through 3350, and the stop loss needs to be adjusted in time.
Changes in Fed policy expectations: Focus on non-agricultural, CPI and other data. If it shows that the economy is overheated or inflation is sticky, it may suppress expectations of interest rate cuts and be bearish for gold.
Summary: Gold is bullish in the short term due to risk aversion, but there is a risk of a correction on the technical side. It is recommended to go long on pullbacks, and try to go high at key resistance levels with strict risk control. Conservative investors can wait for a breakout of 3350 or a fall below 3270 before following the trend.

Hanzo | Gold 15 min Retest 3275 – Confirm the Next Bullish Move🆚 Gold – Hanzo’s Strike Setup
🔥 Timeframe: 15-Minute (15M)
——————
💯 Main Focus: Bullish Retest at 3275
We are watching this zone closely.
———
Analysis
👌 Market Signs (15M TF):
• Liquidity Grab + CHoCH at 3265
• Liquidity Grab + CHoCH at 3318
• Strong Rejections seen at:
➗ 3270 – Major support / Key level
➗ 3325 – Proven resistance
🩸 Key Zones to Watch:
• 3272 – 🔥 Bullish breakout level X 7 Swing Retest
• 3325 – Strong resistance (tested 5 times)
• 3270 – Equal lows
• 3328 – Equal highs
Hanzo | Gold 15 min Retest 3275 – Confirm the Next Bullish Move

GOLD - WAVE 4 CORRECTION TO $2,800 (UPDATE)Gold has climbed higher into our 0.365% zone, which I highlighted on yesterday's analysis. We will keep a close eye out to see if price action offers any rejection around this zone, for sellers to kick in. However, the closer it gets to the ATH, the higher chance of it creating a new ATH.

GOLD: Short Signal Explained
GOLD
- Classic bearish pattern
- Our team expects retracement
SUGGESTED TRADE:
Swing Trade
Sell GOLD
Entry - 3311.9
Stop - 3324.4
Take - 3287.1
Our Risk - 1%
Start protection of your profits from lower levels
Disclosure: I am part of Trade Nation's Influencer program and receive a monthly fee for using their TradingView charts in my analysis.
❤️ Please, support our work with like & comment! ❤️

Gold Chart And Factor Of 3Price changes with a factor of 3 and its reaction to support and resistance levels.
3% , 6% , 9% , 12% , 15% , 18% ...
