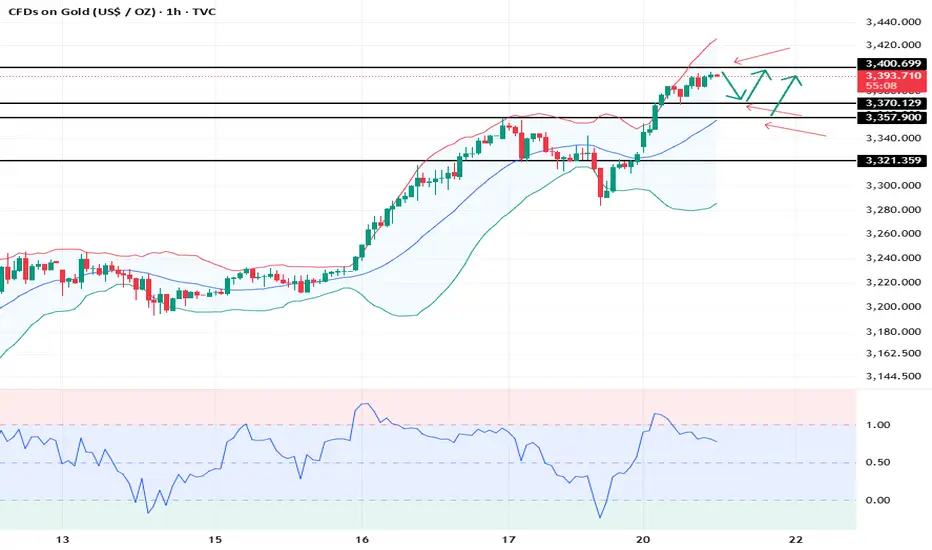
Gold Trades I'm Taking Today 2
Last week was a success. This week, this is my vibe (don't take my trades without proper research) I'm still going for buys at least till a much stronger resistance. Gold has been breaking levels and i don't think she's stopping anytime soon.
In situations like this, we BUY!!!!..
Let me know what you think.
Gold

Gold hits new record — Next stop: $4000!Gold has soared above $3,300 per ounce, setting a new all-time high. Since the beginning of the year, XAUUSD has gained over 20% , and analysts are warning: this may just be the beginning of a rally toward $4,000. As geopolitical tensions flare, supply chains for critical minerals falter, and traditional risk assets crumble, the spotlight is back on gold as the ultimate safe haven.
FreshForex analysts have been forecasting this surge since November 2023. We believe gold will remain a strong investment, supported by a range of powerful factors:
Trade war escalation: Donald Trump has signed executive orders targeting the reduction of U.S. reliance on imported strategic minerals like uranium, cobalt, and rare earths — the market reacted instantly. Conflicts, wars, sanctions, and international tension typically drive investors to seek refuge in gold.
Fed at a crossroads: The probability of a rate cut in May is 92.3% (CME data). Lower interest rates reduce returns on traditional fixed-income instruments like bonds, making gold a more appealing option for investors.
Central banks are stockpiling gold: In Q1 2025, global gold purchases surged 41% compared to 2024. Gold ETFs are holding a record $345.5 billion. Many countries are ramping up gold reserves to diversify away from the U.S. dollar, fueling further demand for physical gold.
Inflation and structural debt crisis in the U.S.: The University of Michigan forecasts consumer inflation at 6.7% — the highest since 1981. Rising yields, budget deficits, and political instability are accelerating capital flight from the dollar.
Goldman Sachs analysts (#GoldmanSac) have once again raised their gold forecast. The investment bank expects gold to reach $3,700 per ounce by the end of this year and $4,000 by mid-2026. Meanwhile, FreshForex believes the $4,000 mark could be tested as early as this year!

DeGRAM | GOLD Slows Under Resistance📊 Technical Analysis
GOLD failed to break out above the resistance line near $3 400 and is retreating from overbought levels; low volatility signals weakening momentum and a likely pullback toward support around $3 325.
💡 Fundamental Analysis
Short-term macro drivers also tilt bearish. Rising U.S. Treasury yields are making gold less attractive, while hawkish Fed signals fueled by strong U.S. data have strengthened the dollar.
✨ Summary
Technical and fundamental factors point to a short-term bearish correction in XAUUSD.
-------------------
Share your opinion in the comments and support the idea with a like. Thanks for your support!

GOLD - Price can make correction and then continue to growHi guys, this is my overview for XAUUSD, feel free to check it and write your feedback in comments👊
Price broke out from the lower wedge line and started climbing with confidence, building momentum step by step.
After bouncing off the $3215 zone, it pushed higher and touched the wedge resistance without major rejection.
The current candle formation shows signs of slowing down, hinting at a possible short-term pullback ahead.
Despite that, the structure remains bullish, and buyers are likely to defend local support if the price dips slightly.
With the breakout zones holding firm, I expect Gold to make a correction and then resume the upward path.
My target is set at $3500, where the upper wedge boundary might once again act as key resistance.
If this post is useful to you, you can support me with like/boost and advice in comments❤️

XAUUSD - When will the gold trend reverse?!Gold is above the EMA200 and EMA50 on the 1-hour timeframe and is in its ascending channel. A downward correction of gold towards the demand zone will provide us with the next buying position with a good risk-reward ratio. We expect a fluctuation of $10-15 in each range.
The global gold market has experienced notable shifts in trade flows following the removal of retaliatory tariffs on metals imposed by the Trump administration. According to data, a significant portion of gold that had been moved to New York since December is now being returned to Switzerland, its original destination.
Swiss customs data reveals that gold imports from the United States surged to 25.5 metric tons in March—the highest level in 13 months—up from just 12.1 tons in February. In contrast, gold exports from Switzerland to the U.S. dropped by 32%, falling to 103.2 tons.
For the first time in over 14 months, Comex-approved warehouses, part of the CME Group, have recorded consistent outflows of gold. These outflows indicate a reduction in U.S. futures premiums and a decline in trader anxiety following the removal of tariffs.
Switzerland has once again emerged as the primary destination for gold leaving American vaults, reaffirming its central role in global gold refining and logistics. Nevertheless, a portion of the gold stored in U.S. warehouses continues to serve as a hedge against market uncertainties.
In an average year, the U.S.consumes around 115 metric tons of gold in the form of physical coins and bars. Current data suggests that kilobar inventories held in CME warehouses are sufficient to meet this demand for nearly 12 years.
The gold market remains heavily influenced by geopolitical and economic factors. These developments highlight Switzerland’s importance in refining and transportation, as well as the United States’ significant role in gold storage and resource management.
Meanwhile, a growing number of economic forecasts are warning that the U.S. may be entering a period of “stagflation”—a situation characterized by stagnating economic growth coupled with persistently high inflation. Tariffs have the potential to drive up consumer prices while simultaneously slowing growth, placing financial pressure on households, particularly if the labor market deteriorates.
Central banks face serious challenges in responding to stagflation through monetary policy, as efforts to address one side of the issue often exacerbate the other. Even if the U.S. economy avoids a recession triggered by tariffs, many economists foresee rising risks of a painful stagflationary period.
While economic experts remain divided on whether former President Trump’s trade wars will ultimately tip the economy into recession, a large number of recent forecasts underscore the increasing threat of prolonged inflation combined with sluggish growth. Numerous analysts, including Federal Reserve officials, argue that tariffs are likely to hamper economic expansion and weaken the labor market, all while elevating consumer prices.
However, Lindsey Piegza, chief economist at Stifel Financial, is among those who believe the labor market and consumers remain resilient enough to help the economy steer clear of a full-blown recession—assuming recently announced tariffs are eventually scaled back.

HelenP. I Gold will start to decline, after long upward moveHi folks today I'm prepared for you Gold analytics. Recently, price has shown a powerful rally after breaking out from a prolonged consolidation phase that lasted several days. This sideways movement was confined inside the buyer zone near 2855 - 2835 points, which acted as a reliable base for bulls. After forming a solid structure in that area, the price started to move higher, eventually breaking through the resistance of the range and forming a clear uptrend supported by a well-defined trend line. After climbing steadily, the price reached the 3160 support level, which turned into a retest zone later on. A strong impulse followed, pushing Gold above the trend line and into a new higher range. The bullish momentum continued, bringing the price above the 3180 - 3160 zone, and establishing a new local high. Currently, XAUUSD is trading near 3327 points after forming a local peak. It’s showing early signs of a pullback from the top, and the structure suggests a potential correction. I expect the price to decline toward the trend line and reach the 3265 points, which coincides with the trend line. That's why it's my current goal. If you like my analytics you may support me with your like/comment ❤️

XAUUSD It's most important week in 5 years.Gold (XAUUSD) hit last week the multi-year Higher Highs trend-line that has been in effect since the July 04 2016 High. Last time it had a rejection on it was on August 03 2020 when the market started the last 2-year Bear Cycle.
The current 1W candle has opened above this Higher Highs trend-line, so the week is of utmost importance as a closing below it maintains the pattern and the bearish Cycle Top bias, while above it jeopardizes invalidating it.
If as a result, the market closes the week below it and remains within the Fibonacci Channel Up, we may indeed be on Leg (4) peak and our Target will be near the 0.382 horizontal Fibonacci level at 2700 towards the end of the year. If not, we will see what new pattern is created and adapt accordingly (updates will follow).
-------------------------------------------------------------------------------
** Please LIKE 👍, FOLLOW ✅, SHARE 🙌 and COMMENT ✍ if you enjoy this idea! Also share your ideas and charts in the comments section below! This is best way to keep it relevant, support us, keep the content here free and allow the idea to reach as many people as possible. **
-------------------------------------------------------------------------------
Disclosure: I am part of Trade Nation's Influencer program and receive a monthly fee for using their TradingView charts in my analysis.
💸💸💸💸💸💸
👇 👇 👇 👇 👇 👇

Gold Approaches $3,400 Amid Weakening Dollar ConfidenceGold is rallying on a combination of safe-haven flows and Dollar weakness, approaching the $3,420 resistance. While momentum is elevated—resembling crisis-era extremes—further gains are possible amid continued uncertainty.
If $3,420-$3450 zone holds, aligning with key Fibonacci extensions (drawn from the 2018 lows, 2020 highs, and 2022 lows), and trendline connecting 2016 and 2020 peaks, gold could follow through on its cup and handle breakout pattern toward $3,700 and $4,000.
However, any geopolitical resolution or easing of trade tensions could trigger a sharp reversal, with potential downside levels at $3,000, $2,960, $2,900, and $2,800.
Written by Razan Hilal, CMT

XAUUSD 21/4/25We have another bullish run on the horizon after seeing a new all-time high placed last week and the week before. We expect nothing less than continued bullish momentum for gold.
As we mentioned in the EUR/USD markup, where price currently sits on many pairs is a relatively extended area. This means price action could pull back to more favorable pricing, especially due to the upcoming bank holidays. We know there are lower liquidity areas that may need to be filled, and if we want to follow this bullish move, we must also be prepared for a temporary dip.
As we remain bullish, we should avoid relying on short movements and instead wait for better pricing before entering long positions. As always, short-term lows may form between the last major low and the current price. If they do, those could be potential areas to buy from.
However, we must stay clear in our bias—we want to go long from any potential liquidity-driven lows, not just chase the upward move if it’s likely to retrace. Look for the high-liquidity low we've marked on our chart. If price reaches that area, it would present a highly probable zone for long trades.
Stick to your risk, let Orion lead the way, and always follow your trading plan.

GOLD Is Very Bullish! Long!
Please, check our technical outlook for GOLD.
Time Frame: 1h
Current Trend: Bullish
Sentiment: Oversold (based on 7-period RSI)
Forecast: Bullish
The price is testing a key support 3,327.58.
Current market trend & oversold RSI makes me think that buyers will push the price. I will anticipate a bullish movement at least to 3,360.10 level.
P.S
The term oversold refers to a condition where an asset has traded lower in price and has the potential for a price bounce.
Overbought refers to market scenarios where the instrument is traded considerably higher than its fair value. Overvaluation is caused by market sentiments when there is positive news.
Disclosure: I am part of Trade Nation's Influencer program and receive a monthly fee for using their TradingView charts in my analysis.
Like and subscribe and comment my ideas if you enjoy them!

XAUUSD: 21/4 Today’s Market AnalysisGold technical analysis
Daily chart resistance 3400-3450, support 3320
Four-hour chart resistance 3400, support 3358
One-hour chart resistance 3400, support 3370
On the first trading day after the holiday, risk aversion continued to drive gold up, with a daily increase of more than 2%, and is about to reach the bull psychological target of 3400 integer mark. The Stochastic indicator is currently overbought, and if it fails to break through 3400, it may trigger a short-term correction.
If the price quickly falls below 3350, it will turn into a bearish trend. COMEX gold futures positions have reached a new high, and we need to be wary of long profits in the NY market that trigger selling.
Gold touching the 3400~3410 range may trigger a rapid correction. It has risen quickly recently, and it has also fallen quickly, and the amplitude is large. Therefore, it is not recommended to chase the high near 3400, and wait for the correction to stabilize near 3358 before buying.
Gold Defies the Fed – The Clash for a New Monetary Order🪙 Gold Defies the Fed – The Clash for a New Monetary Order 📈
🏆 Gold Bulls Rejoice — The Chart Speaks Loud
From $1,700 to over $3,200 — gold has defied every rule in the macro playbook. It rallied through rising rates, a strong dollar, and a supposed tightening cycle. This move isn't just about demand — it's a signal .
📉 Interest Rate Timeline: 2020–2025
Gold moved counter to monetary logic — here’s the full context:
2022 🔺 R: 0.25 ➝ 4.50
Start of aggressive rate hikes – CPI peaked at 9.1% 🔥
2023 ⚒️ R: 4.50 ➝ 5.50
Peak tightening – gold didn’t flinch
2024 ✂️ R: 5.50 ➝ 4.25
Mid-year rate cuts – inflation cooled to 2.4% ❄️
2025 🔁 R: 4.25–4.50
Fed paused, Trump pushing for deeper cuts – tariffs complicate the easing path
🇨🇳 The China Factor – A Strategic Gold Game
#1 producer AND importer
Keeps all domestic production
Estimated holdings: 13,000–17,000 tons
Investing globally (Africa, Asia, LatAm)
Possible BRICS-backed gold currency on the horizon?
China isn't just hedging inflation — it's preparing for monetary evolution.
💱 CPI From Fire to Frost
2022: CPI at 9.1% 🔥
2025: 2.4% ❄️ — near the Fed’s 2% target
Yet despite “normal” inflation, the Fed holds — a sign of deeper uncertainty.
🧭 The 4 Modes of Gold – Explained on Chart
Trump Mode : Aggressive cuts → Gold targets $3,300–$3,600
Feds Mode : Status quo → Gold tests $3,000
China Mode : Strategic surge → Long-term $3,998+
Bitcoin Mode : Digital store of value rises → Gold reverts to $2,537 zone
These are not just technical levels — they represent global monetary narratives.
🕰️ Will History Repeat Itself?
In 1873, Germany adopted gold. China stayed on silver — and lost its monetary edge.
Today, it’s not silver vs gold — it’s gold vs Bitcoin .
China stockpiles gold
U.S. institutions embrace Bitcoin
Trade wars have become currency wars
This isn't a normal market — this is the early stage of a global monetary shift .
🔮 Final Thoughts
We stand at the crossroads of history .
Gold has already chosen its path.
Bitcoin is waiting in the wings.
And fiat? Under pressure.
Stay awake. Stay diversified. The next monetary standard may already be forming.
One Love,
The FXPROFESSOR 💙

GOLD MARKET ANALYSIS AND COMMENTARY - [April 21 - April 25]Earlier this week, the international OANDA:XAUUSD fell from $3,245/oz to $3,193/oz after US President Donald Trump exempted tariffs on 20 goods, including smartphones, laptops, hard drives, computer monitors and machinery used to produce semiconductors and chips. However, the US-China trade war became increasingly tense when Mr. Trump announced a tax of up to 245% on Chinese goods imported into the US, pushing the gold price to skyrocket to $3,357/oz, then adjusted down to $3,283/oz and closed the week at $3,327/oz.
Many experts believe that the unpredictable policy changes of the US President, as well as the risk of a global economic recession, especially Mr. Trump's threat to remove FED Chairman Powell...
May continue to support gold prices in the short term. In addition, the weakening of the USD has also been actively supporting the upward momentum of gold prices.
🕹SOME DATA THAT MAY AFFECT GOLD PRICES THIS WEEK:
There won’t be many important economic reports coming up next week, especially since markets will be closed on Monday for the Easter holiday.
On Wednesday, markets will get the preliminary S&P Global Composite PMI for April and new home sales data for March. On Thursday, a slew of important data will be released, including durable goods orders, weekly jobless claims and existing home sales. The weekend will close with the final report on the University of Michigan consumer sentiment index.
Markets will also be closely watching speeches from Neel Kashkari, Austan Goolsbee, Adriana Kugler and Patrick Harker, especially after notable comments from Fed Chair Jerome Powell on Wednesday.
📌Technically, gold is already deep in overbought territory, and a technical correction could be imminent before gold can move higher. Depending on the strength of the correction, gold could fall to $3,250/oz next week, followed by $3,150/oz, and then the psychological support of $3,000/oz. However, if $3,300/oz proves to be a solid support level, gold could soon break above $3,400/oz next week. It could even go as high as $3,500/oz if US-China trade tensions continue to escalate.
Notable technical levels are listed below.
Support: 3,304 – 3,300 – 3,261USD
Resistance: 3,338 – 3,372USD
SELL XAUUSD PRICE 3394 - 3392⚡️
↠↠ Stop Loss 3398
BUY XAUUSD PRICE 3243 - 3245⚡️
↠↠ Stop Loss 3239

Gold Daily Outlook Short-Term Pullback Before Trend Continuation📌 Gold Daily Outlook – Short-Term Pullback Before Trend Continuation? 💡📉
📊 Technical Overview
Gold (XAU/USD) is currently testing a key resistance zone around 3412 – 3414, where we could see short-term selling pressure emerge after recent bullish momentum. Following a strong rally, the market may be preparing for a healthy retracement to collect liquidity before resuming the trend.
The chart shows signs of a potential intraday distribution pattern forming near highs, especially as price struggles to break above resistance during the early Asian session. Today’s outlook leans toward a short-term dip into support zones before buyers potentially step back in.
🔴 SELL ZONE (Short-term Reversal Opportunity)
Entry: 3412 – 3414
Stop Loss: 3420
Take Profit: 3409 → 3400 → 3390 → 3380 → 3370
This is a high-probability reversal zone. If price prints bearish confirmation (e.g., pin bar or engulfing candle), short entries may offer favourable risk-reward setups.
🟢 BUY ZONE 1 – Minor Pullback Area
Entry: 3355 – 3353
Stop Loss: 3348
Take Profit: 3358 → 3370 → 3380 → 3390 → 3400
Ideal for quick buy setups if price reacts cleanly to this mid-structure level.
🟢 BUY ZONE 2 – Deeper Support for Trend Re-entry
Entry: 3335 – 3333
Stop Loss: 3328
Take Profit: 3338 → 3350 → 3360 → 3370 → 3380
If a deeper pullback occurs, this zone may act as a key demand area and offer clean trend continuation opportunities.
🌍 Fundamental Insight
No major economic events are scheduled today, so market direction will likely follow technical structure.
USD is showing mild intraday strength, adding some pressure on gold in the short term.
Overall sentiment still supports gold as a safe-haven, but short-term profit-taking near highs is expected after recent aggressive buying.
⚠️ Strategy Notes
Focus on trading within defined structure: Sell from resistance with confirmation; buy dips at clean support zones.
Avoid FOMO entries – let the market give you confirmation.
Always use clear TP/SL levels – especially in a sensitive market environment like this.
💬 How are you approaching gold today? Looking to fade highs or waiting for dip-buy setups? Drop your thoughts below! 👇👇👇

DeGRAM | GOLD Anchored Above the Channel📊 Technical Analysis
GOLD trades within an ascending channel, holding above $3 285 support.
A breakout from a triangle confirms bullish momentum. Key targets are $3 360 - $3 380.
💡 Fundamental Analysis
Demand is rising amid safe-haven flows, Chinese insurer interest, and central bank buying. A weaker USD and US - China tensions support gold.
✨ Summary
Technical breakout and strong fundamentals favor XAUUSD growth. Holding above $3 285 keeps the path open to $3 360.
-------------------
Share your opinion in the comments and support the idea with a like. Thanks for your support!

XAUUSD Gold Is Surging: Technical / Macro Analysis & Trade IdeaHey traders! Let’s break down the current price action on Gold (XAUUSD) using both Wyckoff and ICT concepts, and tie it all together with the latest macroeconomic context. 🚀✨
Wyckoff Methodology:
Looking at the 4H chart, we see a classic accumulation phase that transitioned into a strong markup. The recent price action shows a clear spring (liquidity sweep) below previous lows, followed by a sharp bullish move—this is textbook Wyckoff manipulation, where smart money grabs liquidity before driving price higher. The current rally suggests we’re in the markup phase, with demand overwhelming supply.
ICT Concepts:
Liquidity Zones: The chart shows a sweep of liquidity below the recent consolidation, trapping late sellers before a powerful bullish displacement. This is a classic ICT move—liquidity engineered and then swept.
Displacement: The large bullish candle breaking above the previous range signals a market structure shift (MSS) to the upside. This is a strong sign of bullish intent.
Fair Value Gaps (FVG): The impulsive move up has likely left a fair value gap (imbalance) between 3335 and 3385.50. Price may retrace to fill this gap before continuing higher.
Market Structure: The break above the previous swing high confirms a bullish market structure. As long as price holds above the 3335-3340 zone (50% retracement), the bullish bias remains intact.
Technical Trade Setups:
Bullish Scenario: Look for a retracement into the 50-61.8% Fibonacci zone (3335-3323) for potential long entries. If price forms a bullish rejection or bullish engulfing pattern here, it could be a high-probability setup targeting the recent high (3385.50) and the next extension at 3436.
Bearish Scenario: If price fails to hold above 3335 and closes below 3320, we could see a deeper retracement toward 3284 (100% retracement) or even lower, but this is less likely given the current momentum.
Market Sentiment:
Bullish 🟢 – The strong displacement, liquidity sweep, and market structure shift all point to bullish sentiment. Buyers are in control, and any pullbacks into the FVG or key fib levels are likely to be bought up.
Macroeconomic & Fundamental Drivers:
Gold’s rally is being fueled by several key factors:
CPI & Inflation: Recent CPI data shows persistent inflation, increasing demand for gold as an inflation hedge.
Interest Rate Expectations: The market is pricing in potential rate cuts by the Fed later this year, weakening the USD and supporting gold.
Geopolitical Tensions: Ongoing global tensions (e.g., Middle East, Ukraine) are driving safe-haven flows into gold.
USD Strength: Any signs of USD weakness further boost gold’s appeal.
Summary & Trade Plan:
Gold is in a strong bullish phase after a classic liquidity sweep and market structure shift. Watch for retracements into the 3335-3320 zone for potential long setups, with targets at 3385 and 3436. Stay alert for any macro news that could impact sentiment, but for now, the bulls are in control! 🏆📈
Disclaimer:
This is not financial advice. Always do your own research before trading.

Similar Bull Runs GOLD Gold is going parabolic on this run with a massive move
This can be compared to a run in previous history of gold
The price of gold moving up could be due to uncertainty in other markets, hence movement into metals and other stores of value
Weekly timeframe

How will gold trend?Last week, the market was closed and adjusted over the weekend, and the overall sentiment focused on the safe-haven properties of gold. As concerns about the U.S. debt crisis intensified and the dollar's credibility came under pressure, gold became the first choice for global funds to avoid risks, and prices continued to rise. The current U.S. dollar index hit a three-year low and lacked effective support, which further strengthened the logic of gold's rise.
Technically, the gold daily level showed a continuous rise in large positive lines, and the 1-hour moving average system maintained a golden cross upward bullish arrangement, indicating that the bulls were strong. In the Asian session, the gold price once again set a new record high of $3,376. As the gold price continued to rise, the risk of chasing highs was gradually increasing. At present, the market sentiment is biased towards bulls, but after the continuous rise in gold prices, the correction may expand accordingly. At present, the upper resistance is at 3380-3385, and the lower support is at 3353-3347. In terms of operation, it is recommended to mainly do long callbacks, supplemented by rebounds from high altitudes.
Operation strategy 1: Sell in the range: 3388-3383, SL: 3400, TP: 3370-3360.
Operation strategy 2: Buy in the range: 3355-3350, SL: 3344, TP: 3375-3385.

SPY/QQQ Plan Your Trade For The Week Of April 20-25 : CautionI want to thank all of you for the great comments and questions over the past few months.
I'm very impressed by all of you and how well many of you are picking up my techniques to improve your trading results.
This video is more of a Pre-Week review - telling you why I expect the markets to trade/trend a certain way over the next 5 to 25+ days (or longer).
Additionally, I want to remind all of you my research goes much deeper (behind the scenes) than what you see in these Plan Your Trade videos.
I know many of you rely on my morning videos and some of you have messaged me about how important my videos are in helping you prepare for the day's price range/trend.
Ultimately, I started doing these Plan Your Trade videos to highlight my SPY Cycle patterns and to prove my research is accurate and helpful. Obviously, if my technology/techniques were failures, I would be hearing about it from lots of people by now.
But that is not the case. It appears my SPY Cycle Patterns and other techniques/tools are very well appreciated and are really helping traders learn to build better skills for greater success.
And that is what this is all about.
Remember, I've been lucky enough to rub shoulders with some of the greatest traders/minds on the planet for the past 35+ years. Sometimes, we would sit down for Coffee and share ideas. Sometimes, they would hire me to explore something they thought was important (coding/research). At other times, we would simply show up at an event together and chat about life and the markets.
I was lucky.
I got into this industry in the late 1980s (a long time ago) and have continued to learn new things and build my skills over the past 35+ years.
Now, I'm trying to share some of that knowledge with all of you so you can carry this information forward and make a real difference in your life (finding success while trading).
One of the biggest things I continue to try to teach all of you is PATIENCE.
Right now, the markets are in a unique phase (consolidation in a downward trend). You are going to have to learn to WAIT for the best trade setups and try not to force the markets do to what you want.
If you are not sure what to trade, sit on the CASH until you see a better opportunity.
OK. This week, after Easter, should be fairly quiet. Tax day and Easter usually fall fairly close to one another. This year, they were on the same week.
The markets are usually very flat near Tax Day - so don't expect much in terms of trending.
Volatility is still elevated. So, we may see some wild price action this week. Trade smaller amounts if you are still unsure about direction/setups.
Get some...
#trading #research #investing #tradingalgos #tradingsignals #cycles #fibonacci #elliotwave #modelingsystems #stocks #bitcoin #btcusd #cryptos #spy #gold #nq #investing #trading #spytrading #spymarket #tradingmarket #stockmarket #silver

The Brightest Metal Right NowGold isn’t just shining, it’s on fire, burning through resistance levels as investors seek shelter from global chaos.
Figure 1: Gold Prices Climbing to New Highs
Gold surged past $3,000 per ounce this March, setting 16 record highs this year alone. While it took more than a decade for gold to gain 1,000 points previously, this time it took less than two years.
Figure 2: Correction in the Equities and Cryptocurrencies
In stark contrast, the S&P 500 has dropped 10% since its February peak, marking its first correction since 2023. Bitcoin has also plunged to $81,000, a 25% decline since U.S. President Donald Trump’s inauguration. The AI-driven momentum that propelled tech stocks and the broader equity market higher in 2024 appears to have faded.
Figure 3: Historical Reactions to Crisis
The correction in equities and crypto stands in sharp contrast to gold’s rally—an outcome that should come as no surprise given gold’s reputation as a safe-haven asset. Historically, financial crises and major market pullbacks have consistently triggered capital flows into gold as investors seek refuge from economic uncertainty.
This time, gold’s outperformance is driven by a “perfect storm” of prolonged geopolitical tensions, escalating trade disputes, political uncertainty under Trump’s second term, and a weakening U.S. dollar.
The CNN Business Fear & Greed Index, a widely used measure of market sentiment, has remained in the “fear” and “extreme fear” zones. This stems largely from Trump’s protectionist policies, which have sparked swift retaliation from U.S. trading partners. With new tariff headlines surfacing almost daily, the future of economic policy and inflation has become increasingly uncertain, injecting heightened volatility into global markets. This has, in turn, strengthened gold’s appeal as a hedge against instability.
Figure 4: Gold’s Demand is not Limited to Investors
According to the World Gold Council, investment demand for gold doubled year-over-year in 2024. However, central banks have been the real drivers of demand, purchasing over 1,000 tons of gold for three consecutive years; accounting for 21% of global demand in 2024.
The rising U.S. budget deficit and Trump’s "America First" policies have created additional risks for central banks holding large reserves of U.S. Treasuries. The ongoing tariff war not only undermines confidence in the U.S. as a reliable trade partner but also raises concerns about the U.S. dollar’s long-term stability as a safe-haven asset. This has accelerated the de-dollarization process, prompting many central banks to stockpile gold as a hedge against dollar exposure.
Unlike investors who may hesitate to buy gold at record highs, central banks operate based on mandates, making them less price-sensitive. They are willing to continue accumulating gold at elevated levels, reinforcing sustained demand for the precious metal.
Figure 5: A Weakening Dollar
Since most gold futures contracts are denominated in U.S. dollars, a weaker dollar makes gold relatively cheaper for non-U.S. buyers, supporting its price. This negative correlation between the two assets has been a key driver of gold’s recent surge.
The Trump administration has long argued that the U.S. dollar’s global dominance has kept it too strong for too long, hurting American manufacturers and contributing to deindustrialization. Further, a strong dollar reduces the price competitiveness of U.S. exports and has widened the trade deficit, leading the administration to pressure the Federal Reserve to cut interest rates.
While the Fed maintains its independence and data-driven approach, inflation trends continue to justify further easing. The market has already priced in three quarter-point rate cuts for this year, with expectations that the first cut could come as early as June.
Gaining Access to Gold
Historically, the London over-the-counter (OTC) market, operated by the London Bullion Market Association (LBMA), has been the largest gold trading center. Traders use the LBMA gold price as the global benchmark for gold transactions, including central bank purchases.
On the other hand, the futures market is the preferred choice for hedge funds, bullion dealers, refineries, and mints to hedge against price fluctuations. Retail investors also typically gain exposure to gold through futures contracts, most commonly via the COMEX gold futures market.
However, executing arbitrage strategies between the OTC and futures markets is capital-intensive and logistically challenging. Traditional arbitrage requires buying physical gold in the LBMA market at a lower price while simultaneously selling COMEX futures at a higher price. This involves storing, insuring, and shipping gold to COMEX-approved vaults, making it difficult to determine the fair value of the spread.
Figure 6: B3 Gold Futures Contract
A more accessible alternative is emerging: Brazil’s B3 Exchange will soon list a new gold futures contract referencing the LBMA gold price.
This new contract offers several advantages:
Easier arbitrage execution: Traders can capitalize on price discrepancies between the B3 contract and COMEX futures.
Lower capital requirements: The contract size is just one troy ounce, 1/100th of the standard COMEX contract, allowing for greater flexibility in position sizing and risk management.
Financial settlement: Both the B3 and COMEX one-ounce contracts are cash-settled, eliminating the logistical challenges of physical delivery.
Putting into Practice
Case Study 1: Arbitrage Strategy
Figure 7: Current Available Gold Futures
A comparison of the existing gold futures contracts highlights key differences in specifications, including fineness, contract size, and settlement methods. While these variations cater to the diverse needs of hedgers managing different gold inventories, they pose challenges for traders looking to establish arbitrage strategies due to mismatches in contract structures.
The introduction of B3’s new gold futures contract addresses these limitations by aligning closely with the COMEX 1-ounce gold contract. This structural similarity simplifies the process of determining fair value in spread pricing, making arbitrage strategies more feasible. The primary distinction between the two lies in their price settlement methods, which, interestingly, also forms the basis of arbitrage opportunities between futures and spot prices.
Additionally, traders can now take advantage of price discrepancies between the two LBMA daily fixing prices by utilizing the B3 Gold and TFEX Gold Online futures contracts. This expands the range of arbitrage opportunities and enhances market efficiency for gold traders.
Case Study 2: Directional Strategy
By considering all the factors – gold’s safe-haven appeal, geopolitical tensions, central banks accumulation, and a weakening dollar – we believe that this is not the end of the gold rally. An investor looking to express a bullish view on gold could do so by buying the B3 one-ounce futures contract, gaining exposure to gold’s price movements in a more accessible and cost-effective manner.
Conclusion
As global uncertainties mount, gold’s resilience remains undeniable. Whether as a hedge against inflation, a refuge from geopolitical turmoil, or a tool for strategic trading, gold continues to prove its value in times of crisis. With central banks stockpiling at record levels, the metal’s rally may still have room to run. For investors navigating today’s volatile landscape, gold is not just a safe-haven, it’s a strategic asset poised for continued strength. It is extremely timely to have new trading instruments like B3’s gold futures providing more accessible opportunities for investors.
For traders looking to enhance liquidity and capitalize on bid-ask spread, B3 also offers a market-making program. Interested participants can reach out to the exchange for further details.

XAUUSD H1 | Bearish Fall Based on the H1 chart analysis, we can see that the price is testing our sell entry at 3380, aligning with the 127.2% Fibo extension.
Our take profit will be at 3351.16, a pullback support level.
The stop loss will be placed at 3408.16, above the 161.8% Fibo extension.
High Risk Investment Warning
Trading Forex/CFDs on margin carries a high level of risk and may not be suitable for all investors. Leverage can work against you.
Stratos Markets Limited (tradu.com):
CFDs are complex instruments and come with a high risk of losing money rapidly due to leverage. 63% of retail investor accounts lose money when trading CFDs with this provider. You should consider whether you understand how CFDs work and whether you can afford to take the high risk of losing your money.
Stratos Europe Ltd (tradu.com):
CFDs are complex instruments and come with a high risk of losing money rapidly due to leverage. 63% of retail investor accounts lose money when trading CFDs with this provider. You should consider whether you understand how CFDs work and whether you can afford to take the high risk of losing your money.
Stratos Global LLC (tradu.com):
Losses can exceed deposits.
Please be advised that the information presented on TradingView is provided to Tradu (‘Company’, ‘we’) by a third-party provider (‘TFA Global Pte Ltd’). Please be reminded that you are solely responsible for the trading decisions on your account. There is a very high degree of risk involved in trading. Any information and/or content is intended entirely for research, educational and informational purposes only and does not constitute investment or consultation advice or investment strategy. The information is not tailored to the investment needs of any specific person and therefore does not involve a consideration of any of the investment objectives, financial situation or needs of any viewer that may receive it. Kindly also note that past performance is not a reliable indicator of future results. Actual results may differ materially from those anticipated in forward-looking or past performance statements. We assume no liability as to the accuracy or completeness of any of the information and/or content provided herein and the Company cannot be held responsible for any omission, mistake nor for any loss or damage including without limitation to any loss of profit which may arise from reliance on any information supplied by TFA Global Pte Ltd.
The speaker(s) is neither an employee, agent nor representative of Tradu and is therefore acting independently. The opinions given are their own, constitute general market commentary, and do not constitute the opinion or advice of Tradu or any form of personal or investment advice. Tradu neither endorses nor guarantees offerings of third-party speakers, nor is Tradu responsible for the content, veracity or opinions of third-party speakers, presenters or participants.

!!! GOLD !!! - Absolutely insane !Hi,
We have the first hours of opening with a big rush up!
This will certainly not end this week
This is just an idea!
Be careful

