The price action continues to be range-bound.Gold has been trading within a range for eight trading days. On the daily chart, the 10-day and 7-day moving averages are flat, and the RSI indicator is adjusting towards the midline. On the 4-hour and 1-hour charts, the Bollinger Bands are narrowing, with the price hovering around the middle band. Currently, the short-term moving averages are turning downwards, and the MACD indicator is showing a death cross signal, but it's getting closer to the zero line, so a continuation of the sideways movement cannot be ruled out.
The large-scale daily range is locked at 4050-3900. Without breaking out of this range, a clear trend is unlikely. My current view is that a break above 4050 is insufficient for a bullish outlook, while a break below 3900 would indicate a significant decline. Both bulls and bears lack sustained momentum. We have consistently emphasized that gold is currently in a consolidation phase. Don't assume a major bullish surge or trend reversal just because there's a rebound. It's still in a sideways consolidation phase, and the overall center of gravity is still shifting downwards! The trading strategy is to buy low and sell high!
Key Levels:
First Support: 3963, Second Support: 3952, Third Support: 3936
First Resistance: 4000, Second Resistance: 4010, Third Resistance: 4028
Gold Trading Strategy:
Buy: 3960-3965, SL: 3950, TP: 3980-3990;
Sell: 4035-4040, SL: 4050, TP: 4020-4010;
More Analysis →
Gold
BTC to Gold Cracking Lower! CAUTION!This could end up turning into a significant crack! for BTC relative to Gold. We have a fight on our hands between Speculation (BTC) and a Safe asset (Gold)
For over 4 years, speculation has not been able to outperform safety, and it is now starting to break lower.
CAUTION! is in order!
Click boost, follow, for more authentic, no BS, raw analysis. Let's get to 5,000 followers. ))

STAY IN THE WAVE TO CATCH THE WAVE - THE ART OF RANGE MANAGEMENTHey Everyone,
Here at GVFX, we are currently buying dips. What that means is that we buy on the dips and therefore only concentrate on long positions/buys. As mentioned before, having both sell and buy positions open in your account will affect your psychology and in turn, your trading decisions.
Now a question that typically arises here is why would it still be advisable to buy when the market is pushing down? Firstly, let me assure you that the same algorithms, experience and strategies that we use with our bullish directional bias also gives us the heads up, or down if you will, on when the market is going down. Don't think for a moment that we only know how to analyse a bull market or up trends. We share trade ideas for both Bullish and Bearish moves but choose not to hedge out of choice.
In my experience, it is much safer to get out of a stuck buy position than a stuck sell position. That's not to mention the clean PSYCHOLOGICAL PROFILE that is achieved when trading in just one direction. And although hedging can in theory work, it requires years of experience and in the end, is simply not worth the effort and psychological stress.
Let us look at an example of the current short/mid term trend to further highlight this point. When you have short-term bearish momentum down, we take buys from key supports or MAs which act as dips. Remember that the market does not go up or down in a straight line (with the rare exception of short-lived parabolic moves). So, when the market is going down and hits one of our key levels, a buy from that point will go back up for 30 to 40 pips (this number of pips has been calibrated based on back testing) before resuming back down.
You can think of it like this. The market moves in a zigzag manner. The zig is that part of the leg which is going down to create lower lows (if the downward trend is continuing). The zag is that part of the leg which takes a breather and pushes back up with momentum for our entry and quick pip-take range to create a lower high (if the downward trend is continuing) before heading back down again. We catch the right and safest waves (buys) in and out and surf to success. When price hits a key structural support or stops creating lower lows and lower highs, we then reassess for entries with a wider range of pip capture.
Hope this post helps our followers to understand how we ride waves by staying committed to one direction in order to always fall naturally into the wave rather then chasing a wave!!
GoldViewFX

LONG ON GOLD XAU/USDGold has swept sell side liquidity and has given us a choc (change or character) to the upside.
There is tons of buyside liquidity to the upside with huge FVG's (Fair value gaps) and equal highs (double top) that need to be mitigated.
I am buying gold looking to catch over 200-300 points.
That's 2000-3000 pips.

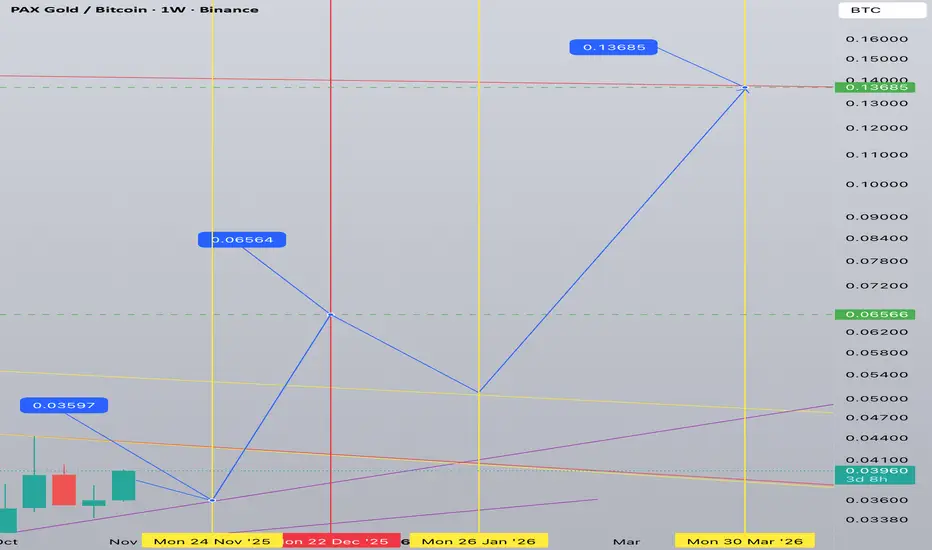
PAXG/BTC (Gold vs Bitcoin) 1W tf till March 2026Indeed BTC is in bear trend vs Gold until the end of March 2026. Gold will appreciate and this means falling crypto market in general.
Currently we are on the brink of a short correction - gold will go down/sideways in BTC terms.
After the correction we will see a rapid appreciation of gold vs bitcoin with one more correction between end of December 2025 and end of January 2026.
End of March 2026 will show us local top of PAXG/BTC.
XAU/USD) Bullish trend analysis Read The captionSMC Trading point update
Technical analysis of Gold (XAU/USD) — expecting a retracement into a demand/Fibonacci zone before a continuation to the upside toward the target at 4,030.68.
Here’s the detailed breakdown
---
Overall Idea
The analysis suggests a pullback-entry buy scenario, where Gold is expected to retrace to a key Fibonacci confluence + trendline support zone, then resume the uptrend toward 4,030.
This setup fits the Smart Money Concept (SMC) and market structure shift logic — from bearish to bullish.
---
Key Components
1. Market Structure Shift
Price broke above the descending trendline, signaling a potential bullish reversal.
The pullback is seen as a retest of the breakout zone, which often becomes a new support area.
The overall expectation is for a higher-low formation, leading to continuation upward.
2. Fibonacci Retracement Zone
The 0.5–0.79 retracement area (highlighted blue box) is the ideal buy zone.
Price is expected to tap into this area before continuing higher.
The 0.705 Fibonacci level aligns with the previous structure and EMAs, adding confluence.
3. EMA Confluence
50 EMA (3,986.37) and 200 EMA (4,007.71) are key dynamic levels.
Price is retesting around the 50 EMA, which supports the idea of a bullish continuation if respected.
Once price breaks above the 200 EMA, momentum confirmation strengthens.
4. Projected Path
The expected pattern:
➤ Pullback into 0.62–0.79 zone →
➤ Formation of a higher low →
➤ Impulsive move toward 4,030.68 target point.
The projected move aligns with structure and Fibonacci extension.
Mr SMC Trading point
---
Summary
Market bias: Bullish
Setup type: Retracement buy / Trend continuation
Entry zone: 3,975–3,985 (Fibonacci 0.62–0.79 area)
Target point: 4,030.68
Confirmation: Bullish rejection from zone or structure break above 4,000
Invalidation: Break below 3,960 (previous swing low)
---
pelas support boost 🚀 this analysis

XAU/USD) Bullish trend analysis Read The captionSMC Trading point update
Technical analysis of Gold (XAU/USD) on the 1-hour timeframe, with a clean structure suggesting continuation toward the 200 EMA. Here's the idea summary:
---
Analysis Idea: Bullish Continuation Setup
1. Structure Overview:
Price is currently trading above the ascending trendline, showing a short-term bullish bias.
The 50 EMA (3,974.93) has recently been retested and held as support.
The 200 EMA (4,011.37) acts as the next resistance / target point.
2. Setup Logic:
After a breakout above the 50 EMA, price is forming a retest zone (highlighted box).
A bullish reaction from this zone aligns with the trendline confluence and EMA support.
This suggests buyers may step in again to push price higher.
3. Entry & Target:
Entry Zone: Near 3,974–3,978 (trendline + EMA confluence area).
Target: 4,011 (200 EMA / key resistance).
Stop Loss: Below 3,965 (below the trendline and retest box).
4. Market Psychology:
Recent candles show higher lows and strong bullish momentum after rejection from previous lows.
Break and retest of dynamic resistance (50 EMA) supports bullish continuation.
Mr SMC Trading point
---
Trade Idea Summary:
Bias Entry Zone Stop Loss Target Confirmation
Bullish 3,974–3,978 <3,965 4,011 Bounce from trendline or bullish candle pattern
---
Pelas support boost 🚀 this analysis

GOLD Local Short! Sell!
Hello,Traders!
GOLD tapped into a premium supply zone, engineering liquidity above equal highs before showing bearish displacement. Expect a continuation move toward the downside imbalance. Time Frame 5H.
Sell!
Comment and subscribe to help us grow!
Check out other forecasts below too!
Disclosure: I am part of Trade Nation's Influencer program and receive a monthly fee for using their TradingView charts in my analysis.

XAUUSD: Market Analysis and Strategy for November 6th.Gold Technical Analysis:
Daily Resistance: 4080, Support: 3890.
4-Hour Resistance: 4035, Support: 3965.
1-Hour Resistance: 4025, Support: 3985.
Gold saw a strong rally in the London market, reflecting recent market volatility characterized by rollercoaster-like movements with large and rapid swings. This is typical of range-bound trading. After a rapid rise, a new plunge may follow. Avoid chasing highs after a sharp rise and avoid selling lows after a sharp fall in a range-bound market! Currently, without any major news catalysts, gold is expected to continue its range-bound movement. Focus on the short-term support/resistance level and look for a rebound to the 4030-4045 range, waiting for a pullback before buying opportunities.
BUY: 3985~3990

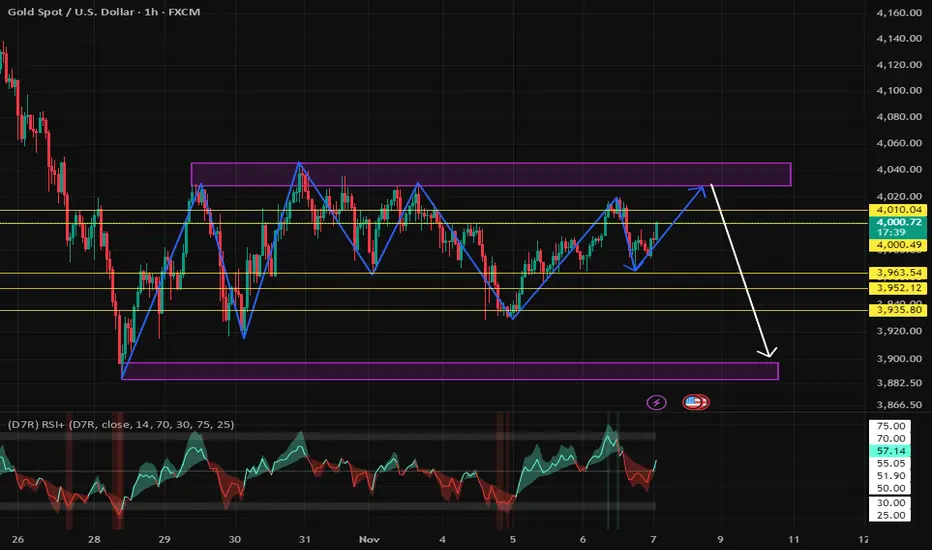
GOLD (XAUUSD): Deep Consolidation
This week is very slow for Gold.
The market is stuck within a wide horizontal range on a daily time frame.
With the absence of high impact US fundamentals, I think that probabilities will be high that the market will keep consolidating.
The best strategy to follow for now is to look for trading opportunities from the boundaries of the underlined parallel channel: selling from the resistance and buying from the support after a confirmation.
As the price is closer and closer to the resistance, wait for its test and then look for selling.
That is the plan so far.
❤️Please, support my work with like, thank you!❤️
I am part of Trade Nation's Influencer program and receive a monthly fee for using their TradingView charts in my analysis.

XAUUSD $4025 RESISTANCE NEXT?This chart displays the price action of **Gold Spot / U.S. Dollar (XAU/USD)** on an **Hourly (1h)** timeframe.
## 📈 Technical Analysis: XAU/USD
The price has been in a **consolidative or choppy phase** following a significant prior downtrend, primarily trading within a larger range defined by a **Support zone** around the **\$3,918 - \$3,925** area and a **Resistance zone** near **\$4,020 - \$4,030**.
Within this range, price action appears to have formed a **Descending Channel** (indicated by the dashed lines), suggesting a short-term bearish bias or continued correction within the broader consolidation. However, more recently, the price has broken out of the upper boundary of this descending channel.
Following the channel breakout, the price has entered a **tight, upward-sloping consolidation**, possibly forming a small **bullish flag or pennant pattern** (indicated by the solid, inner trendlines). The current candle is breaking above the upper trendline of this smaller pattern, suggesting a potential continuation move to the upside.
---
## 🎯 Price Projection
Given the breakout from both the descending channel and the smaller bullish consolidation pattern, the immediate projection is **bullish**. The target for this move is the test of the main **Resistance zone** established at **\$4,020 - \$4,030**.
* **Potential Target:** The analysis highlights a specific target around **\$4,040.5**, which represents a **1.17%** move from a breakout point and aligns with the upper boundary of the key resistance zone.
* **Validation:** Continued strength and sustained trading above the breakout level (around **\$3,980**) would reinforce this bullish projection.
* **Invalidation:** A decisive move back below the current consolidation area and the upper line of the descending channel (roughly below **\$3,960 - \$3,970**) would invalidate the immediate bullish bias and suggest a return to the broader ranging behavior or a retest of the support zone.
The overall context remains range-bound, meaning a successful test of the $\mathbf{\$4,020}$ $\mathbf{-}$ $\mathbf{\$4,030}$ **Resistance** could lead to another move back down unless there is a strong, sustained breakout above it.
Would you like me to search for fundamental news that might be impacting the price of Gold right now?

GOLD BEARS ARE STRONG HERE|SHORT
GOLD SIGNAL
Trade Direction: short
Entry Level: 4,007.34
Target Level: 3,924.43
Stop Loss: 4,062.61
RISK PROFILE
Risk level: medium
Suggested risk: 1%
Timeframe: 4h
Disclosure: I am part of Trade Nation's Influencer program and receive a monthly fee for using their TradingView charts in my analysis.
✅LIKE AND COMMENT MY IDEAS✅

Gold’s $3,900 Base May Trigger Rally to Bullish TargetsFrom both a near-term and medium-term horizon, gold appears to have established a clear reversal base around the $3,900 level, indicating that the downside momentum has likely been exhausted and that the market is preparing to advance toward its bullish target levels.

GOLD Is Very Bullish! Buy!
Here is our detailed technical review for GOLD.
Time Frame: 1h
Current Trend: Bullish
Sentiment: Oversold (based on 7-period RSI)
Forecast: Bullish
The market is on a crucial zone of demand 3,965.68.
The oversold market condition in a combination with key structure gives us a relatively strong bullish signal with goal 3,993.60 level.
P.S
Overbought describes a period of time where there has been a significant and consistent upward move in price over a period of time without much pullback.
Like and subscribe and comment my ideas if you enjoy them!

XAU/USD – Smart Money Awakens, Targeting Premium Liquidity ZonesGold has shown a powerful Change of Character (CHoCH) on the H4 timeframe — signaling a potential shift in short-term market structure. After sweeping liquidity beneath 3,940, price rebounded decisively, breaking minor highs and forming a Break of Structure (BOS) around 3,981 — a clear footprint of Smart Money re-entry at discount levels.
💭 1️⃣ Market Structure – From Weakness to Strength
For several sessions, Gold moved within a declining structure, printing lower highs and lower lows. However, the recent BOS and CHoCH indicate that the bearish momentum is fading.
Smart Money seems to have absorbed liquidity below 3,940 — where retail sellers were trapped — and is now repositioning for a possible move toward premium supply zones above 4,030.
The key structure level 3,981 – 3,948 now acts as the accumulation base, where institutional buy orders were likely placed.
🩶 2️⃣ Supply & Demand – The Footprints of Smart Money
Karina identifies three critical levels shaping this next movement:
Demand Zones:
3,981 – 3,948: Recent bullish order block (H4) and structural demand zone — price should ideally retest this before expanding higher.
3,937: Deep liquidity pocket from previous sweep; if retested, it could be a strong re-entry area for Smart Money.
Supply Zones:
4,030 – 4,047: A key bearish order block (OB) and first liquidity magnet for buyers.
4,047 – 4,051: Final buy-side liquidity zone, where price could face institutional distribution.
🧭 3️⃣ Liquidity Context – When the Market Breathes Before Expansion
The sell-side liquidity at 3,886 has already been taken, leaving buy-side liquidity resting above 4,030+.
This suggests the next directional play is upward, targeting premium levels to rebalance inefficiency and collect orders before any deeper retracement.
Karina expects price to potentially pull back to 3,981 – 3,948, find support, then push toward 4,047 – 4,051 before reacting downward — a classic SMC retracement-expansion pattern.
🌙 4️⃣ Trading Outlook – Align With Institutional Flow
Bias: Short-term bullish into supply; mid-term neutral awaiting distribution.
Scenario:
If Gold retests 3,981 – 3,948 and forms a bullish confirmation (rejection wick or engulfing candle), Smart Money likely aims for the 4,030 – 4,051 region.
Entry Zone: 3,948 – 3,981
Stop Loss: below 3,937
Take Profit: 4,047 – 4,051
This setup offers a clean 1:4 R:R, aligning perfectly with liquidity-based execution principles.
🌷 5️⃣ Reflection – When the Market Speaks Softly, Smart Money Listens Closely
Gold is whispering signs of strength after weeks of uncertainty. For Karina, this is a phase of quiet accumulation — not chaos, but calm intent.
In moments like these, patience becomes power 🌙 — and the most elegant trades often come from listening, not chasing.
This analysis reflects Karina’s personal perspective and is not financial advice.
Do you think Gold will sweep the 4,050 liquidity before reversing? Let’s discuss below 💬

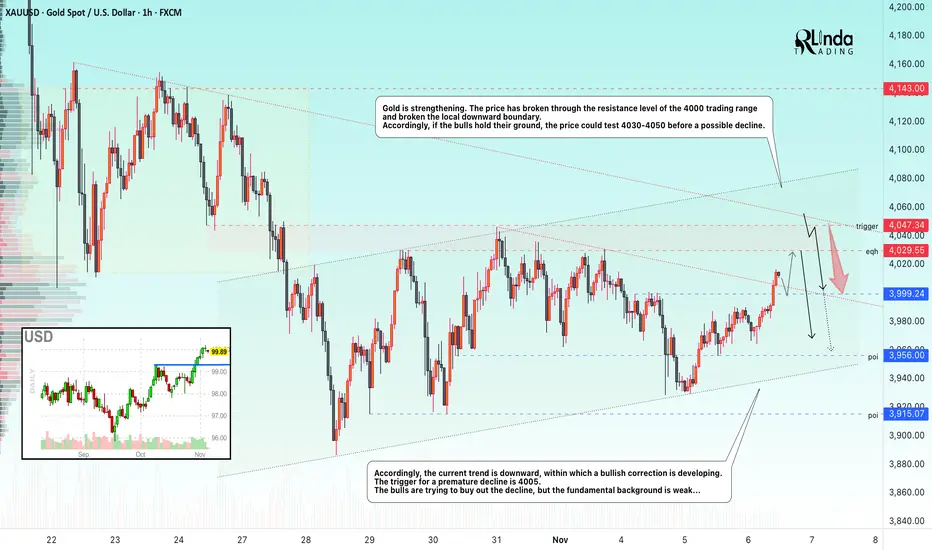
GOLD → The market is trying to buy back the decline...FX:XAUUSD continues to consolidate in the $4000 zone, failing to develop a rebound in the middle of the week. The price remains in a sideways trend for the eighth day in a row, waiting for a driver that will finally move the price forward...
Reasons for market restraint:
Strong US data: growth in ADP private employment, growth in the ISM services business activity index, lower odds of Fed easing, the probability of which has fallen to 62% for December...
However, the ongoing government shutdown and the delay in employment and inflation data are supporting the metal...
Gold is looking for new catalysts. A break above $4030-$4050 will require weak US data or an escalation of risks, which is not currently the case.
Resistance levels: 4030, 4050
Support levels: 4000, 3967, 3955
As the specified resistance is reached, the potential for further growth may be exhausted, and in this case, a false breakout could lead to a correction to 4K. However, if support does not hold the decline, this phase could last much longer. I am not yet talking about further growth beyond 4050, as the fundamental background is weak and there has been no reaction to this zone yet, since the price is still far from the level...
Best regards, R. Linda!